On the Interpretation of “off the edge” Avalanches
Abstract
We establish both experimentally and theoretically the relation between off the edge and internal avalanches in a sandpile model, a central issue in the interpretation of most experiments in these systems. In BTW simulations and also in the experiments the size distributions of internal avalanches show power laws and critical exponents related with the dimension of the system. We show that, in a SOC scenario, the distributions of off the edge avalanches do not show power laws but follow scaling relations with critical exponents different from their analogous for the internal avalanche distributions.
pacs:
45.70.Ht, 45.70.-n, 05.65.+bSince Bak, Tang and Wiesenfeld (BTW) developed in 1987 the ideas of self-organized criticality (SOC)Bak et al-1987 ; Bak et al-1988 , a great amount of research in phenomena as diverse as earthquakes, superconducting vortex dynamics, stock markets, and ecology Bak-1996 ; Jensen-1998 ; Altshuler-2000 ; Altshuler-2004 has been carried out. A sandpile illustrates this concept: the slow addition of grains onto a flat surface provokes the growth of a pile with slopes around a critical angle adjusted through an avalanche mechanism. According to SOC, the avalanches should not show any characteristic size or frequency, and the distributions of avalanche sizes and durations are robust relative to variations of external parameters; i.e., the system self-organizes. The result is that the pile will show robust power law distributions of avalanche size and duration, “” power spectra, and finite-size scaling of the distribution of internal avalanches, measured as the movements of the grains within the totality of the system.
Although several experiments have been carried out trying to find the critical behavior predicted from the BTW model in real piles, the results have not shown a clear agreement. This is due, in part, to the fact that in most experiments only avalanches that involve grains abandoning the system (the so-called off the edge avalanches) can be measured. Held and co-workers Held et al-1990 , using particles between mm, reported SOC characteristics when the base of the pile was small enough, but when it increased, quasiperiodic large avalanches appeared. This was later corroborated by Rosendahl et al.Rosendahl et al-1993 ; Rosendahl et al-1994 . With a similar setup, but using 3 mm diameter spheres, Grumbacher et al.Grumbacher et al-1993 and Costello et al.Costello et al-2003 did not find any lost of SOC behavior when the relation base diameter/particle size of their piles exceeded the value predicted in Held et al-1990 ; Rosendahl et al-1993 ; Rosendahl et al-1994 . Their piles were also quite sensitive to the drop height. In “1D” piles, Frette et al.Frette et al-1996 , using rice with grains of different shapes, concluded that SOC behavior was attained only for grains with relative high aspect ratio, because they were able to decrease inertial effects, not considered in the theory. In contrast with previous experiments, they were able to measure not only off the edge avalanches, but those along the surface of the pile. Also with elongated rice grains, but in a 3D geometry, Aegerter et al.Aegerter et al-2003 found scaling relations measuring the avalanches as variations in the surface of the system. In our previous work on off the edge avalanches in “1D” piles Altshuler et al-2001 , the inertial effects of the 4 mm diameter spheres used were avoided by introducing strong disorder, reached thanks to a base with beads glued with random gaps between each other. We claimed that these piles show SOC behavior, based on the good critical size scaling of the resulting avalanche distributions and on the fact that the “active zone” practically involved the whole system. As we have seen, none of the experiments have measured the avalanches in the whole system, but only in a portion of it. In most of them, only the off the edge avalanches were considered.
In the first part of this paper we measure the avalanches at several portions of the grid in a two-dimensional BTW computer simulation, demonstrating that power laws should not be expected in the size distributions of off the edge avalanches. After the avalanche distributions from the simulations are fitted using an appropriate ansatz, we use the resulting equations to predict analytically the critical exponents of the corresponding finite size scalings. The second part reports experiments performed in a setup similar to that used in Altshuler et al-2001 where the position of the center of all beads are obtained after each addition. As a result, both the internal and off the edge avalanches are measured, showing a non power law for the distributions of the latter, and a power law with the same critical exponents expected from the 2-D BTW model for the size distributions of internal avalanches.
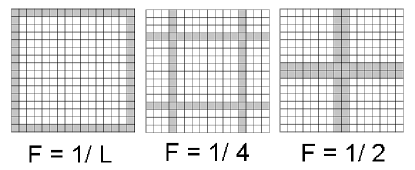
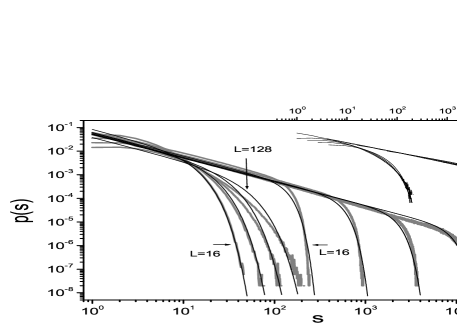
We perform a BTW computer simulation on a squared lattice, following the same rules as in reference Bak et al-1987 . The avalanches (defined as the number of sites involved in toppling events) were measured in the whole grid (internal avalanches) and also in the rows and columns sites away from the borders, where is a fraction of (see Fig. 1). Then, the avalanche distribution for coincides with the off the edge one. The size distributions for internal and off the edge avalanches are shown in Fig. 2. A cursory inspection of it gives the certainty that the distributions of off the edge avalanches are not power laws, while the internal avalanches exhibit a clear power law behavior over a few decades. However, internal avalanches and those corresponding to different values of are just manifestations of the same dynamics, so we propose the following ansatz to fit all of their size distributions
| (1) |
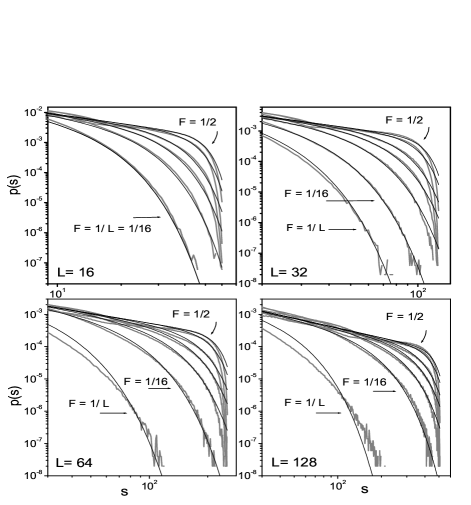
where is the total number of sites considered for the avalanche measurements and , where is the average distance from the center of the grid to all the sites of the zone of measurement next . is constant for internal avalanches and for avalanches in the -dependent sites. The fits to the 2-D BTW simulations presented in Figs. 2 and 3 were reached with for the internal avalanches and , and for those in the -dependent sites.
Having reached the equations that fit the tails of all the distributions, we can obtain the values of the critical exponents for their finite size scalings analytically. If we consider a generic slope and we write as , where is the dimension of the measurement area, we get
| (2) |
When the scaling relation is applied to a family of curves (in a log-log plot) they move following a straight line of slope ; which suggests that if they collapse under scaling relations, it is due to the fact that there is an overall power law mechanism related with them; therefore, the avalanche distributions of -dependent sites would have the same critical behavior as the internal ones. In order to analyze that, let us define and , then
| (3) |
For internal avalanches , , and is constant; then we have and . As the slope is , we get . For the other distributions , where . For constant distributions and , then
| (4) |
so and . We can consider , and calculate the corresponding values for ; or consider (obtained from the values of and for the internal avalanche distributions), and calculate the values. All the critical exponent are shown in Table 1. For off the edge avalanches , and , then
| (5) |
thus, and , with the same assumption that in the latter case. The inset of Fig. 2 and Fig. 4 show all the distributions for the simulations when the finite size scalings were applied. The best collapses were reached with the critical exponents shown in Table 1. The match between values guarantees the quality of the fits. A simple inspection of the values from the simulation indicates that the correct assumption is constant . Until here, we have shown that, within the BTW model, the distributions of avalanches measured in proportional portions of the grid behave similarly as in the whole system; i.e., same values of , and very close to , with some corrections which depend on how far from the center of the system they are. However, the distribution of off the edge avalanches do not show a power law behavior but collapse when scaling relations are applied. The critical exponents do not correspond to their analogous from the internal avalanche distributions, since their avalanches do not involve sites located at constant fraction of the system size, but depend on the system size as . The relation is a consequence of for the off the edge avalanches, and it is independent from the system dimension. Now we present experiments in real piles where these ideas are corroborated.

The experimental setup is similar to our previous one Altshuler et al-2001 and it consists of an acrylic strip sandwiched between two parallel vertical glass plates apart from each other so that a horizontal surface of (where , ) was available for the formation of a pile of diameter steel beads. The base consists of a row of the same type of beads glued to the surface with random spacings (0, 1, 2 or 3 mm) between them.
| avalanche | analytic | simulations | experiment | ||||
| distribution | |||||||
| internal | - | ||||||
| off the edge | |||||||
| (C) | |||||||
| (B) | |||||||
| (A) |
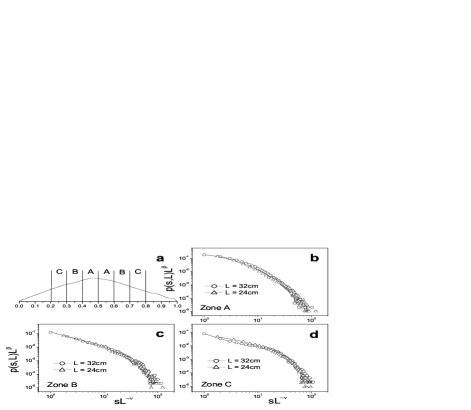
They were dropped one by one from a height of above the apex of the pile. Both lateral sides of the base were open, so the beads were able to fall off the system. The whole setup was computer controlled in such a way that a digital camera took an image of the pile and then a new bead was added only after all motion associated to the previous impact had stopped. A parallel software found the center of each bead, and stored its position. We define an internal avalanche of size when beads moved in the whole pile (we define “movement” as a displacement of the center of a bead not smaller than of its diameter when successive images are compared). The experimental equivalent of the sites studied in the simulations, was the measurement of avalanches (movements) in different portions of the pile (see Fig. 6a). An off the edge avalanche has a size when beads fell off the pile after a dropping event. Each experiment included more than 50 000 avalanches, with an average total duration of 250 h. The avalanches previous to the attainment of the “steady” average pile size were not taken into account for the statistics.
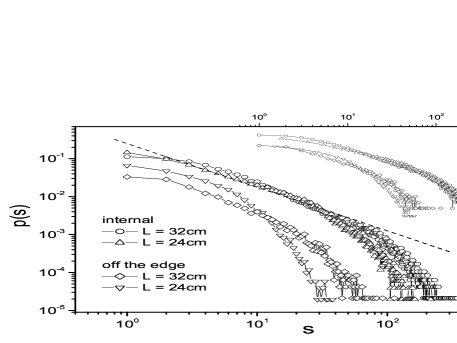
Fig. 5 displays the size distribution of the internal avalanches and of off the edge ones for two system lengths. The distributions of internal avalanches show a power law regime over two decades with a slope equal to -1.15. The critical exponents (also in Table 1) are and , very close to those expected from the BTW model in two dimensions. This demonstrates that our system is not truly one-dimensional, but that the avalanches penetrate the bulk of the pile. The distributions of off the edges avalanches, in agreement with the previous simulations, display curves that are not power laws but collapse when appropriate scaling relations are applied. In our case it happened with and . The same exponents were found when the gapran curves from Altshuler et al-2001 were re-normalized to the total number of avalanches and the scaling relations applied. A value of indicates that the avalanches that leave the pile involve more than one dimension, i.e., more than a layer of one bead width on the profiles next . The exponent values are associated with geometrical properties of the system, but they are related each other by . From this view, the power laws experimentally found in off the edge avalanches distributions in conical piles may be due to their similitude to the internal ones as a consequence of the small size of the systems.
The avalanches in different portions of the pile (Fig. 6) behave in a similar way to the internal ones for the whole system showing the same values of . The differences in area between the zones provoke variations in the values of . This was corroborated reducing the width of the zone B in a 30. Then both its area and its value coincide with their analogous for the zone C. All this reaffirms the fact that the differences between the critical exponents between off the edge and internal avalanches are due to the fact that the former ones involve zones that are not a fixed proportion of the system length.
In conclusion, we have explained why several experiments involving off the edge avalanches do not show the expected power laws in their avalanche distributions, but they do follow scaling relations. We have also demonstrated the existence of SOC behavior in a pile of grains provided its components are able to establish a high degree of inner disorder, needed to spread activity in the totality of the system. As a consequence scalings of off the edge avalanche size distributions can be safely taken as an indication of power law behavior of the internal avalanche size distribution in a model sandpile.
We thank C. Noda and O. Arés for collaboration in the experiments, G. Rojas-Lorenzo for his help at the computer cluster at InSTEC and R. Mulet for valuable suggestions. The ACLS/SSRC Working Group on Cuba is acknowledged for providing access to several journals.
References
- (1) P. Bak, C. Tang and K. Wiesenfeld, Phys. Rev. Lett. 59, 381 (1987)
- (2) P. Bak, C. Tang and K. Wiesenfeld, Phys. Rev. A 38, 364 (1988)
- (3) P. Bak, How Nature Works - The Science of Self Organized Criticality (Copernicus, New York, 1996)
- (4) H.J. Jensen, Self-Organized Criticality, Emergent Complex Behavior in Physical and Biological Systems (Cambridge University Press, Cambridge, 1998)
- (5) E. Altshuler, Some Contemporary Problems in Condensed Matter Physics, edited by S.J. Vlaev, L.M. Gaggero-Sager and V. Droeglazov, Contemporary Fundamental Physics (Nova Science Publishers, Inc., Commack, NY, 2001)
- (6) E. Altshuler and T. H. Johansen, Rev. Mod. Phys. 76, 471 (2004)
- (7) G.A. Held, D.H. Solina, D.T. Keane, W.J. Haag, P.M. Horn, and G. Grinstein, Phys. Rev. Lett. 65, 1120 (1990)
- (8) J. Rosendahl, M. Vekic, and J. Kelley, Phys. Rev. E 47, 1401 (1993)
- (9) J. Rosendahl, M. Vekic, and J.E. Rutledge, Phys. Rev. Lett. 73, 537 (1994)
- (10) S.K. Grumbacher, K.M. McEwen, D.A. Halverson, D.T. Jacobs, and J. Linder, Am. J. Phys. 61, 329 (1993)
- (11) R.M. Costello et al., Phys. Rev. E 67, 041304 (2003)
- (12) V. Frette, K. Christensen, A. Malthe-Sørenssen, J. Feder, T. Jøssang, and P. Meakin, Nature 379, 49 (1996)
- (13) C.M. Aegerter et al., Phys. Rev. E 67, 051306 (2003)
- (14) E. Altshuler, O. Ramos, C. Martínez, L.E. Flores, and C. Noda, Phys. Rev. Lett. 86, 5490 (2001)
- (15) O. Ramos, A.J. Batista-Leyva, and E. Altshuler, to be published.