Polaronic excitations in CMR manganite films
Abstract
In the colossal magnetoresistance manganites polarons have been proposed as the charge carrier state which localizes across the metal-insulator transition. The character of the polarons is still under debate. We present an assessment of measurements which identify polarons in the metallic state of La2/3Sr1/3MnO3 (LSMO) and La2/3Ca1/3MnO3 (LCMO) thin films. We focus on optical spectroscopy in these films which displays a pronounced resonance in the mid-infrared. The temperature dependent resonance has been previously assigned to polaron excitations. These polaronic resonances are qualitatively distinct in LSMO and LCMO and we discuss large and small polaron scenarios which have been proposed so far. There is evidence for a large polaron excitation in LSMO and small polarons in LCMO. These scenarios are examined with respect to further experimental probes, specifically charge carrier mobility (Hall-effect measurements) and high-temperature dc-resistivity.
pacs:
75.47.Lx, 71.38.-k, 72.80.-r, 78.20.-eI Introduction
Since the discovery of the colossal magnetoresistance effect in thin films of La2/3Ca1/3MnO3 by Helmolt et al.,von Helmolt et al. (1993) the properties of doped perovskite manganites have been a focal point of research in correlated electronic systems. These compounds reveal a variety of ordinary and exotic ground states, for example spin, orbital or charge order, cooperative Jahn-Teller (JT) distortions or electronic phase separation, as a result of a delicate interplay of orbital, spin, charge, and lattice degrees of freedom. While in the early days research concentrated on the appearance of colossal magnetoresistance (CMR), more recently also issues like orbital order, the importance of electron-phonon coupling, or phase separation scenarios promoted among the topics of interest. Optical spectroscopy, in both single crystals and thin films, has contributed to unravel the complex physics and provided insight into the importance of electron-phonon coupling for modelling the optical conductivity in the manganites.
Okimoto et al.Okimoto et al. (1997) and Kaplan et al.Kaplan et al. (1996) reported on a large transfer of spectral weight from high to low energy with decreasing temperature for La1-xSrxMnO3 single crystals and for Nd0.7Sr0.3MnO3 thin films, respectively. The observed temperature dependence is consistent with the theoretical approach by Millis et al.,Millis et al. (1996) who went beyond Zener’s double exchangeZener (1951) and included dynamic JT polaron effects. Subsequent studies in crystallineJung et al. (1998); Kim et al. (1998); Saitoh et al. (1999); Lee et al. (1999) and thin filmQuijada et al. (1998); Machida et al. (1998) samples confirmed the existence of the mid-infrared (MIR) excitation for a large number of manganites. In this context the concept of small (SP) and large polarons (LP) as essential ingredients to understand the electronic transport properties and the MIR excitation (labeled polaronic peak in the following) became subject of considerable theoretical efforts.Röder et al. (1996); Lee and Min (1997); Millis et al. (1996); Alexandrov and Bratkovsky (1999) In contrast to an optical transition between electronic bands, a characteristic feature of a polaronic absorption process is the significant frequency shift with temperature (see, for example, Ref. Rubinstein, 1999).
The shape of a polaronic resonance in the optical conductivity is predicted by theory whereby the details strongly depend on the nature of the polaronic excitations: large polarons exhibit a threshold behavior and a coupling dependent structureGurevich et al. (1962); Goovaerts et al. (1973) whereas small polarons display an asymmetric Gaussian peak;Reik and Heese (1967); Emin (1975) these latter polarons may even pair to form bipolarons with their own characteristics.Alexandrov and Bratkovsky (1999); Zhao et al. (2000) The assignment “large” or “small” polaron usually refers to the spacial extension of the lattice distortion induced by a single charge carrier. True to the literature (for example, see the review by Emin on optical properties of polaronsEmin (1993)) one would denote a lattice distortion generated by an electronic charge as a small polaron if it collapses to a single site — the smallest state compatible with the atomicity of a solid. Correspondingly, all polaronic states with extension larger than a lattice spacing are labelled large polarons. A large polaron does not necessarily extend over a large number of sites. However, since we have no direct means of determining the size of the polaronic cloud from optical spectroscopy, we instead refer to the related shape of the absorption spectra: threshold behavior for large polarons versus asymmetric Gaussian peak for small polarons.Emin (1993)
For the metallic manganites, a clear identification of the polaron type and the respective model is disputable not only because other electronic correlations may correct or even replace the standard polaronic physics but also because the statistics of the rather dense polaron system may strongly influence the shape of the resonance. Actually, small polarons which are trapped in a locally polarized lattice are less affected by finite doping. The MIR absorption may still be visualized in terms of transitions between the adiabatic levels of neighboring sites. The presence of other localized polarons at more distant sites will renormalize the polaronic energy scale (the binding energy) and it will raise the high-frequency wing of the resonance due to additional multi-polaron processes. However, a finite density should affect less the low-frequency wing, that is, absorption at energy less than the binding energy. In this work we will provide further optical conductivity and dc-resistivity data which confirm this small polaron scenario for thin films of La2/3Ca1/3MnO3 (LCMO).
By contrast, a large-polaron resonance should be influenced profoundly by a finite density of polarons due to their spacial extension and possible delocalization. A perturbational approach for small electron-phonon coupling at finite charge carrier density was presented recently by Tempere and Devreese (TD).Tempere and Devreese (2001) In fact, if we compare the one-polaron absorption of Gurevich, Lang and Firsov (GLF)Gurevich et al. (1962) to the finite density result of TD, we notice that the low frequency behavior above the threshold is dictated by different power laws. Whereas the one-phonon absorption is characterized by a square root behavior, the fermionic statistics of many polarons leads to a linear density of states of particle-hole excitations at the Fermi edge which is in fact reflected in the threshold behavior of the absorption. In a recent paperHartinger et al. (2004a) we proposed to identify the MIR resonance in thin films of La2/3Sr1/3MnO3 (LSMO) by large polarons of this type.
Here we extend the preliminary discussion of our previous work in order to elucidate the distinct polaronic behavior in the metallic phase of manganites with strong (LCMO) and intermediate-to-weak electron-phonon coupling (LSMO). The purpose of our discussion is also, to a certain extent, a critical review of those polaronic models which have been proposed to identify the resonance in previous measurements with bulk samples. We observe that hitherto the proposed theoretical models are not capable of capturing all the aspects of a polaronic metal like LSMO. Notable details of the MIR spectra are in disagreement with the available theoretical models. A more comprehensive theory which offers an explanation particularly for the temperature-dependent shift of the polaronic resonance and for the magnitude of the spectral weight on the high-energy side would probably clarify the nature of the polaronic metal.
Using thin films in contrast to single crystals, we achieve a lower conductivity due to grain boundaries and strain. Snyder et al. (1996) Consequently screening is effectively reduced — to a level where phonons and polarons are well observable in the optical conductivity, even in the metallic phase. This allows the detailed analysis of phononsHartinger et al. (2004b, c) and polaronsHartinger et al. (2004a) from the respective optical data. Besides, the optical properties of single-crystal samples are more sensitive to surface preparation which, in particular, influences the MIR-region.Takenaka et al. (1999)
The role of the lattice mismatch on the structural and transport behavior in dependence of the film thickness has been systematically investigated in numerous articles. In particular it depends on the substrate/film combination and on the growth conditions. In general thicker films show a behavior very close to that of bulk Biswas et al. (2001) whereas substrate induced effects become more important in thinner films. Walter et al. (2000)
The structural differences between La2/3Ca1/3MnO3, which is orthorhombically distorted, and La2/3Sr1/3MnO3 with its rhombohedral symmetry represent promising conditions to distinguish between competing polaronic models. We discuss those models which adequately reproduce the low energy side of the resonance, as these excitations characterize the nature of the observed polarons.
II Experimental Analysis
II.1 Details and Characterization of the Films
The thin films were grown by a standard pulsed laser deposition techniqueChristey and Hubler (1994) on plane-parallel mm2 single crystalline substrates: LSMO on (LaAlO3)0.3(Sr2AlTaO5)0.7 (LSAT) and LCMO on NdGaO3. Thin films with thickness between 200 nm and 400 nm were investigated. The nominale lattice mismatch is 0.1% for both.
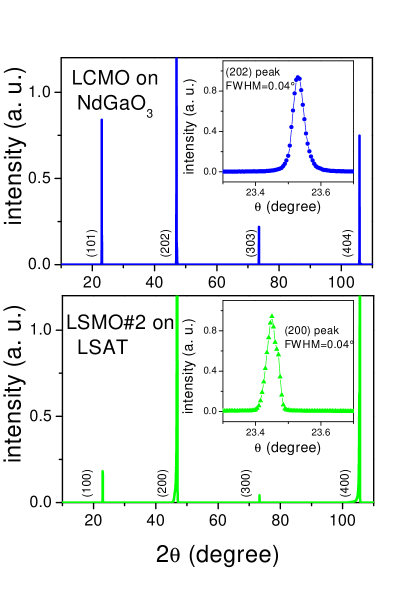
X-ray diffraction (XRD) measurements were performed using a Bruker D8 Discover four circle x-ray diffractometer. In Fig. 1 we show x-ray diffraction patterns () obtained for LCMO on NdGaO3 (upper panel) and LSMO on LSAT (lower panel). For LCMO/NdGaO3 the XRD displays only (l0l) diffraction peaks for Pnma and for LSMO/LSAT only (l00) diffraction peaks for Pm3m symmetry. For both compounds there exist no indications of any impurity phase. This points to the highly oriented crystal growth of the films. The insets of Fig. 1 exhibit the rocking curves of the (202) peak for LCMO and the (200) peak for LSMO. Both films show a very narrow full width at half maximum (FWHM) of the rocking curve of 0.04∘ which give evidence for a high quality crystalline structure of the films.
Reflectivity measurements of the film-substrate system were carried out in the range of 50 to cm-1 using the Fourier transform spectrometers Bruker IFS 113v and Bruker IFS 66v/S. Below room temperature the measurements were performed with a He-cryostat where the sample is placed in a static He exchange gas. The spectra at higher temperatures were taken in a home made oven in which the sample was exposed to a continuous flow of heated nitrogen gas. In addition, a Mach-Zehnder interferometer was used for ac measurements between 10 and 30 cm-1 which allowed to obtain both the intensity and the phase shift of the wave transmitted through the films on the substrate. Such transmission measurements of thin films have proven to be a powerful method for studying the electrodynamic properties of highly conductive thin films at low frequencies.Kozlov and Volkov (1998) The combined data sets improve the Kramers-Kronig (KK) analysis of the film-substrate system in the complete frequency range. For the analysis, the reflectivity was extrapolated by a constant for frequencies below 10 cm-1. For the high frequency region, the reflectivity between cm-1 and 106 cm-1 was extrapolated by a law. Above, a dependence was assumed. The same procedure was utilized in separate experiments for the respective substrate. Applying the Fresnel optical coefficients for a two-layer system, the optical conductivity of the film was evaluated. A more detailed description of the data analysis is given in Ref. Heavens, 1991.
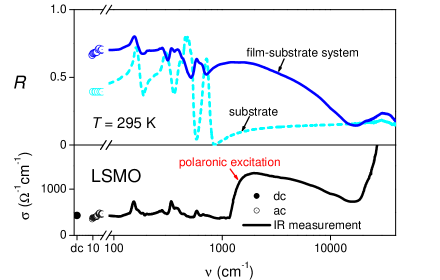
For room temperature the combined data sets of IR and ac reflectivity are shown for the film-substrate system and for the bare substrate in the upper panel of Fig. 2 while the calculated conductivity is displayed in the lower panel. Most phonon resonances of the substrate are located in the minima of the film-substrate spectra. In the metallic phase the screening shields the lattice modes of the substrate, therefore only resonances of the thin film are visible. The temperature dependence of the phonon resonances provides for an exact determination of the film properties independently of the influence of the substrate. Moreover, the resonances known from neutron scattering measurementsReichardt and Braden (1999) are in good agreement with our results.
The electrical dc-resistivity of the films was measured with a standard four-point technique.Hartinger et al. (2004c) We estimate the defect level in relation to the single crystal. Due to stronger strain effects and a higher density of grain boundaries, the defect level in LSMO #2 is about 12 times higher and in LSMO #1 about 24 times than in the single crystal. For LCMO a single crystal was not available but the residual resistant is almost the same as for LSMO #2.
The magnetization was obtained with a commercial Quantum Design SQUID magnetometer. The measurements were carried out for the substrate and for the deposited film. The data were reported in a previous publication,Hartinger et al. (2004c) and a single crystal measurement is found in Ref. Hartinger et al., 2004b for comparison. To characterize the ferromagnetic to paramagnetic (FM-PM) and the metal-insulator (MI) transition of the samples, we define as the magnetic Curie temperature and is determined from the maximum of the dc resistivity curves. For LSMO the onset of spontaneous magnetization appears at 345 K, well below K, while for LCMO K coincides with .
II.2 Experimental Results
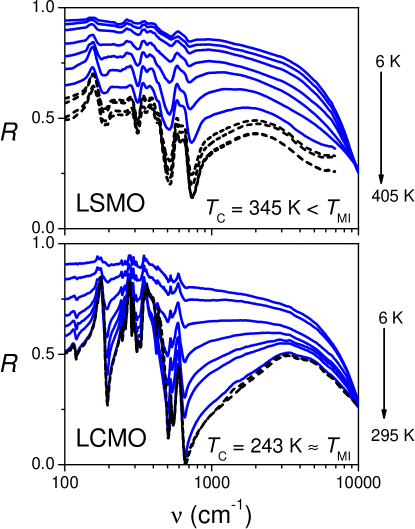
The reflectivity spectra for frequencies below the optical transitions are displayed in Fig. 3 for LSMO (upper panel) com (a) and for LCMO (lower panel). The solid lines represent the spectra for temperatures in the metallic FM pase while the broken lines refer to those in the PM phase. The series of sharp peaks below cm-1 were identified as phonon modes. A detailed analysis of the phonon excitations in these films has been presented in a previous article.Hartinger et al. (2004c) The identification of the infrared-active phonons attests the quality of the thin films. In the following we focus on the excitation above cm-1, which has been assigned to polarons before.Kaplan et al. (1996); Okimoto et al. (1997); Jung et al. (1998); Kim et al. (1998); Saitoh et al. (1999); Lee et al. (1999); Quijada et al. (1998); Machida et al. (1998); Hartinger et al. (2004a)
For increasing temperatures the polaronic resonance in the optical conductivity continuously shifts to higher frequencies and, moreover, a loss of spectral weight is observed — as has been discussed in Ref. Hartinger et al., 2004a. Both quantities, frequency and amplitude of the resonance, will be listed in Tabs. 1 and 2 for LCMO and LSMO, respectively, linked to specific theoretical models. There is a remarkable difference in the shape of the polaron peak for LSMO and LCMO. In LSMO the shape is asymmetric and displays a steep slope below the peak position, whereas for LCMO the broader hump is more symmetric about its maximum and a low frequency threshold is entirely missing.
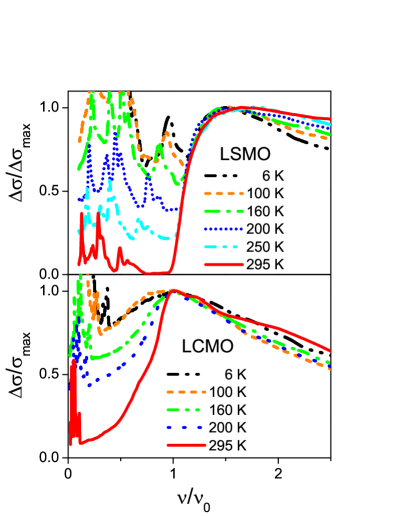
When we scale by a typical energy of the polaronic resonance we find a universal low-energy slope for the LSMO spectra (upper panel of Fig. 4) whereas this scaling behavior is absent in the LCMO spectra (Fig. 4, lower panel). For this presentation, is the threshold on the low-energy side of the MIR-resonance of the LSMO spectra and the frequency at the maximum of the MIR resonance of the LCMO spectra, respectively. To retrieve the threshold frequency for LSMO, one has to take into account that a background adds to the polaronic absorption close to the threshold. We assume that the 295 K data approximately display the background for the considered frequency window: the phonon resonances are sufficiently far below so that they should interfere very little with the polaronic resonance, and the frequency dependence of the intensity of excitations responsible for the background is negligible for the considered frequency window in which we address the scaling behavior. We then extrapolate the low frequency slope of the curves at all other temperatures to this “zero line” in order to identify . Strictly speaking, depends slightly on the extrapolation procedure. This qualitative distinction of the LSMO and LCMO spectra has to be addressed in a thorough theoretical modelling.
III Further evidence for small and large polaron scenarios
III.1 Holstein SP hopping
The MIR optical conductivity displays distinct polaronic excitations for LSMO and LCMO. It is expected that this distinction also manifests itself in a disparate dc-resistivity for the two types of manganite films.
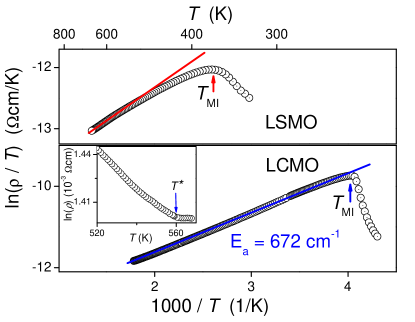
In Fig. 5 we show the high temperature dc-resistivity of LSMO (upper panel) and LCMO (lower panel) in a vs. scale. In the lower plot a linear dependence for the latter compound above is clearly visible. Slightly above , which coincides with the magnetic ordering temperature, deviations from the thermally activated behavior occur. It is widely accepted that the electron-phonon coupling is sufficiently large to localize the carriers in the paramagnetic phase — presumably in combination with other localization mechanisms. Over a temperature range from K the electrical dc-resistivity is well described by the adiabatic SP model Emin and Holstein (1969) (lower panel) with a dc activation energy cm-1, which is in agreement with previously reported results.Jaime et al. (1996); Snyder et al. (1996); Worledge et al. (1996); Zhao et al. (2000) In general the binding energy of the SP in the optical data (see Tab. 1) is related to the activation energy of the transport data by . The maximum in the optical conductivity in the paramagnetic phase ( K) is located around cm-1, which is rather than the theoretically expected . The discrepancy between the transport value and the optical value is not surprising since it was also observed in other polaronic systemsBi and Eklund (1993) (including the classical small polaron material TiO2; the difference has been discussed by ReikReik (1972) and Austin,Austin and Mott (1969) and for the manganites by Hohenadler and EdwardsHohenadler and Edwards (2002)).
Neutron scattering measurements for single crystal sample were interpreted in terms of ”single polarons” and ”correlated polarons” (see, e.g. Ref. Dai et al., 2000; Nelson et al., 2001) — the existence of which is supposed to be consistent with a phase separation scenario:Dagotto (2005) Alvarez et al. Alvarez et al. (2002) predict uncorrelated magnetic clusters in a temperature range . Below the clusters align their moments. Above single polarons are expected to dominate the transport.Dagotto (2005) In fact, for LCMO we find a kink in the high temperature dc-resistivity data (see in the inset of Fig. 5). We tentatively identify this kink at 560 K with . This observation is qualitatively consistent with film and single crystal results reported in Ref. Snyder et al., 1996 but we question their interpretation according to which the kink is a signature of a structural transition. Rather it appears that the different slopes depend on various scattering processes of correlated and single polarons, and the temperature characterizes the crossover.
Previously, it has been reported that correlated polarons have been found only in the orthorhombic phase (LCMO).Kiryukhin et al. (2003) This observation may be related to the distinct high temperature behavior in LCMO and LSMO. For LSMO we identified LP-type excitations from the optical conductivity data. Figure 5 (upper panel) shows the high temperature dc-resistivity from K. Clearly, the adiabatic SP model (solid line) provides a poor fit to the experimental data (compare the discussion in Ref. Lyanda-Geller et al., 2001).
The temperature dependence of the JT distortion for La0.7Sr0.3MnO3 has been investigated more recently by Mannella et al.Mannella et al. (2004, 2005) with x-ray absorption spectroscopy. They provide direct experimental evidence for the presence of polarons in the paramagnetic state and analyze the dopant dependence of the JT distortion. Specifically, the variance of the Mn-O bond length distribution in the Sr doped sample was shown to be only half that in the Ca doped sample.
III.2 Charge Carrier Mobility
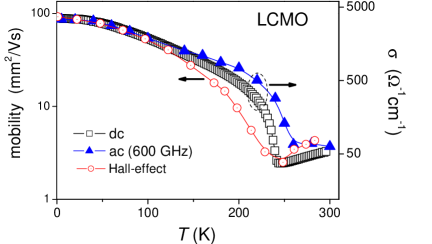
Further support for the SP concept in LCMO and the LP ansatz in LSMO comes from the literature on the polaron mobility. Figure 6 compares the temperature dependence of the dc- and ac-conductivities (right axis) with the mobility (left axis) obtained by Hall-effect measurements by Jakob et al.Jakob et al. (1998) The carrier mobility decreases with increasing temperature in the FM phase. Above the mobility increases slightly. All three measurements show the same overall temperature behavior. The deviation close to may be due to different coupling mechanisms of the local transport properties to critical magnetic fluctuations.
The decrease of the mobility in the FM phase corresponds to the increase of the effective electron-phonon coupling (polaron energy over bandwidth). Moreover, the spectral weight of the polaronic excitation is reduced on increasing temperature.Hartinger et al. (2004a) As a consequence, with decreasing lattice distortions, the tendency to charge localization is reduced.
For LSMO only few Hall effect studies have been reported, none of them providing values of the polaron mobility .Lyanda-Geller et al. (2001); Mandal et al. (1998); Asamitsu and Tokura (1998) Therefore, only a rough estimate as mm2/Vs at 4.2 K is possible,Asamitsu and Tokura (1998) which is four times larger than in LCMO (Fig. 6). The ratio of the mobilities corresponds well to the ratio of the effective masses of specific-heat measurements,Wang et al. (2001) and reveals the expected tendency. We propose that optical and Hall transport consistently support the applicability of a LP-type approach. This interpretation is also in agreement with neutron scattering results where the spacial extension of the polaron covers several lattice constants at low temperatures: Louca and Egami Louca and Egami (1999) investigated deviations of the local structure from the average crystal structure in La1-xSrxMnO3 by pulsed neutron scattering with pair distribution function analysis. X-ray absorption fine structure measurementsShibata et al. (2003); Mannella et al. (2004) differ for the metallic phase quantitatively, but all groups identify a temperature-dependent lattice distortion.
IV Discussion of the MIR spectra
Early on the double exchange (DE),Zener (1951); Anderson and Hasegawa (1955) in combination with a strong Hund coupling, was identified as a key element to explain the interrelation between metallicity and ferromagnetism in the doped manganites. It has only recently been understood that further basic mechanisms have to be an integral part of a comprehensive model that can explain magnetotransport properties and the transition to the paramagnetic phase. Millis, Littlewood and ShraimanMillis et al. (1995) elaborated that the DE mechanism is not sufficient to reproduce the measured resistivity for temperatures of the order of . They suggested that, in the presence of a strong electron-phonon coupling, polaronic effects have to be included. Dagotto, Hotta and MoreoDagotto et al. (2001) promoted that intrinsic inhomogeneities are generated through the cooperative effect of phase separation tendencies, long-range Coulomb interaction and disorder, and these inhomogeneities are supposed to dominate the transport behavior.
In the following discussion on the nature of the MIR resonance, we will consider only the polaronic models with no refinement of electron-electron interactions or disorder physics. This disregard of some of the essential ingredients of a comprehensive microscopic model for manganites is in general not justified. However, a solution to such a “comprehensive model” is at present not available, certainly not for an authoritative evaluation of the MIR optical conductivity. On the other hand, some of the electronic correlations missing in the polaron models would enter only as effective parameters, such as the temperature-dependent kinetic energy, or the projection on one spin direction. Consequently, these correlations do not necessarily have to be disentangled from a more microscopic modelling. Finally, the purpose of our discussion is also a critical review of the polaronic models which have been previously related to the resonance. We reemphasize that in the considered thin films, the resonance is more pronounced and the shape is well resolved so that a refined analysis is now attainable with our data.
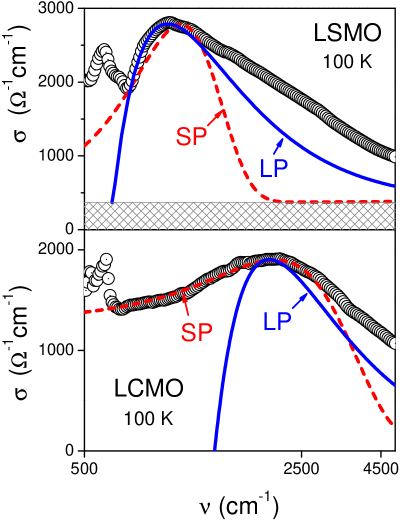
A small polaron in the regime of sufficiently strong electron-lattice coupling is excited from a site-localized state to another well-localized state at an adjacent site.com (b) The maximum of the absorption, that is the most probable process, is the Franck-Condon like transition with frequency four times the activation energy for the intersite transition.Reik (1972); Mahan (2000) The MIR conductivity then has the form of an asymmetric Gaussian peak centered around . Whereas the optical conductivity of LCMO approaches this shape and therefore is identified as a small polaron, the optical conductivity of LSMO does not (compare Fig. 7).
A large polaron is observed usually in the weak coupling regime. Then, to first order in the electron-lattice coupling, the optical absorption is the excitation of a phonon with a simultaneous excitation of the charge carrier GLFGurevich et al. (1962). Consequently, one finds a threshold behavior at the (optical) phonon frequency with a sharp increase in the absorption rate due to the available scattering states and a slow decrease at the high-energy side controlled by a -factor, most easily identified in the force-force correlation function form of the conductivity.Mahan (2000) For intermediate to strong electron-lattice coupling, if the polaron is in a self-trapped state, the threshold is determined by the polaron binding energy, with the charge carrier scattering into an extended state (EminEmin (1993) assumes a free-carrier state). The initial upturn of the absorption spectrum is again given by the phase space of the available scattering states. The shape of the observed optical conductivity appears to be qualitatively similar to that in the GLF- and Emin-approaches, and we tentatively identify the polaronic resonance for LSMO as the excitation of a large polaron (see Fig. 7). The validity of such models to the manganite films will be investigated in the following sections.
The asymmetric shape of the MIR resonance with the steep increase on the low-energy side is quite spectacular for the investigated LSMO films. As argued before, the upturn of the optical conductivity above the threshold is controlled by phase space considerations. For example, if the electronic states created by the absorption process are particle-hole excitations close to a Fermi edge, the number of such states increases linearly with the energetic distance (frequency) to the edge. Whatever the details, one may expect a scaling behavior of LSMO, at least for the initial increase above the threshold. This scaling would signify that the low energy scattering processes are of the same origin, independent of temperature, related band narrowing and other energy scales. In fact, a universal low-frequency slope has been verified for the LSMO spectra (Fig. 4, upper panel) but it is absent for LCMO which neither displays a threshold on the low-energy side of the MIR-resonance ( Fig. 4, lower panel).
IV.1 Small polarons in LCMO
Various experimental data sets on both, ferromagnetic and paramagnetic manganites, have been interpreted in terms of the Holstein small-polaron theoryEmin and Holstein (1969) (see our previous section, and also the critical discussion on this issue in Ref. Edwards, 2002). An extension of the standard SP optical conductivity formulaReik (1972); Emin (1975) has been proposed for the evaluation of the low-temperature optical spectroscopy:Puchkov et al. (1995); Yoon et al. (1998)
| (1) |
Here is the SP binding energy, is the dc conductivity, signifies a broadening, and is the characteristic vibrational energy, which is in the high-temperature regime and at low temperatures (). Eq. (1) constitutes a broad resonance with a maximum at . For high temperatures, the dc-conductivity results from the thermal activation over the potential barrier () between adjacent sites and the optical conductivity peaks at the frequency () of the Franck-Condon-like transition for neighboring potential energy curves, which are approximately parabolic in the configurational coordinates. For low temperatures, the processes are similar, however the phonons which participate in the activated hopping are not thermal.
The dashed lines in Fig. 7 present the optical conductivity of a SP, Eq. (1). The shape for low frequencies, including the maximum, is well reproduced for LCMO. The SP model nicely describes the experimental results for 100 K using cm-1 and a characteristic phonon energy cm-1. The disagreement between theory and experiment for higher frequencies is not unexpected (it has also been observed for the classical small polaron material TiO2, and several mechanisms were proposed to account for the difference;Kudinov et al. (1970) see also the SP evaluation for the 2d nickelates and cupratesBi and Eklund (1993)). As seen from Tab. 1 and Tab. 3, with rising temperature the polaron formation energy increases. For LCMO the binding energy () rises from 2210 cm-1 (6 K) to 6040 cm-1 (250 K). Above the metal-to-insulator transition at , the polaron formation energy remains constant.
| (K) | 6 | 100 | 160 | 200 | 220 | 240 | 250 | |||||||
|---|---|---|---|---|---|---|---|---|---|---|---|---|---|---|
| (cm-1) | 1410 | 1270 | 930 | 685 | 410 | 130 | 90 | |||||||
| (cm-1) | 2210 | 2820 | 3720 | 4080 | 5020 | 5700 | 6040 | |||||||
| (cm-1) | 217 | 270 | 340 | 335 | 330 | 270 | 270 |
Whereas one may expect that the low-energy SP absorption is well explained by the processes described above — since they are local —, one has to consider the consequences of a high polaron concentration and Fermi energy for the high-energy SP absorption in order to understand the slow decay observed in experiments. Especially for temperatures of the order of polaron-polaron interaction appears to be strong,Dai et al. (2000); Nelson et al. (2001) however a relation to the high-energy slope of the polaronic MIR resonance is not evident.
An explanation of the high energy decay and of the temperature dependence of the polaron binding energy is beyond the scope of this paper. A transfer of spectral weight towards higher energies was discussed within a dynamical mean field theory of the Holstein model by Fratini et al.,Fratini (2001) however, their treatment only applies to a dilute nondegenerate polaron gas. The shape and position of the polaronic MIR resonance for a model with Fermi edge and a finite concentration of polarons has been investigated by Millis, Mueller and Shraiman (MMS).Millis et al. (1996) They study the DE model with a JT form for the electron-phonon coupling. The local phonons are taken as classical harmonic oscillators, and the electronic correlations are evaluated within the DMFT scheme. For half filling (, with the orbitals singly occupied) and intermediate coupling, MMS compare their optical conductivity favorably with the data of Okimoto et al.Okimoto et al. (1995, 1997) for La0.875Sr.175MnO3 — and for somewhat stronger coupling with the data of Kaplan et al.Kaplan et al. (1996) for Nd0.7Sr.3MnO3. Also our optical data agree qualitatively with the latter results of MMS though the high frequency side again decays too fast in the model evaluation. The broad peak is due to transitions between the two JT split levels with a strongly fluctuating phonon coordinate. The actual results for the evaluation of doped systems are less favorable: a second peak below is formed which is due to transitions to unoccupied sites with no JT splitting. It appears to contradict the observations. However, MMS argue that further electronic correlations which have not been included can remedy this shortcoming.
Some of the quantum fluctuations missing in MMS are included in the “many-body CPA” treatment of the Holstein-DE modelcom (l) for which Hohenadler and EdwardsHohenadler and Edwards (2002) compare the MIR optical conductivity with the measurementsKaplan et al. (1996) for Nd0.7Sr.3MnO3. The shift of spectral weight to lower frequencies with decreasing temperature is still insufficient. Perroni et al.Perroni et al. (2001) propose that their variational Lang-Firsov treatment recovers the low temperature behavior,com (m, n) including a Drude peak.
IV.2 Bipolaron theory for the optical conductivity
The crossover from the paramagnetic to the ferromagnetic phase in the optical absorption has been studied by Alexandrov and BratkovskyAlexandrov and Bratkovsky (1999) in terms of a bipolaron model in which the optical intraband conductivity should be provided by two different polaronic contributions originating from SP and bipolarons with different binding energies. Accordingly, in the PM phase the optical conductivity would be dominated by small bipolaronic charge carriers, which break up at the magnetic transition, leaving only SP which then dominate the MIR excitations in the FM regime. As a result, a sudden transfer of spectral weight at is predicted along with a sharp drop in the dc-resistivity due to the charge carrier collapse. As such a transfer is not confirmed by our data, we rather discard such a scenario for LSMO and LCMO, even though the oxygen-isotope effect on the thermoelectrical power in several ferromagnetic manganites seems to provide experimental clues for bipolaron formation.Zhao et al. (2000)
IV.3 Large polarons in LSMO
We will now inquire if models, which have been recently proposed in this context, indeed reproduce the observed scaling and threshold behavior for LSMO. For this purpose, we organize this Section IV.3 as follows:
In a first approach we will use a well-controlled weak coupling scheme (see Sec. IV.3.1) which follows from a RPA-evaluation of the Hubbard model to which a Fröhlich type electron-phonon coupling has been added. As we only consider the ferromagnetic metallic state we restrict the evaluation to the spin polarized sector (spinless fermions). The local interaction signifies the on-site interaction between charge carriers in the two -orbitals. The RPA-results well approximate the low-frequency slope of the polaronic resonance and reproduce the observed scaling. In fact, the model replicates the most prominent and important characteristics of the polaronic spectra in LSMO. However it fails to treat the high energy features adequately.
In a second approach we investigate intermediate and strong coupling schemes for large polarons (see the end of Sec. IV.3.1 and the Section IV.3.2 on self-trapped polarons). The latter scheme was proposed recently,Kim et al. (1998) in order to identify the MIR absorption processes in bulk manganites as excitations from a localized self-trapped state to free-carrier continuum states (the authors of Ref. Kim et al., 1998 refer to the model presented by Emin in Ref. Emin, 1993). The shape of the polaronic resonance in LSMO is well reproduced for the low energy side and the model may account for a shift of the threshold energy with increased binding (at higher temperatures). However the theoretical (strong coupling) estimate of the polaron radius differs significantly from the radius which fits the experimental data. Moreover, the approach does not apply when a Fermi surface of the (free) charge carriers is formed.
Finally, in Sec. IV.3.3 we discuss the consequences when charge carriers are excited from a potential well to a Fermi surface. The collective behavior associated with the response of the Fermi sea to the transition determines the shape of the resonance in the adiabatic limit (in which the potential well decays slowly with respect to the fast electronic transition). A full evaluation of this fascinating scenario is not yet available.
IV.3.1 Weak coupling scenario
The shape of the MIR resonance in the LSMO films is reminiscent of the weak coupling result by GLF for Fröhlich polarons (see, for example, Ref. Mahan, 2000 and Eq. (4) below). A closer inspection reveals that the width of the GLF absorption is too small and the low-frequency slope is too steep to fit the LSMO data (see Fig. 8). This failure is not unexpected since we have – charge carriers per cm3, as identified from Hall measurements.Mandal et al. (1998) An extension of the GLF weak-coupling polaron theory to a finite concentration has been carried out by Tempere and Devreese.Tempere and Devreese (2001) In their work on optical absorption of an interacting many-polaron gas, they found a remarkable agreement between their theoretical prediction and the experimental curve for Nd2CuO4-yCalvani (2001) in the optical conductivity around 1000 cm-1. We now transfer their approach to the manganites.
The real part of the optical conductivity is expressed through a momentum integral over the dynamical structure factor which is in three space dimensions:Mahan (2000); Tempere and Devreese (2001)
| (2) |
Here, is the polaron density, is the effective mass of the charge carriers, is the electron-lattice coupling and is the threshold energy for polaronic absorption (in weak coupling, it is the energy of the respective optical phonon). The dynamical structure factor is expressed in terms of the dielectric constant :Mahan (2000)
| (3) |
where is the density of charge carriers which should be identified with the polaron density for the considered finite concentration. TD evaluated Eq. (2) to linear order in which implies that is taken to zeroth order in the electron-lattice coupling. The dielectric constant is then approximated by the Lindhard (or RPA) expression for the homogeneous electron gas. In this linear approximation (with respect to ), TD argue that, for the low-density limit, the GLF result is recovered. Indeed, for fermions with one flavor, the structure factor approachescom (c) . The optical conductivity assumes the limiting form of GLFGurevich et al. (1962) (cf. Fig 8):
| (4) |
For the manganites in the investigated ferromagnetic, metallic regime with a carrier density of – cm-3, we take the following standard simplifications for the low-temperature evaluation: (i) only one spin direction prevails (spinless fermions), due to DE and strong Hund coupling, (ii) there are two degenerate orbital states (the two -levels); accordingly we deal with two flavors for the fermionic particles, (iii) the interaction is represented by the local Hubbard for two fermions on the same site in two orbital states, and not by the long-range Coulomb interaction , (iv) the fermions acquire a quadratic dispersion. The last assumption may be refined to the appropriate two-band dispersion of the -levels. However, for the discussion of the optical conductivity it is of minor importance, especially when we primarily discuss the low-frequency excitations with energy much less than the Fermi energy. Furthermore, a dynamical JT effect is not implemented: it is entirely missing in this weak coupling approach of TD.
The longitudinal dielectric response in the Hubbard model (with quadratic dispersion) is in RPA:
| (5) | |||||
The related expression for the Coulomb gasLindhard (1954) is usually not presented in a closed form. Here care has been taken to ensure that this closed expression for the dielectric response is valid for all complex values of .
The optical conductivity is (cf. the similar expression in Ref. Tempere and Devreese, 2001 for the Coulomb gas model)
| (6) |
whereby
is the prefactor which already appears in the GLF-limit, and
is a dimensionless prefactor which accounts for the finite charge carrier density. The integration variable in Eq. (6) is the normalized wavevector . The dielectric response in the Hubbard model, Eq. (5), and the optical conductivity, Eq. (6), are in a simple way related to the respective expressions for the Coulomb gas if we substitute in Eqs. (5) and (6) the interaction parameter by
| (7) |
where is the dimensionless interaction strength of the Coulomb gas, .
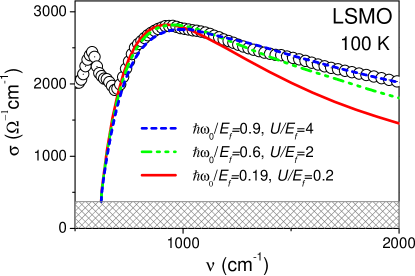
Finally, we adjust the parameters tentatively in the following way: a) the density of charge carriers is cm-3, which is the stoichiometric number of doped holes and which is in the range of what has been estimated from Hall measurements,Mandal et al. (1998) b) we take three times the bare electronic mass () which is consistent with specific heat measurements,Salamon and Jaime (2001) c) since cm-1 for the density of (a) and for the effective mass of (b), and since we read from the 100 K data cm-1 we fix , that is, we are in the adiabatic regime, and d) in order to start, for a first estimate, with small electronic interactions for which RPA is a reasonable approach.
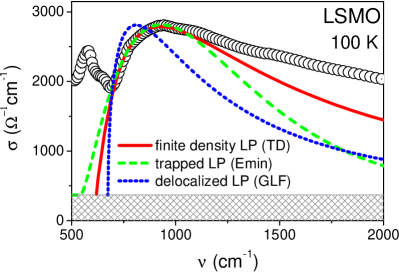
For this parameter set we find from Eq. (6) a shape of the polaronic resonance (see Fig. 8) which reproduces well the experimental data for frequencies up to the maximum. The high energy slope, however, decreases more rapidly than in the measured optical conductivity. The maximal optical conductivity is, in our calculation, which should fit the data with — whereby the shaded background in Fig. 8 is to be subtracted.
If we had taken the Coulomb gas (as TD did for Nd2CuO4-y) with the same density, effective mass and the same ratio as above for the Hubbard model, we would find nearly the same line shape (not distinguishable in the plot). The dimensionless interaction strength then is and the plasma frequency is at . Since the plasmon is consequently far outside the frequency window of our investigation it is not surprising to have similar results for the Coulomb-gas and Hubbard-model approach for these reasonably large densities. However, the maximal optical conductivity is in the Coulomb gas case. This implies an electron-lattice coupling of the order of 20, which is probably too largecom (d) by a factor of 5 to 6 — apart from the fact that the Coulomb gas model is not quite appropriate for these manganites. We conclude that the Hubbard model, rather than the Coulomb gas approach, is the proper model Hamiltonian provided that also an electron-phonon coupling term is added.
The solution, Eq. (6), suggests to determine the model parameters through an “optimal fit”, now including the high frequency slope. The shape of the optical conductivity in this approach only depends on , and the fine tuning fixes the value of . For small values of , such as for the above value 0.19, the absorption shape is nearly independent of , except that the magnitude () scales down with increasing .com (e) A better fit is found with larger values of . The optimal values are and (see Fig. 9). If we again assume that the density of charge carriers is cm-3, we are constrained to . Alternatively, we could fix but then we have to assume a strongly reduced polaron density of cm-3. The drawback of this “optimal fit” however is that , in the first case, and , in the second case, both of them too small to be reasonably close to experiment. We deduce from this investigation that the high energy side cannot be satisfactorily captured within this model. The high energy slope with its complex cooperative excitations has to be explored with more involved theoretical concepts which necessarily depend on a larger parameter set. However, this does not invalidate the evaluation for the universal low energy side.
For the 6 K data, the low energy side of the polaronic resonance was fitted successfully in our previous paper.Hartinger et al. (2004a); com (a) For the sample presented here we find cm-1, which implies that . With we have a nearly identical fit to that of Fig. 4 in Ref. Hartinger et al., 2004a which generates sufficient spectral weight so that the electron-phonon coupling can be chosen to be of order 1. This situation is qualitatively similar to that with the 100 K data. The same applies to higher temperatures. We may assume that temperatures as high as 295 K are still considerably smaller than the Fermi energy. Then temperature does not explicitly enter the dynamical response but it is supposed to tune the band width, and correspondingly the Fermi energy and effective mass, and possibly (see the discussion below on this last presumption).
Assessment of the weak coupling approach. From the above discussion we deduce that a value of and , is a reasonable choice for low temperatures to acquire sufficient optical weight in this approach. Thereby, the precise values of and just control the overall magnitude of the polaronic resonance provided that applies.com (f) Furthermore, for the considered frequency range above the threshold, we are always sufficiently close to the Fermi edge in order to approximate the frequency dependence of the imaginary part of by which accounts for the number of excited low-energy particle-hole pairs. Moreover, since the frequency dependence of the absolute value of is weak, we expect the optical conductivity, Eq. (6), to approach
| (8) |
where is a frequency independent amplitude. Indeed, this formula matches the frequency dependence of so closely for the considered adiabatic regime of that it is indistinguishable from the curve generated by the full weak coupling relation, Eq. 6 (Figs. 8 and 9, continuous lines).
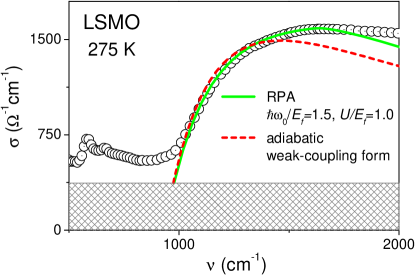
For higher temperatures, is not necessarily true since increases considerably (see Table 2). Also the effective mass of the charge carriers increases with temperature — due to a reduced double exchange — which implies a reduced Fermi energy. For the 275 K data we present in Fig. 10 the evaluation of Eq. (6) with a Fermi energy five times smaller than for the low temperature fit. The dimensionless energy parameters now take the values and . Obviously, the RPA-result approximates the low frequency slope of the polaronic resonance at 275 K with the same rigor as for 6 K or 100 K. As anticipated, the adiabatic weak-coupling result (Eq. (8), see dashed line in Fig. 10) now does not exactly match the full evaluation but the deviations are still minor. To gain the spectral weight of the measured polaronic resonance, the electron-coupling has to be larger for the 275 K evaluation: . This is to be expected since, with increasing mass, the coupling should also be enhanced.com (d) Although the weak coupling approach, Eq. (8), is not fully applicable for this intermediate-coupling regime at high temperatures, the result is still so convincing that we propose to discuss all data sets, irrespective of temperature, within the presented approach.
The curves for all considered temperatures have the shape which is approximated by Eq. (8) for low frequencies, with the threshold replaced by . This statement agrees with the conjectured scaling behavior for the low frequency slope, examined at the beginning of the subsection on large polarons — see Fig. 4, in which the low-frequency behavior was actually extrapolated to the “zero line” with Eq. (8). The parameters for this scaling form, the amplitude and the threshold frequency , are displayed in Table 2.
| (K) | 6 | 100 | 160 | 200 | 250 | 275 | 295 | |||||||
|---|---|---|---|---|---|---|---|---|---|---|---|---|---|---|
| (cm-1) | 593 | 617 | 666 | 765 | 865 | 978 | 1183 | |||||||
| (10cm-1) | 18.3 | 16.3 | 14.3 | 12.4 | 9.5 | 7.9 | 6.4 |
Shortcomings of the weak coupling approach are the unexplained (temperature dependent) threshold frequency and the unmatched slope at the high frequency side when we use a reasonable parameter set in order to reproduce the spectral weight. The coupling parameters are, with this restriction, in the small coupling regime. The power law decay at the high energy side is in Eq. (8) whereas the observed power law is closer to for the 6 K and 100 K data (and approximately for the 275 K data).
The latter shortcoming should not be taken as a serious flaw of the presented concept. The phase space for excitations increases strongly when the excitation energy deviates from the proximity of the Fermi energy and, moreover, the absorption through such “high energy” excitations is by no means universal. We cannot expect that the simple treatment within RPA with quadratic dispersion can still capture these high-energy excitations correctly.
The failure of the weak coupling approach to account for the (temperature dependent) threshold frequency is more disturbing. The threshold in this approach is fixed at the respective frequency of the lattice deformation which will not shift from about 593 cm-1 (threshold for 6 K) to 1183 cm-1 (threshold for 295 K). Resolving this issue seems to require a type of intermediate-coupling model where the threshold is renormalized but the shape of the absorption spectrum is similar to the shape in the weak coupling approach. A possible scenario is that of Kartheuser, Evrard and Devreese (KED, Ref. Kartheuser et al., 1969; see also the review by Mitra et al.,Mitra et al. (1987) section 2.6, for further references and for a discussion of the literature on this topic). KED propose that the optical absorption for intermediate coupling consists of a relatively narrow zero-phonon peak, assigned to a “relaxed excited state” (RES), and of a broad (multi phonon) sideband, with threshold at above the zero-phonon peak. Here, is the frequency of the LO phonon. Consequently the threshold will shift with the frequency of the RES which is dependent on the electron-lattice coupling. This coupling hinges on the electronic band width which in turn depends, for the manganites, on temperature. This scenario implies that a RES resonance exists at below the polaronic continuum and that it shifts with temperature as the threshold frequency in our data. However, such a temperature dependent RES has not been observed as an additional sharp resonance for the manganites, neither in the optical conductivity nor in Raman scattering. For this reason we consider the KED scenario inapt to explain the temperature shift of the threshold in the metallic LSMO films.
In spite of these shortcomings, it should be appreciated that, with respect to the standard polaronic models, this TD-like approach implements a Fermi surface. Short-range Coulomb interactions are included within a controlled weak coupling scheme. Both, Fermi statistics and Coulomb interaction, lead to substantial consequences for the shape of the polaronic absorption spectrum.
As we already pointed out, a dynamical JT effect is missing in this weak coupling approach. Mannella et al. investigated the temperature-dependent JT distortion (see Fig. 3 of Ref. Mannella et al., 2004). The temperature dependence of the variance of the Mn-O bond length distribution corresponds with the temperature dependent shift of the polaronic MIR excitation for both, LSMO and LCMO (see the inset of Fig. 2 in Ref. Hartinger et al., 2004a). It would be highly desirable to have an evaluation which parallels the calculations of Millis, Mueller and Shraiman Millis et al. (1996) for large polarons. For their local modelling they find a temperature dependent shift of the polaronic resonance for sufficiently strong coupling in the undoped case. However, it is not yet conceivable how such a scheme can be set up for extended excitations as the large polarons.
IV.3.2 Self-trapped polarons
The formation of large polarons in the manganites has been debated before. Röder, Zang and BishopRöder et al. (1996) studied the crossover from a large polaronic state to a quasi-self-trapped state for a single hole in the adiabatic limit, applying a variational technique for the DE model with the inclusion of one effective JT mode. They used a mean-field evaluation for the spin degrees of freedom and neglected other electronic correlation effects. The optical absorption has not been considered in this approach.
Kim, Jung and NohKim et al. (1998) propose that their optical conductivity spectra of polycristalline LCMO (La0.7Ca0.3MnO3) display a sharp Drude peak and a broad MIR absorption band which is to be explained as coherent tunnelling and an incoherent band of large lattice polarons, respectively. They particularly emphasize that, with their electrodynamic analysis, the large polaron should be in a strong coupling regime — a polaronic state which indeed has not been realized in other physical systems because the polaron would usually collapse to a small polaron state for strong coupling. However, it is not obvious how to identify the large polarons from their optical conductivity data. A fit to the large polaron picture by EminEmin (1993), the model to which the authors of Ref. Kim et al., 1998 refer to, has not been presented. The steep low-frequency slope of this type of polaronic absorption cannot be resolved in their data. However, since in our thin film optical spectra of LSMO we can clearly identify such a threshold behavior, we will now reinvestigate Emin’s phenomenological approach in some detail.
The absorption process arises from exciting a carrier from the ground state in its (self-trapping) potential well to a free-carrier state, invoking the Franck-Condon principle. In this intuitive approach, neither the mechanism which is responsible for the self-trapping nor the nature of the extended states are specified. The optical absorption is calculated by applying Fermi’s Golden RuleEmin (1993) which requires the identification of the initial and final charge carrier state. Here we slightly deviate from Emin’s evaluation by picking a Gaussian localized state instead of a hydrogenic ground state as initial state. The polaron energy of is lower and it is better confined (see, for example, Ref. Mitra et al., 1987). The “Gaussian” result for will deviate not significantly from that for the hydrogenic state. The initial localized electronic wave function is , and the final free-carrier wave function is . Emin assumes free-carrier states with quadratic dispersion which, for the optical absorption, translates into a frequency dependent wave vector: , where is the threshold frequency for the absorption ( is the energy difference between the localized ground state and the lowest continuum state). The optical conductivity is then:
| (9) |
The best fit for the 100 K data is displayed in Fig 8. If we assume that , consistent with specific heat measurements,Salamon and Jaime (2001) and cm-1 we find a polaron radius from this fit of approximately , where Å. Correspondingly, the diameter of the polaronic (ground) state is about 2.5 lattice constants (for , the diameter is more than 4 lattice constants). The maximum height of the resonance fixes the prefactor of Eq. (9): the polaron density is estimated for to a value of cm-3 (and for to cm-3). The values for and are reasonable in this context and support this approach. We point out that the hydrogenic ground state, as introduced by Emin and considered in our previous work, generates a polaron radius which is already unacceptable small.Hartinger et al. (2004a)
Next we discuss the scaling behavior introduced above (see Fig. 4, upper panel). If we rescale and as
| (10) |
respectively, and if we also introduce a dimensionless radius
| (11) |
we identify the rescaled optical conductivity as
| (12) |
which only depends on the dimensionless radius . If is independent of temperature, the observed scaling is also true for this approach. For the 100 K data, . The fits for the other temperatures produce (see Table 3), a range which is sufficiently narrow to support the observed scaling within this approach.
| (K) | 6 | 100 | 160 | 200 | 250 | 275 | 295 | ||||||||
|---|---|---|---|---|---|---|---|---|---|---|---|---|---|---|---|
| (cm-1) | 526 | 543 | 580 | 650 | 777 | 876 | 1060 | ||||||||
| 1.22 | 1.17 | 1.13 | 1.15 | 1.14 | 1.10 | 1.15 | |||||||||
| 1.96 | 1.86 | 1.73 | 1.67 | 1.51 | 1.37 | 1.31 | |||||||||
| (1021cm-3) | 2.8 | 2.7 | 2.6 | 2.4 | 2.34 | 2.26 | 2.1 |
Even so, is the experimentally estimated value of supported by theoretical considerations? In the Landau-Pekar strong coupling theory with a Gaussian trial wave function (see, for example, Ref. Mahan, 2000) the energy of the localized polaron is and , with the phononic length scale . Correspondingly, the polaron binding energy may be reexpressed in terms of the polaron radius: . If we assumed that holds and if we use the above relation between and , we would confirm exactly . Then, since , we would have for the 6 K data and correspondingly , and for the 295 K data with . Although this signals the intermediate coupling regime, with non-negligible further corrections to the polaron binding energy, the estimates seem to be in a reasonable range.
However, a serious objection is to be raised against this procedure: can be identified with only if the self-trapped state disappears together with the polarization well in the excitation process. This should not be the case in the considered approach in which we investigate excitations in the adiabatic limit and invoke the Franck-Condon principle. In this limit, we should take (see Emin’s review,Emin (1993) or the book by Alexandrov and Mott,Alexandrov and Mott (1995) chapter 1.1). With we find which does not fit the experimental data.com (g) Next order corrections to the Landau-Pekar limit do not alleviate this inconsistency.
Assessment of the strong coupling scenario. The resonance in the MIR optical conductivity can be well fitted with Emin’s phenomenological strong-coupling approach. Again, the fit is convincing up to frequencies slightly above the maximum whereas the high frequency slope decreases too fast, even faster than for the weak coupling scenario. The observed scaling is approximately reproduced, however with a value for the dimensionless radius which is inconsistent with a strong coupling estimate.
It is mandatory to ask if this phenomenological approach is trustworthy in terms of microscopic considerations. Alexandrov, Kabanov and RayAlexandrov et al. (1994) presented numerical results for the Holstein model with two and four sites and up to 50 excited phonons per mode. In fact, the shape of this microscopically calculated polaronic absorption resonance is, for intermediate coupling, similar to that of the phenomenological approach: a steep slope above the threshold and slower decrease at the high frequency side, comparable to the fit curve (Gaussian polaron) in Fig. 8. A direct confirmation of the phenomenological approach was attained for the one-dimensional model.Alexandrov et al. (1994) Hence we consider Emin’s approach to be reliable for the considered adiabatic limit.
Despite this positive assessment of the theoretical consistency of the approach we have to question its validity for the metallic manganites. The material (LSMO) is conducting and the effective mass of the charge carriers is supposed to be enhanced but not extremely strong. Consequently, a Fermi surface of the carriers should exist above the mobility edge, at least for low temperatures (we do not explore any details here; for a more comprehensive discussion see the review article by EdwardsEdwards (2002) and the literature cited there, especially Refs. Livesay et al., 1999, Pickett and Singh, 1997). This implies that if such Gaussian localized polarons exist they have to be excited across the mobility edge to the Fermi surface — not to a band minimum as assumed in the above polaron model.com (h)
The consequence now is that the phase space for the excitation of a trapped polaron into “free carrier states” at the hole Fermi surface is large, the density of states is finite, and one expects a step-like increase of the absorption. The experimental shape of the polaronic absorption is, however, not consistent with a (possibly smoothed) absorption-edge step.
Furthermore, one has to account for a mobile charge carrier density of the order of cm-3 to cm-3. This would push the mobility edgecom (i) to energies well below the Fermi edge with the consequence that the frequency of the absorption edge is certainly larger than the observed threshold — at least for the low temperature measurements. With this in mind one should dismiss the scenario that all the polarons which contribute to the absorption are self-trapped, that is, localized. They may have a large polaronic mass but they are mostly delocalized. However, Emin’s approach decisively depends on localized initial states.com (j) For a transition from a band state to another free-carrier state one again expects a sharp increase of the absorption.com (k) With these impediments it is unlikely that this intuitive approach can be applied directly to the observed polaronic absorption in the LSMO films.
IV.3.3 Fermi edge singularities
A generalization of the previous considerations (in Sec. IV.3.2) to a finite concentration of mobile carrier states is necessary but its implementation is subtle: In the adiabatic limit the localized potential well, formed by the lattice distortion, acts after the excitation of the charge carrier to the Fermi edge as a potential scatterer. Consequently, this limit represents the x-ray edge problem and the power law above the absorption threshold depends on the values of the scattering phase shifts.Nozières and Dominicis (1969) It may diverge (the Mahan exciton phenomenon is dominant) or converge (orthogonality catastrophe). Since we have to expect many decay channels for this excitation, the singular diverging edge might well be smoothed so as to reproduce the shape observed in the measurements. The decay at the high energy slope is governed by where is the phase shift in the angular momentum channel and is the sum over all phase shifts squared (see, for example, Ref. Mahan, 2000). The absorption process involves, according to the standard selection rules, power law behavior with both exponents, . However it is not evident, why should be so strongly temperature dependent as to reduce the exponent in the power law to the appropriate (-dependent) value. Nevertheless, might well increase with more scattering channels available when approaching a disordered paramagnetic state with increasing temperature.
Above, we argued that we do not expect the polarons, which participate in the absorption within the considered frequency window, to be localized. With finite polaron dispersion the situation changes qualitativelyGavoret et al. (1969); Ruckenstein and Schmitt-Rink (1987) because the recoil of the polaronic potential well has to be accounted for. The edge singularity will form a resonance around the frequency of the direct transitions from the filled valence band to the Fermi edge in the conduction band. This resonance (Mahan exciton) will flatten out when the ratio of the valence band mass to the conduction band mass increases. It is not clear how to identify the polarons with a valence band — or how to quantify a “valence band hole” as the appropriate potential well of the lattice distortion stripped of its charge carrier. In spite of that, the mechanism discussed by Gavoret, Nozières, Roulet and CombescotGavoret et al. (1969) and later on by Ruckenstein and Schmitt-RinkRuckenstein and Schmitt-Rink (1987) is still effective even if the large polarons may not be visualized as forming a valence band of quasi particles. It is the collective behavior associated with the response of the Fermi sea in the course of the excitation process that determines the optical spectrum. However, we have no information on the frequency difference of direct to indirect absorption and we have neither any information if the effective mass of the free carriers at the Fermi surface increases with respect to that of the delocalized polaronic potential well in order to produce the observed temperature dependence of the spectra. To summarize, in a scenario of adiabatic large polarons we have to expect these collective effects of the Fermi sea but it is speculative if they dominate the shape of the optical spectra in the considered frequency window. Furthermore, deviations from the adiabatic limit will contribute to a smoothing of the edge singularity.
V Conclusions
We have presented experimental results of the optical conductivity and dc-resistivity in thin films of LSMO and LCMO to analyze polaronic excitations. In both cases the polaron formation energy increases with temperature up to , while the spectral weight diminishes continuously.
Our data indicate different polaronic regimes in both compounds. For LCMO, the SP picture is well accepted, particularly with regard to the high temperature dc-resistivity. The optical conductivity displays an asymmetric Gaussian line shape close to the maximum of the polaronic resonance which also suggests incoherent tunnelling of small polarons. Overall, we conclude that for the Ca-doped compound the SP model with thermally activated transport is approximately valid for both, the ferromagnetic as well as the paramagnetic phase.
In contrast, for LSMO, ln(/T) deviates from a linear behavior and the optical conductivity has a strong asymmetric line shape with a steep slope at the low frequency side. This shape is typical for LP absorption processes.Mahan (2000); Emin (1993); Tempere and Devreese (2001) The phenomenological adiabatic LP model by EminEmin (1993) considers excitations of self-trapped charge carriers to an empty band of free-carrier states, with the polaronic potential-well intact in the adiabatic limit. Emin’s model reproduces the steep low frequency slope with a sufficiently wide maximum but cannot account for the slow decrease on the high frequency side. We challenge that this approach is applicable here because there is no hole-band minimum available to which the excited charge carriers could scatter. The energy difference from the mobility edge, below which the trapped polarons would reside, to the hole band minimum would have to be the threshold frequency. This frequency is (for 6 K) about cm-1, too small for the addressed energy difference. Consequently the modelling has to be modified as to implement LPs with finite mass and a finite density of charge carriers (Fermi edge).
In the weak coupling theory, the generalization of the single polaron absorption by GLFGurevich et al. (1962) to the situation of many-particle absorption was carried out by Tempere and Devreese.Tempere and Devreese (2001) The optical conductivity for a similar approach, which is rather based on the Hubbard model than on a Coulomb gas ansatz, is presented in Figs. 8, 9, and 10. The high frequency decay is now better realized through the excitation of particle-hole pairs of the Fermi sea. The scaling of the low-frequency slope (as observed in Fig. 4, upper panel) is implemented through the increase of the number of particle-hole pairs with increasing energy from the Fermi edge. On the other hand, this model cannot account for the shift of the threshold with temperature; the model threshold would always be the LO phonon frequency which is not supposed to shift from cm-1 for 6 K to cm-1 for 295 K.
The failure of weak coupling theory necessitates to extend these considerations to intermediate or strong coupling situations, first and foremost in the adiabatic limit. Such an evaluation is still not available and hardly feasible. As we discussed, it involves a collective response of the Fermi sea which leads to singularities in the optical conductivity, well known from the x-ray edge problem. The recoil of the polaronic lattice deformation, which is taken up in the excitation process of the charge carrier to the Fermi edge, will flatten the singularity and might be responsible for the observed shape. Although the proposed consequences for the shape of the absorption spectrum are speculative, the singular response is supposed to be present in any model with a sudden creation of a heavy or localized scatterer in the presence of a Fermi sea.
To summarize, the comparison between the measured optical conductivity spectra and the current theoretical models exhibits their inadequacy to explain the spectral weight at the high frequency slope of the polaronic MIR resonance and the strong shift of the resonance position with temperature. A theoretical solution of the polaron problem which may hold for any electron-phonon coupling, including correlation effects, is highly desirable. The physical quantities that control the temperature dependence for polaron formation, still remain to be elucidated.
Thin films proved to be superior for the analysis of the phononicHartinger et al. (2004b, c) and polaronic spectra in metallic manganites. We expect that further investigations based on thin film samples will provide considerable additional insight into the physics of the metallic state of the CMR manganites. We refer to an examination of the doping dependence of La1-xSrxMnO3, the polaronic spectra of which may address the built up of the Fermi surface. We also propose to explore the magnetic field dependence of the thin film spectra in order to address the role of magnetic correlations in the formation of polarons. Finally, La0.75(Ca0.45Sr0.55)0.25MnO3 undergoes an orthorhombic to rhombohedral transition with increasing temperatureKiryukhin et al. (2003) which would invite to examine a possible crossover from SP to LP behavior in the MIR optical conductivity.
Acknowledgements.
We acknowledge discussions with R. Hackl and H.-A. Krug von Nidda. X-ray measurements were performed at the Walther-Meissner-Institut (Garching). We thank A. Erb und P. Majewski for assisting the x-ray measurements. This research was supported by the BMBF (13N6917 and 13N6918) and by the Deutsche Forschungsgemeinschaft through SFB 484 (Augsburg).References
- von Helmolt et al. (1993) R. von Helmolt, J. Wecker, B. Holzapfel, L. Schultz, and K. Samwer, Phys. Rev. Lett. 71, 2331 (1993).
- Okimoto et al. (1997) Y. Okimoto, T. Katsufuji, T. Ishikawa, T. Arima, and Y. Tokura, Phys. Rev. B 55, 4206 (1997).
- Kaplan et al. (1996) S. G. Kaplan, M. Quijada, H. D. Drew, D. B. Tanner, G. C. Xiong, R. Ramesh, C. Kwon, and T. Venkatesan, Phys. Rev. Lett. 77, 2081 (1996).
- Millis et al. (1996) A. J. Millis, R. Mueller, and B. I. Shraiman, Phys. Rev. B 54, 5405 (1996).
- Zener (1951) C. Zener, Phys. Rev. 82, 403 (1951).
- Jung et al. (1998) J. H. Jung, K. H. Kim, T. W. Noh, E. J. Choi, and J. Yu, Phys. Rev. B 57, R11 043 (1998).
- Kim et al. (1998) K. H. Kim, J. H. Jung, and T. W. Noh, Phys. Rev. Lett. 81, 1517 (1998).
- Saitoh et al. (1999) E. Saitoh, Y. Okimoto, Y. Tomioka, T. Katsufuji, and Y. Tokura, Phys. Rev. B 60, 10 362 (1999).
- Lee et al. (1999) H. J. Lee, J. H. Jung, Y. S. Lee, J. S. Ahn, T. W. Noh, K. H. Kim, and S.-W. Cheong, Phys. Rev. B 60, 5251 (1999).
- Quijada et al. (1998) M. Quijada, J. Černe, J. R. Simpson, H. D. Drew, K. H. Ahn, A. J. Millis, R. Shreekala, R. Ramesh, M. Rajeswari, and T. Venkatesan, Phys. Rev. B 58, 16 093 (1998).
- Machida et al. (1998) A. Machida, Y. Moritomo, and A. Nakamura, Phys. Rev. B 58, R4281 (1998).
- Röder et al. (1996) H. Röder, J. Zang, and A. R. Bishop, Phys. Rev. Lett. 76, 1356 (1996).
- Lee and Min (1997) J. D. Lee and B. I. Min, Phys. Rev. B 55, 12 454 (1997).
- Alexandrov and Bratkovsky (1999) A. S. Alexandrov and A. M. Bratkovsky, Phys. Rev. B 60, 6215 (1999).
- Rubinstein (1999) M. Rubinstein, Phys. Rev. B 60, 1627 (1999).
- Gurevich et al. (1962) V. Gurevich, I. Lang, and Y. Firsov, Sov. Phys. Solid State 4, 918 (1962).
- Goovaerts et al. (1973) M. J. Goovaerts, J. M. De Sitter, and J. T. Devreese, Phys. Rev. B 7, 2639 (1973).
- Reik and Heese (1967) H. G. Reik and D. Heese, J. Phys. Chem. Solids 28, 581 (1967).
- Emin (1975) D. Emin, Adv. Phys. 24, 305 (1975).
- Zhao et al. (2000) G. M. Zhao, Y. S. Wang, D. J. Kang, W. Prellier, M. Rajeswari, H. Keller, T. Venkatesan, C. W. Chu, and R. L. Greene, Phys. Rev. B 62, R11949 (2000).
- Emin (1993) D. Emin, Phys. Rev. B 48, 13 691 (1993).
- Tempere and Devreese (2001) J. Tempere and J. T. Devreese, Phys. Rev. B 64, 104504 (2001).
- Hartinger et al. (2004a) Ch. Hartinger, F. Mayr, J. Deisenhofer, A. Loidl, and T. Kopp, Phys. Rev. B 69, 100403(R) (2004).
- Snyder et al. (1996) G. J. Snyder, R. Hiskes, S. DiCarolis, M. R. Beasley, and T. H. Geballe, Phys. Rev. B 53, 14434 (1996).
- Hartinger et al. (2004b) Ch. Hartinger, F. Mayr, A. Loidl, and T. Kopp, Phys. Rev. B 71, 184421 (2005).
- Hartinger et al. (2004c) Ch. Hartinger, F. Mayr, A. Loidl, and T. Kopp, Phys. Rev. B 70, 134415 (2004).
- Takenaka et al. (1999) K. Takenaka, K. Iida, Y. Sawaki, S. Sugai, Y. Moritomo, and A. Nakamura, J. Phys. Soc. Jpn. 68, 1828 (1999).
- Biswas et al. (2001) A. Biswas, M. Rajeswari, R. C. Srivastava, T. Venkatesan, R. L. Greene, Q. Lu, A. L. de Lozanne, and A. J. Millis, Phys. Rev. B 63, 184424 (2001).
- Walter et al. (2000) T. Walter, K. Dörr, K.-H. Müller, D. Eckert, K. Nenkov, M. Hecker, M. Lehmann and L. Schultz, J. Magn. Magn. Mater 222, 175 (2000).
- Christey and Hubler (1994) D. Christey and G. Hubler, Pulsed Laser Deposition of Thin Films (Wiley, New York, 1994).
- Kozlov and Volkov (1998) G. V. Kozlov and A. A. Volkov, Millimeter and Submillimeter Wave Spectroscopy of Solids (Springer, Berlin, 1998).
- Heavens (1991) O. S. Heavens, Optical Properties of Thin Solid Films (Dover Publications Inc., New York, 1991).
- Reichardt and Braden (1999) W. Reichardt and M. Braden, Physica B 263, 416 (1999).
- com (a) The LSMO sample of reference Hartinger et al., 2004a is not identical to the LSMO sample presented in this paper. For this reason the transition temperatures slightly differ. However the optical spectra are so similar that our analysis applies to both samples without reservation.
- Emin and Holstein (1969) D. Emin and T. Holstein, Ann. Phys. (N. Y.) 53, 439 (1969).
- Worledge et al. (1996) D. C. Worledge, G. J. Snyder, M. R. Beasley, T. H. Geballe, R. Hiskes, and S. DiCarolis, J. Appl. Phys. 80, 5158 (1996).
- Jaime et al. (1996) M. Jaime, M. B. Salamon, M. Rubinstein, R. E. Treece, J. S. Horwitz, and D. B. Chrisey, Phys. Rev. B 54, 11 914 (1996).
- Bi and Eklund (1993) X.-X. Bi and P. C. Eklund, Phys. Rev. Lett. 70, 2625 (1993).
- Reik (1972) H. G. Reik, in Polarons in Ionic Crystals and Polar Semiconductors, edited by J. Devreese (North Holland, Amsterdam, 1972).
- Austin and Mott (1969) I. J. Austin and N. F. Mott, Adv. Phys. 18, 41 (1969).
- Hohenadler and Edwards (2002) M. Hohenadler and D. M. Edwards, J. Phys.: Condens. Matter 14, 2547 (2002).
- Dai et al. (2000) P. Dai, J. A. Fernandez-Baca, N. Wakabayashi, E. W. Plummer, Y. Tomioka, and Y. Tokura, Phys. Rev. Lett. 85, 2553 (2000).
- Nelson et al. (2001) C. S. Nelson, M. v. Zimmermann, Y. J. Kim, J. P. Hill, D. Gibbs, V. Kiryukhin, T. Y. Koo, S.-W. Cheong, D. Casa, B. Keimer, Y. Tomioka, Y. Tokura, T. Gog, and C. T. Venkataraman, Phys. Rev. B 64, 174405 (2001).
- Dagotto (2005) E. Dagotto, (2003), cond-mat/0302550.
- Alvarez et al. (2002) G. Alvarez, M. Mayr and E. Dagotto, Phys. Rev. Lett. 89, 277202 (2002).
- Kiryukhin et al. (2003) V. Kiryukhin, T. Y. Koo, H. Ishibashi, J. P. Hill and S. W. Cheong, Phys. Rev. B 67, 64421 (2003).
- Lyanda-Geller et al. (2001) Y. Lyanda-Geller, S. H. Chun, M. B. Salamon, P. M. Goldbart, P. D. Han, Y. Tomioka, A. Asamitsu, and Y. Tokura, Phys. Rev. B 63, 184426 (2001).
- Mannella et al. (2004) N. Mannella, A. Rosenhahn, C. H. Booth, S. Marchesini, B. S. Mun, S.-H. Yang, K. Ibrahim, Y. Tomioka, and C. S. Fadley, Phys. Rev. Lett. 92, 166401 (2004).
- Mannella et al. (2005) N. Mannella, A. Rosenhahn, M. Watanabe, B. Sell, A. Nambu, S. Ritchey, E. Arenholz, A. Young, Y. Tomioka, and C. S. Fadley, Phys. Rev. B 71, 125117 (2005).
- Jakob et al. (1998) G. Jakob, F. Martin, W. Westerburg, and H. Adrian, Phys. Rev. B 57, 10252 (1998).
- Mandal et al. (1998) P. Mandal, K. Bärner, L. Haupt, A. Poddar, R. von Helmolt, A. G. M. Jansen, and P. Wyder, Phys. Rev. B 57, 10256 (1998).
- Asamitsu and Tokura (1998) A. Asamitsu and Y. Tokura, Phys. Rev. B 58, 47 (1998).
- Wang et al. (2001) L. M. Wang, H. C. Yang, and H. E. Horng, Phys. Rev. B 64, 224423 (2001).
- Louca and Egami (1999) D. Louca and T. Egami, Phys. Rev. B 59, 6193 (1999).
- Shibata et al. (2003) T. Shibata, B. A. Bunker, and J. F. Mitchell, Phys. Rev. B 68, 24103 (2003).
- Anderson and Hasegawa (1955) P. W. Anderson and H. Hasegawa, Phys. Rev. 100, 675 (1955).
- Millis et al. (1995) A. J. Millis, P. B. Littlewood, and B. I. Shraiman, Phys. Rev. Lett. 74, 5144 (1995).
- Dagotto et al. (2001) E. Dagotto, T. Hotta, and A. Moreo, Phys. Rep. 344, 1 (2001).
- com (b) The coherent motion from quantum tunneling with a fixed number of phonons generates a polaron band with bandwidth that decreases exponentially with temperature — for temperature larger than the Debye scale. We do not attempt to identify this polaron band with the low-frequency absorption upturn. Certainly, other mechanisms have to be incorporated to fully deal with the low-energy IR-absorption (see, for example, Refs. Ishihara et al., 1997; Mack and Horsch, 1999).
- Mahan (2000) G. D. Mahan, Many-Particle Physics (Kluwer Academic/Plenum Publishers, New York, 2000), 3rd ed.
- Edwards (2002) D. M. Edwards, Adv. Phys. 51, 1259 (2002).
- Puchkov et al. (1995) A. V. Puchkov, T. Timusk, M. A. Karlow, S. L. Cooper, P. D. Han, and D. A. Payne, Phys. Rev. B 52, R9855 (1995).
- Yoon et al. (1998) S. Yoon, H. L. Liu, G. Schollerer, S. L. Cooper, P. D. Han, D. A. Payne, S.-W. Cheong, and Z. Fisk, Phys. Rev. B 58, 2795 (1998).
- Kudinov et al. (1970) E. K. Kudinov, D. N. Mirlin, and Y. A. Firsov, Sov. Phys. Solid State 11, 2257 (1970).
- Fratini (2001) S. Fratini, F. de Pasquale and S. Ciuchi, Phys. Rev. B 63, 153101 (2001).
- Okimoto et al. (1995) Y. Okimoto, T. Katsufuji, T. Ishikawa, A. Urushibara, T. Arima, and Y. Tokura, Phys. Rev. Lett. 75, 109 (1995).
- com (l) A discussion and the relevant literature on this CPA-approach is presented in Ref. Edwards, 2002.
- Perroni et al. (2001) C. A. Perroni, G. DeFilippis, V. Cataudella, and G. Iadonisi, Phys. Rev. B 64, 144302 (2001).
- com (m) Perroni et al. suggest that their low temperature results support large polarons in the ferromagnetic phase. However a threshold-like behavior of the respective optical conductivity, as discussed in detail in our previous section, is entirely missing in their approach. We would rather interpret their results as the low temperature regime of the small polaron theory, with dominantly coherent motion through polaron tunneling.
- com (n) Ishihara et al.Ishihara et al. (1997) and Mack and HorschMack and Horsch (1999) have presented an alternative interpretation of the low-energy peak in terms of correlation effects from orbital degrees of freedom.
- Calvani (2001) P. Calvani, Optical properties of polarons (La Rivista del Nuovo Cimento, Bologna, 2001).
- com (c) For fermions with two flavors, for example two spin directions or two orbitals, the structure factor approaches in the low-density limit .
- Lindhard (1954) J. Lindhard, Kgl. Danske Videnskab. Selskab, Mat.-Fys. Medd. 28, 8 (1954).
- Salamon and Jaime (2001) M. B. Salamon and M. Jaime, Rev. Mod. Phys. 73, 583 (2001).
- com (d) In the Fröhlich Hamiltonian, the electron-phonon coupling is . With J, , and , we would find . A value of 3 to 4 for is consistent with the literature.
- com (e) The weak coupling limit, for which neither shape nor weight change noticeable, is approached for .
- com (f) Actually is sufficient.
- Kartheuser et al. (1969) E. Kartheuser, R. Evrard, and J. Devreese, Phys. Rev. Lett. 22, 94 (1969).
- Mitra et al. (1987) T. K. Mitra, A. Chatterjee, and S. Mukhopadhyay, Phys. Rep. 153, 91 (1987).
- Alexandrov and Mott (1995) A. S. Alexandrov and N. Mott, Polarons & Bipolarons (World Scientific, Singapore, 1995).
- com (g) A similar discussion holds for the hydrogenic ground state of the polaron with , except that the parameter values differ. For example, which implies for that case, assuming that holds (it is for ). The analytical form of the optical absorption is found in Emin’s review. The high frequency decrease is slightly slower in the frequency range of sizable absorption but it does not improve the fit to the experimental data.
- Alexandrov et al. (1994) A. S. Alexandrov, V. V. Kabanov, and D. K. Ray, Physica C 224, 247 (1994).
- Livesay et al. (1999) E. A. Livesay, R. N. West, S. B. Dugdale, G. Santi, and T. Jarlborg, J. Phys.: Condens. Matter 11, L279 (1999).
- Pickett and Singh (1997) W. E. Pickett and D. J. Singh, Phys. Rev. B 55, R8642 (1997).
- com (h) It would be unrealistic to assume that the bound polarons are particles from the electron spheroids and that they are excited back to the empty electron band centered at the point, a situation which would be compatible with the above approach. To account for the large spectral weight one rather has to suppose that it is the hole carriers which form the (trapped) polarons and which are excited to the Fermi surface of the hole cuboids (at the points — other empty hole bands are not sufficiently low in energy). The hole nature of the polaronic charge carriers also agrees with the standard microscopic considerations.
- com (i) Assuming that a mobility edge exists for a many-polaron system — there is no strict proof yet.
- com (j) The localized state can take up any momentum from the excitation.
- com (k) The theory with final state interactions for Wannier excitons predicts a step-like increase when the excited bound states are disregarded; see Ref. Mahan, 2000, section 9.2.
- Nozières and Dominicis (1969) P. Nozières and C. T. Dominicis, Phys. Rev. 178, 1097 (1969).
- Gavoret et al. (1969) J. Gavoret, P. Nozières, B. Roulet, and M. Combescot, J. Phys. (Paris) 30, 987 (1969).
- Ruckenstein and Schmitt-Rink (1987) A. E. Ruckenstein and S. Schmitt-Rink, Phys. Rev. B 35, 7551 (1987).
- Ishihara et al. (1997) S. Ishihara, M. Yamanaka, and N. Nagaosa, Phys. Rev. B 56, 686 (1997).
- Mack and Horsch (1999) F. Mack and P. Horsch, in Physics of Manganites, edited by T. A. Kaplan and S. D. Mahanti (Kluwer Academic/Plenum Publishers, New York, 1999).