Vortex nanoliquid in high-temperature superconductors
Abstract
Using a differential magneto-optical technique to visualize flow of transport currents, we reveal a new delocalization line within the reversible vortex liquid region in the presence of a low density of columnar defects. This line separates a homogeneous vortex liquid, in which all the vortices are delocalized, from a heterogeneous “nanoliquid” phase, in which interconnected nanodroplets of vortex liquid are caged in the pores of a solid skeleton formed by vortices pinned on columnar defects. The nanoliquid phase displays high correlation along the columnar defects but no transverse critical current.
pacs:
PACS numbers: 74.25.Qt, 74.25.Op, 74.25.Sv, 74.72.HsColumnar defects (CDs) created in high-temperature superconductors by high-energy heavy ion irradiation act as very efficient pinning centers for vortices aligned along the CDs. The effects of this correlated disorder on the vortex properties have been investigated extensively mainly in the limit of relatively high density of CDs where the enhancement in the critical current for practical applications is most significant and the vortex matter is known to form the Bose glass phase [1, 2, 3, 4]. In contrast, our understanding of the opposite limit, in which sparse CDs perturb a higher concentration of vortices, is still incomplete. Recent experimental studies [5, 6] have shown that in this case the vortex matter can no longer be regarded as a homogeneously pinned medium. Instead, an intrinsically heterogeneous structure with two distinct sub-systems of vortices with very different characteristic energies is formed: vortices residing on CDs are strongly pinned and create a rigid skeleton, while the interstitial vortices form relatively ordered nanocrystals intercalated within the voids of this porous skeleton. This experimental finding of a “porous” vortex solid has contributed to a series of recent theoretical studies and numerical simulations [7, 8, 9, 10, 11, 12]. Moreover, it was found that the melting line of the “porous” vortex solid has an unconventional behavior showing a pronounced kink [5, 6]. This has led to the suggestion of the possible existence of two different liquid phases: at fields below the kink a usual homogeneous vortex liquid is formed upon melting, whereas at fields above the kink the “porous” solid melts into a heterogeneous state in which liquid vortices coexist with a skeleton of pinned vortices. It was proposed that in such a case a new transition line separating these two liquid phases should be expected [5, 3, 10]. Using a new imaging technique we present here the first experimental evidence for such a transition line within the reversible vortex liquid phase that separates a heterogeneous “nanoliquid” from a homogeneous liquid. One of the interesting properties of this novel nanoliquid phase is the absence of in-plane dissipationless superconductivity, while the coherence along the c-axis is apparently still preserved.
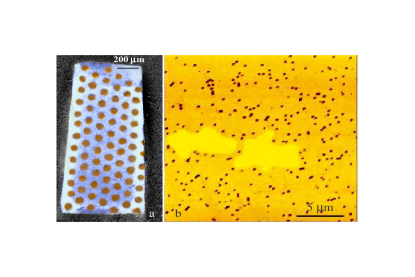
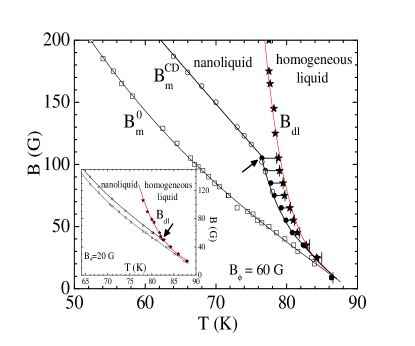
The CDs were created along the c-axis in Bi2Sr2CaCu2O8 (BSCCO) single crystals ( K) using low irradiation doses of 1 GeV Pb ions at GANIL, France. The samples were covered with 50 m thick stainless steel mask with a triangular array of 90 m apertures. The mask blocks the ions and as a result CDs are formed in the BSCCO crystals only within the 90 m apertures. Figure 1a shows the melting process in one of the BSCCO crystals of about mm3 visualized by differential magneto-optical imaging (DMO) for magnetic fields H c-axis. The first-order melting transition (FOT) is detected by observing a step in the equilibrium local magnetization [13, 14, 15], which appears as bright paramagnetic regions in the DMO images [5, 16]. For clarity, the liquid and solid regions are colored in blue and brown respectively. In Fig. 1a all the pristine regions of the sample have melted already (blue) while the 90 m irradiated regions are still solid (brown). Figure 2 shows the phase diagram with the corresponding melting lines in the pristine, , and in the irradiated, , regions with G (, n is the areal density of CDs, and is the flux quantum). The use of the irradiation mask allows accurate determination of the difference in the melting temperature in adjacent irradiated and pristine regions in the same sample. Figure 2 shows that the irradiated regions melt at substantially higher temperatures while strikingly preserving the first-order nature of the transition [5]. With decreasing temperature along the line the strength of the FOT in the irradiated regions diminishes, becoming weakly first-order and eventually turning into a second order transition at a temperature that is irradiation dose and sample dependent [5, 17]. The open circles in Fig. 2 were obtained using field modulation DMO while the solid circles using temperature modulation.
We now focus our attention only on the irradiated regions which are macroscopic on the scale of the intervortex distance. Figure 1b shows an AFM image of an etched mica irradiated along with the crystals, which reveals the typical random distribution of CDs following Poisson statistics. The CDs form a dense network or matrix that contains numerous voids that are free of columns. Two such voids, or pores, are outlined schematically by the light color in Fig. 1b. The CDs act as strong pinning centers for the vortices and therefore at low all the vortices reside on CDs. When the field approaches the matching field most of the CDs become occupied by vortices. This network of pinned vortices forms a rigid skeleton, while upon further increase of , the extra vortices create ordered nanocrystals within the pores of the skeleton, as revealed by magnetic decoration studies [6].
We now investigate the nature of the resulting liquid phase and search for a possible new transition between two different liquid phases. Since our DMO measurements do not show any FOT equilibrium magnetization steps within the liquid region of the phase diagram, we have developed a new differential imaging technique to search for a possible liquid-liquid transition. Instead of modulating the applied field or temperature, a transport current with periodically alternating polarity is applied to the sample and a corresponding differential image is acquired and integrated, typically over a hundred cycles. As a result, the self-induced magnetic field generated by the transport current according to the Biot-Savart law can be measured to a very high precision. With this differential imaging we are able to determine the distribution of currents as low as 0.1 mA, about three orders of magnitude improvement compared to previous methods [18].
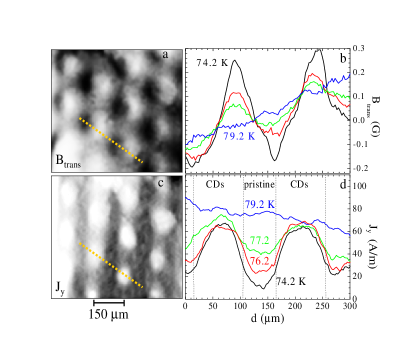
Figure 3a shows in the central part of the sample resulting from 50 mA transport current. This image displays the behavior at K and G, which is above the line. Here the entire sample is in the liquid phase and no field variation between the irradiated and pristine regions is observed by DMO using either field or temperature modulations. Surprisingly, despite the fact that both the irradiated and pristine regions are liquid, strong variations in are found in Fig. 3b, revealing a highly inhomogeneous distribution of transport current that reflects large differences in the vortex dynamics. Such an ability to resolve spatial variations of vortex dynamics within the liquid phase is a unique feature of this new differential technique. Using the matrix inversion [19, 20] of , a direct measure of the spatial distribution of the transport current is obtained as shown in Figs. 3c and 3d. The current is strongly focused into the irradiated regions reaching densities up to seven times higher than in the unirradiated regions. This means that at this temperature the vortex liquid phase in the irradiated regions is different from the pristine homogeneous liquid; it has a much lower resistivity and the vortices experience a much higher effective viscosity. Figures 3b and 3d also show the evolutions of and with increasing temperature. At K the current distribution becomes uniform quite abruptly and remains uniform at higher temperatures, showing that above the two liquids become identical. As discussed below, is thus the delocalization temperature separating a nanoliquid phase, in which interconnected liquid droplets are caged by a solid skeleton, from a homogeneous liquid. Figure 2 shows the location of this delocalization line on the phase diagram, which is our central result here.
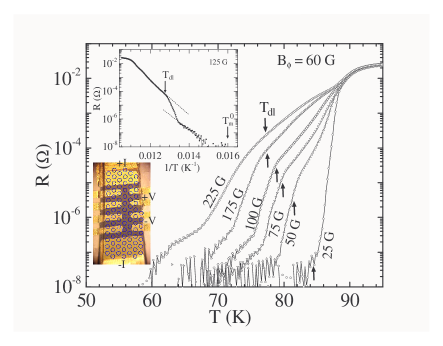
We have also performed transport measurements simultaneously with the DMO imaging. Figure 4 shows the measured four probe resistance of the sample as a function of temperature at various fields. The arrows indicate the as derived from the DMO self-field measurements. The resistance in the liquid phase of BSCCO has Arrhenius behavior[21, 22] as seen in the inset of Fig. 4. We observe that in the homogenous liquid region, decreases smoothly with decreasing temperature until is reached. Below a nanoliquid is formed in the irradiated regions, significantly reducing . In our special geometry, however, the volume of the irradiated regions (brown regions in Fig. 1a) is less than half of the total volume of the sample. Therefore we should expect that, even if the resistance of the irradiated regions should become zero, the total measured of the sample should drop approximately only by a factor of two, since the pristine regions remain liquid (blue in Fig. 1a) and maintain highly resistive Arrhenius behavior. Such a drop between two parallel Arrhenius lines is indeed observed and is emphasized by the dotted lines in the inset of Fig. 4. However, the striking observation is that the drop is by factor of more than . This behavior shows that the localization of the skeleton of vortices on the CDs significantly enhances the c-axis correlation as follows: Because of the high anisotropy of BSCCO the applied current flows in a very shallow layer underneath the top surface of the crystal where the electrical contacts are attached[23, 24, 25] (see Fig. 4 lower inset). The characteristic depth of the current is inversely proportional to the effective anisotropy , where and are the c-axis and in-plane resistivities. In BSCCO and may change considerably depending on oxygen doping and temperature. is determined by the degree of relative fluctuations and misalignment between the vortex pancakes in the adjacent CuO2 planes. The formation of the rigid skeleton aligns the pancake stacks residing on the CDs and also reduces the fluctuations of the vortices residing in the voids. As a result the c-axis correlation and the Josephson coupling between the pancakes in the nanoliquid phase should be significantly enhanced, giving rise to a large reduction in and anisotropy as compared to the homogeneous liquid. Consequently, the nanoliquid in the irradiated regions allows the current to penetrate much deeper into the crystal, thereby significantly increasing the effective thickness of the sample and reducing . Since drops by a factor of more than twenty, instead of a factor of two, we conclude that the nanoliquid is at least an order of magnitude more isotropic than the homogenous liquid.
We now discuss the phase boundaries in Fig. 2 from the symmetry breaking standpoint. There are two symmetries that are broken upon freezing into the vortex solid phase[1]: the formation of the Abrikosov lattice within the nanocrystals locally breaks the continuous translational symmetry of the liquid, and the appearance of the supercarrier density and the resulting ability to sustain dissipationless currents along the vortices breaks the longitudinal gauge symmetry. At the nanocrystals melt into nanodroplets, restoring the local transverse translational symmetry. The rigid skeleton, however, remains intact due to the strong pinning by the CDs, thus preserving the longitudinal c-axis correlation along the CDs up to the line. The resulting nanoliquid phase, consisting of interconnected nanodroplets caged in a porous skeleton, has a unique property of extended c-axis coherence together with the absence of in-plane critical current.
Several recent theoretical studies and numerical simulations[7, 10, 11] indeed find evidence for superconducting coherence along the c-axis in such an intermediate liquid phase. More specifically, using the analogy between vortices and two-dimensional bosons[1, 2], an intermediate superfluid state in which the superfluid condensate of bosons (vortex liquid) coexists with localized bosons (vortices pinned on CDs) has been predicted[10]. With increasing the intermediate vortex liquid system (nanoliquid) undergoes a sharp delocalization at above which all the vortices become delocalized (homogeneous liquid), thereby rendering the system incapable of sustaining any supercurrents along the vortices. This results in exp, where describes the effective depinning energy scale for vortex delocalization [10], estimated to be K for typical parameters of BSCCO. The red lines in Fig. 2 are fits to the data resulting in K for the G sample and K for the G crystal (inset) which had a slightly higher . We have also studied a crystal with G (not shown) giving K. In all three cases the theoretical temperature dependence provides a very good description of the experimental line. Note, however, that the theory does not take into account the discreteness associated with the pancake vortices in BSCCO. An alternative estimate, based on the Berezinskii-Kosterlitz-Thouless like scenario of delocalization of two-dimensional pancake vortices [4], also yields an exponential dependence of with proper parameters. Thus, we surmise that the localization of vortices on the porous skeleton depresses the c-axis resistivity and breaks the longitudinal gauge symmetry in the nanoliquid, which is restored only above the line. It is commonly believed that the formation of the solid vortex lattice causes simultaneous breaking of the two symmetries across the FOT. Our findings here show the first phase diagram identifying two separate phase boundaries and across which the two symmetries of the vortex matter are apparently broken separately. This unique property is the result of the heterogeneous nature of the vortex nanoliquid.
It is interesting to note that at fields below the kink (marked by arrows in Fig. 2) the two symmetries are apparently broken simultaneously, where the line closely follows the delocalization line . At these fields the nanocrystals contain just a few vortices which remain solid as long as the caging skeleton exists. The delocalization of the skeleton at thus causes instantaneous melting of the entire lattice. This is a novel kind of vortex lattice melting in which delocalization [4, 10] of one sub-system of vortices induces a FOT in the entire heterogeneous system. Note that the finite distribution of the nanocrystal sizes results in broadening of the FOT, as indicated by the error bars in Fig. 2. The FOT apparently commences upon melting of the regions with larger crystallites while the global homogeneous liquid is established only upon melting of the smallest of the crystallites. Interestingly, this broadening is hardly resolvable for lower irradiation doses, as seen in the inset of Fig. 2.
In conclusion, a low density of CDs is shown to significantly perturb the vortex liquid resulting in formation of an intermediate nanoliquid phase in which liquid vortex droplets are caged by vortices localized on CDs. We find evidence for a new delocalization line at which the nanoliquid transforms into a homogeneous vortex liquid forming a “Y” shaped phase diagram. The nanoliquid phase has unique properties resembling the long sought disentangled vortex liquid [26] with high c-axis correlation but zero transverse critical current. We conjecture that the nanoliquid phase with coexisting localized and delocalized particles may be generic to strongly interacting systems in the presence of disorder.
We thank M. Menghini, Y. Fasano, E. H. Brandt, and V. Geshkenbein for stimulating discussions and R. J. Wijngaarden for providing the matrix inversion algorithm. This work was supported by the Israel Science Foundation Center of Excellence, by the German-Israeli Foundation G.I.F., and by the Minerva Foundation, Germany. The work of FdlC was partially supported by Fundacion Antorchas and by ANPCYT PICT99-5117, and of VV by the U.S. Department of Energy, Office of Science. TT acknowledges the support of the Grant-in-Aid for Scientific Research from the Ministry of Education, Culture, Sports, Science, and Technology, Japan. EZ acknowledges the support by the US-Israel Binational Science Foundation (BSF) and by the Wolfson Foundation.
REFERENCES
- [1] G. Blatter et al., Rev. Mod. Phys. 66, 1125 (1994).
- [2] D.R. Nelson and V.M. Vinokur, Phys Rev. Lett. 68, 2398 (1992).
- [3] L. Radzihovsky, Phys. Rev. Lett. 74, 4923 (1995).
- [4] C. J. Van der Beek et al., Phys. Rev. Lett. 86, 5136 (2001).
- [5] S. S. Banerjee et al., Phys. Rev. Lett. 90, 087004 (2003).
- [6] M. Menghini et al., Phys. Rev. Lett. 90, 147001 (2003).
- [7] Y. Nonomura and X. Hu, cond-mat/0212609.
- [8] C. Dasgupta and O.T. Valls, Phys. Rev. Lett. 91,127002 (2003).
- [9] S. Tyagi and Y. Goldschmidt, Phys. Rev. B 67, 214501 (2003).
- [10] A.V. Lopatin and V.M. Vinokur, Phys. Rev. Lett. 92, 067008 (2004).
- [11] J.P. Rodriguez, cond-mat/0312652.
- [12] A. Morozov, B. Horovitz, and P. Le Doussal, Phys. Rev. B 67, 140505 (2003).
- [13] H. Pastoriza, M. F. Goffman, A. Arribere, and F. de la Cruz, Phys. Rev. Lett. 72, 2951 (1994).
- [14] E. Zeldov et al., Nature 375, 373 (1995).
- [15] A. Schilling et al., Nature 382, 791 (1996).
- [16] A. Soibel et al., Nature 406, 282 (2000); A. Soibel et al., Phys. Rev. Lett. 87, 167001 (2001); M. Yasugaki et al., Phys. Rev. B 65, 212502 (2002).
- [17] B. Khaykovich et al., Phys. Rev. B 57, R14088 (1998).
- [18] M.V. Indenbom et al., Journal of Alloys and Compounds 195, 499 (1993); U. Welp et al., Nature 376, 44 (1995); D. Larbalestier et al., Nature 414, 368 (2001).
- [19] R.J. Wijngaarden et al., Phys. Rev. B 54, 6742 (1996); R.J. Wijngaarden et al., Physica C 295, 177 (1998).
- [20] E.H. Brandt, Phys. Rev. B 46, 8628 (1992).
- [21] T.T.M. Palstra et al., Phys. Rev. Lett. 61, 1662 (1988).
- [22] D.T. Fuchs et al., Phys. Rev. Lett. 81, 3944 (1998).
- [23] R. Busch et al., Phys. Rev. Lett. 69, 522 (1992).
- [24] H. Safar et al., Phys. Rev. B 46, 14238 (1992).
- [25] B. Khaykovich et al., Phys. Rev. B 61, R9261 (2000).
- [26] M.V. Feigel’man et al., Phys. Rev. B 48, 16641 (1993).