Further author information: (Send correspondence to d.heiman@neu.edu)
Optical Spectroscopy of the Hole Spin in GaMnAs Acceptors
Abstract
The spin state of holes bound to Mn acceptors in GaMnAs is investigated by optical spectroscopy. Concentrations of Mn from 1017 to 1019 cm-3 were studied as a function of magnetic field and temperature. The photoluminescence from recombination of electrons with holes bound in the Mn-acceptor complex (MAC) displays multiple spectral peaks. The circular polarization of these peaks increases with increasing magnetic field and saturates at 1/3. This value of polarization is expected from modeling the addition of spin angular momentum and interband optical transition matrix elements.
keywords:
spintronics, dilute magnetic semiconductors, magnetic acceptors, Kerr rotation1 INTRODUCTION
Although conventional electronics rely on the transport and storage of electron charge, new devices for information technology are expected to rely on the transport and storage of electron spin. The emerging field of ”spintronics” could spawn devices such as spin transistors or spin valves [1], spin memory devices,[2] and even quantum spin computers [3, 4]. Of particular interest are new materials which have magnetic properties as well as semiconducting properties. Electronic devices based on GaAs are becoming increasingly useful in high speed electronics, most notably in the area of wireless communication where frequencies are above a GHz. GaAs doped with 5% Mn is ferromagnetic with a Curie temperature in excess of 100 K. [5, 6] This III-V based magnetic semiconductor is grown by low-temperature molecular beam epitaxy (MBE). The ferromagnetism is generated by a high concentration of holes which are contributed by Mn acceptors. Theories of ferromagnetism in this material have been based on RKKY [7, 8] or double exchange [9] mechanisms. The emergence of ferromagnetic GaMnAs has spawned renewed interest in magnetic semiconductors.
At the heart of the ferromagnetism in GaMnAs is the Mn acceptor and the interaction between the spins of acceptor-contributed holes and spins of Mn2+ ions. Table 1 lists the Mn states in GaAs and GaP semiconductors. At low concentrations the neutral acceptor (A0) exists — substitution of Mn2+ for Ga3+ generates a negatively-charged Mn2+ core which binds a valence band hole. At high Mn concentrations the (A0) is not observed since the bound-hole wavefunctions overlap and become unbound.[10] The ionized acceptor (A-) is found in GaAs samples at both low and high Mn concentrations.
| Impurity | Ion | Configuration | Material | Ref. |
|---|---|---|---|---|
| A0 | Mn2+ | (+)+ | GaAs bulk | [11, 10] |
| A- | Mn2+ | (+) | GaAs bulk | [11, 10] |
| ” | ” | ” | GaAs epilayer | [10] |
| – | Mn3+ | GaP | [12] |
1.1 Magnetic Binding Energy of Acceptor
The hole bound to Mn has a large binding energy (113 meV),[13, 14] several times larger than for an effective mass acceptor such as carbon (26 meV). The larger binding is attributed to so-called ”central cell” potential. The central cell binding is mainly from additional chemical binding. However, there is also magnetic binding of the hole to the Mn due to the p-d exchange interaction, amounting to 26 meV.[15] The 4-times larger ground state binding energy is correlated with a smaller effective Bohr radius for the hole bound to the Mn ion.[15] In a simple hydrogenic model, the Bohr radius for AEM is aEM=22 Å, as obtained from a=(0.53 Å) /mh, using the dielectric constant =12.6, and mh=0.3 from E=(13,600 meV)mh/2. For AMn, the characteristic radius of the wavefunction for lightly doped bulk-grown material is expected to be only aMn=10 Å, obtained from the metal-nonmetal transition at a hole concentration of pc 21019 cm-3 and the Mott criteria ap=0.25.[16] However, in MBE grown Ga1-xMnxAs [17] a metal-insulator transition appears at x=0.03,[18] corresponding to a much higher hole concentration, p1020 cm-3 (No=2.2 cm-3), assuming one hole per Mn ion. This would give a Mott radius of only 3 Å, even smaller than the 4.0 Å nearest-neighbor Mn-Mn cation spacing.
1.2 Magnetic Acceptor Complex
The magnetic acceptor complex (MAC) is composed of the j=3/2 hole and S=5/2 Mn2+ (3d5) ion.[19] The spin configuration of the MAC is dominated by the p-d exchange coupling. In the present work, magneto-optical experiments are used to probe the spin configuration of the magnetic acceptor complex in lightly doped GaAs:Mn. A magnetic field is applied in order to align the total spin of the MAC (J=j+S). The spin configuration is measured via the polarization of the recombination radiation as the bound hole recombines with photoexcited electrons. Both circular polarization in a Faraday configuration and linear polarization in a Voigt configuration are studied. Analysis of the polarization as a function of magnetic field and temperature is used to obtain the spin configuration of the MAC. These results are compared to modeling which takes into account the angular momentum coupling as well as transition matrix elements of the recombination.
1.3 Acceptor Exchange Energy
The p-d exchange interaction between hole spins and Mn-ion spins has an energy of N0 2 eV. [20] The minus sign reflects the antiferromagnetic exchange between the spin vectors. Table 2 lists values for N0 obtained by various methods. Values range from N0= 1.2 to 3.3 eV. The optical methods rely on combining observed splitting of optical transitions with magnetization data.[21, 22] The major source of error is normally due to the uncertainty in measuring the optical splitting. In GaMnAs the splitting is much smaller than the broadening of the transitions, making it difficult to accurately measure the splitting. [20] Magnetotransport measurements rely on fitting the magnetic field dependence of resistivity to a model of electronic scattering which contains the hole effective mass and carrier concentration. [23, 24] There, the major source of error is due to the uncertainty in the assumed hole effective mass (m/mo=0.3-0.5) and the hole concentration. Hole concentrations can be obtained from Hall effect measurements, but complications arise in GaMnAs from additional contributions to the Hall resistance due to the extraordinary Hall effect and negative magnetoresistance. These effects become negligible at low temperatures (T=50 mK) and high magnetic fields (B20 T).[24] However, it is not clear whether the resistivity accurately samples the entire population of holes which generate the ferromagnetism.
| N0 | Method | Ref. |
|---|---|---|
| 2.5 eV | exciton splitting | [20] |
| 1.2 eV | core-level photoemission | [25] |
| 3.3 eV | magnetotransport | [23] |
| 1.5 eV | magnetotransport | [24] |
| 2.1 eV | optical absorption | [20] |
Note that the exchange energy N0 refers to the exchange interaction between itinerant holes and Mn ions. N0 is related to the to the local exchange constant in the acceptor defined by E=. It is difficult to determine the explicit relation between the two quantities because the holes are tightly bound to acceptors where confinement leads to higher wavevector components of the exchange.[15]
2 EXPERIMENTAL BACKGROUND
The GaAs:Mn samples contained a thin layer ( m) of Mn doping which was produced by diffusion. MnAs was deposited on the surface of semi-insulating GaAs then heated to high temperatures (800-900 C) for several hours. Details of the diffusion procedures have been published elsewhere.[26] Capacitance-voltage (C-V) electrochemical etch profiler and secondary ion mass spectroscopy techniques were used to determine the Mn concentration profile which usually contained several plateaus of order m each. In order to achieve the desired concentration some of the sample surface was etched away.
Photoluminescence (PL) experiments were carried out using a low-power 0.63 m He-Ne laser which was unfocused and provided a power density on the sample of 10-1 W/cm-2. When the laser wavelength was shortened to 0.5 m in order to obtain a smaller penetration depth of the laser, no changes were observed in the spectra. Measurements were made in a optical cryostat containing a B=9 T superconducting magnet solenoid. The axis of the split-coil solenoid was horizontal, permitting light to be directed parallel or perpendicular to the field direction, for Faraday or Voigt geometries, respectively. Circular polarization was selected by an infrared Polarcor dichroic glass linear polarizer and a /4 Polaroid retardation plate (/2 at 0.4 m). This combination produced polarization rejection exceeding 95% in the wavelength region of interest. Opposite circular polarizations were obtained by rotating the retardation plate by 90 deg. After the polarization was selected, the PL light was focused into a 600 m diameter core optical fiber which transferred the light to a 1/4 m imaging spectrometer and CCD camera.
Polarized spectra were obtained in Faraday and Voigt configurations, with light propagating along or at right angles to the magnetic field direction, respectively. Circular polarization in the Faraday configuration is defined in the usual way,
where and are the PL intensities for light polarized and , respectively. In a similar way, linear polarization in the Voigt configuration is defined by,
where and are the PL intensities for light polarized parallel and perpendicular to the magnetic field direction, respectively.
3 EXPERIMENTAL RESULTS
3.1 Electron-hole Recombination Emission
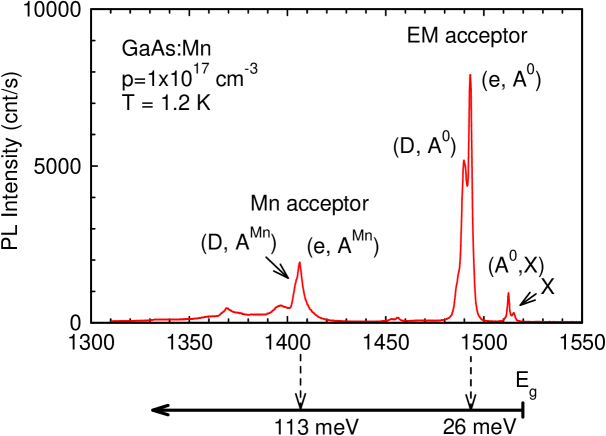 |
The PL spectrum for a lightly Mn-doped (11017 cm-3) GaAs sample is shown in Fig. 1. There are three spectral regions of interest. These regions correspond to recombination emission of valence band holes in various configurations. Near the bandgap, between 1510 and 1520 meV, holes are bound in excitons. The dominant peak in this region arises from recombination of excitons bound to effective mass acceptors, denoted (AEM,X). In the region between 1480 and 1500 meV, holes are bound to effective mass acceptors, so recombination arises from electrons which are either free, (e,AEM), or bound in donors, (Do,AEM). Table II displays the transitions and their energies.
| Energy (meV) | Transition |
|---|---|
| 1515.17 | X (free exciton) |
| 1512.5 | (AEM,X) |
| 1493.0 | (e,AEM) |
| 1489.7 | (D,AEM) |
| 1456.0 | (e,AEM)– LO |
| 1452.9 | (D,AEM)– LO |
| 1406.2 | (e,AMn), (D,AMn) |
| 1396.1 | A*Mn |
| 1369.2 | (e,AMn)– LO |
| 1359.8 | A*Mn– LO) |
In the spectral region of current interest, near 1400 meV, the recombining holes are tightly bound in acceptor states with Mn at the center. Similar to the effective mass acceptors, electrons are either free (e,AMn) or bound to donors (Do,AMn). [27, 14] The peaks labeled A*Mn have the same polarization as the other AMn transitions in the 1400 meV region and are attributed to Mn acceptors with an additional 10 meV binding of unknown origin. There are also features corresponding to LO phonon replicas of the acceptor features which are downshifted by 36.7 meV. The scale at the bottom of Fig. 1 shows the spectral energies relative to the bandgap at 1519 meV. From these energies, the binding energy for the hole in Mn acceptors is seen to be 113 meV, while that for the effective mass acceptor is only 26 meV.
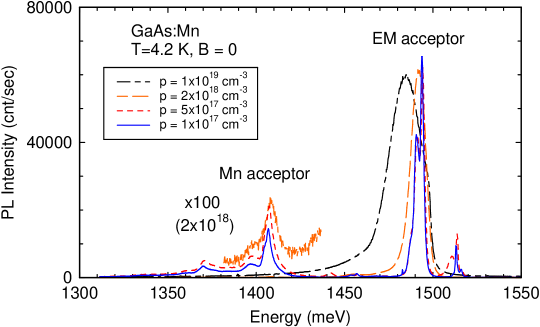
Figure 2 displays PL spectra for other Mn concentrations, from 1017 to 1019 cm-3. Both effective mass and Mn acceptor features are observed. The intensity of the Mn-related features decreases with increasing Mn concentration. This is attributed to several factors. At the highest concentration, 1019 cm-3, the acceptor wavefunctions are beginning to overlap, leaving fewer Mn acceptors which are isolated. In addition, at higher concentrations there is greater recombination from effective mass acceptors, due to higher disorder.
 |
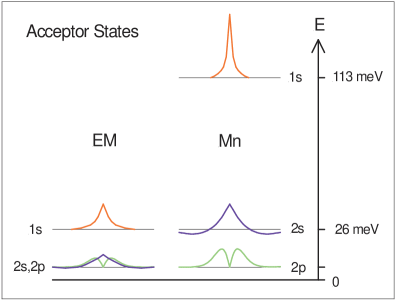 |
Figure 3 displays the energy levels relative to the valence band for both EM and Mn acceptors. On the left side, the 1S(EM) orbital level is at 26 meV. On the right side, the 1S(Mn) level is at 113 meV. The larger binding energy for the Mn acceptor compared to the effective mass acceptor results from additional ”central cell” type attraction. The 2S(Mn) level, at 25.3 meV, [28] is close to the 1S(EM) level. In contrast, the 2P(Mn) level is far removed from the 2S(Mn) level, being close to the 2S/2P(EM) levels. This large splitting between S- and P-states for the Mn acceptor has been observed in infrared excitation experiments.[28] Both the coincidence of the energies of the 2P(Mn) and 2S/2P(EM) levels and the large 2S(Mn)-2P(Mn) splitting result from the character of the P-orbital wavefunctions of the hole, illustrated in Fig. 3. The wavefunction of the P-orbital is zero at the Mn ion site which inhibits the central cell attraction — point-contact central cell attractive potentials are effective only when the hole is at the position of the Mn ion. This holds for both chemical and magnetic central cell attraction.
3.2 Polarization of Emission
The PL spectrum was measured in an applied magnetic field, B. Shifts in the spectral energy were small, less than 1 meV for fields up to B=9 T. The large shifts and splittings reported in a previous study [19] could not be reproduced here. In spite of the small energy shifts, the spectra showed large changes in the polarization. Figure 4 displays spectra at B=2 T in the two circular polarizations, (solid curve) and (dashed curve).
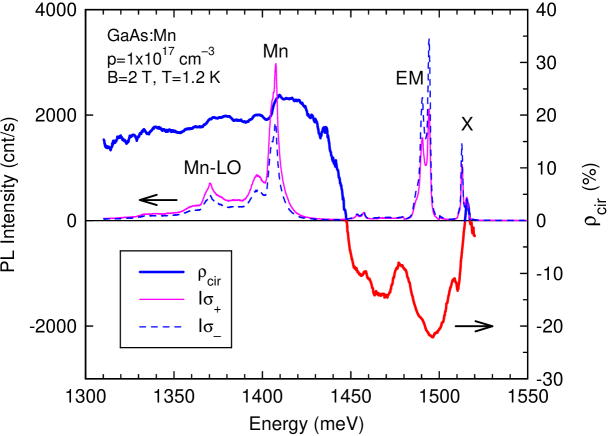 |
In the region of the effective mass acceptor, labeled EM, the emission is stronger in polarization than in . In contrast, the region near the Mn acceptor, labeled Mn, shows stronger polarization than . The energy dependence of the circular polarization is also shown. It was computed from the two spectra using I+(E) and I-(E). The polarization changes sign at an energy of 1450 meV. This plot shows that the energy region dominated by AEM recombination has negative circular polarization, while the energy region dominated by AMn recombination has positive polarization.
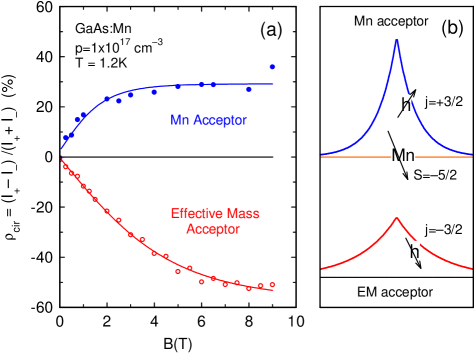 |
Figure 5 shows the variation of the circular polarization as a function of magnetic field. For both the AEM and AMn recombination, the polarization increases linearly with increasing magnetic field and shows saturation at high fields, due to a thermal activation process similar to a Brillouin function. The reversal of the sign of the polarization indicates that the spin of the hole bound to a AMn is reversed relative to the hole bound to an AEM.[14] This is illustrated in the diagrams on the right of the figure. In the case of AEM, the valence band hole is spin down, j=–3/2. In the case of AMn, the hole is spin up, j=+3/2. The exchange coupling between the Mn spin and the hole spin is responsible for reversing the direction of the hole. At low temperature, the MAC complex (hole+Mn) has the spin configuration J=1, mJ= –1. Thus, the exchange magnetic field from the oriented Mn spin overwhelms the applied magnetic field seen by the hole. There are other notable differences in the data for the two types of acceptors: the saturation value is smaller for AMn, and the field required to reach saturation is smaller for AMn. The exchange coupling between the hole spin and the Mn spin is discussed in the next section.
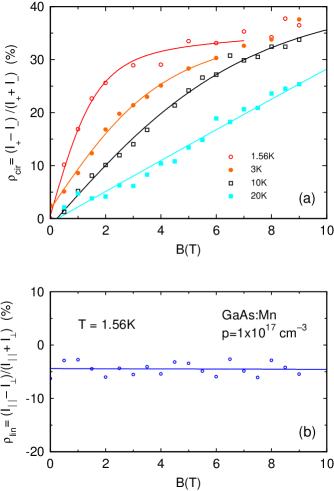
The temperature dependence of the circular polarization was investigated over the temperature range from T=1.2 to 20 K. Figure 6a shows the circular polarization at temperatures from T=1.56 to 20 K. Higher temperatures require a larger magnetic field to produce saturation. Figure 6b shows the dependence of the linear polarization at low temperature. In contrast to the circular polarization, there is no variation in the linear polarization above the noise level of a few degrees. The small offset is related to the apparatus rather than the sample. On the other hand, the AEM recombination emission showed a small field dependence in the linear polarization, but that is not of interest here.
 |
4 MODELING
4.1 Polarization of Optical Transistions
In order to fit the polarization data for the Mn acceptor it is necessary to determine the angular momentum mixing of the hole spin and Mn-ion spin, as well as optical transition matrix elements connecting the conduction band (cb) and valence band states. The angular momentum mixing can be determined using the Clebsch-Gordon coefficients (CG), while the matrix elements (ME) can be determined by considering the Luttinger-Kohn basis states. These quantities are described in the following sections. In addition to these two factors, overlap of the electron and hole wavefunctions () could be important, but is neglected here because of the uncertainty in the wavefunction of the tightly bound hole. The relative intensities of the emission in the various polarization configurations is thus proportional to
In general, the magnetic field and temperature dependencies of the polarizations follow a Boltzman-like thermal activation function having an argument which is equal to the magnetic energy divided by the thermal energy. At high fields and low temperatures (high B/T) the polarization saturates, as seen in Figs. 5 and 6. The magnitude of the polarization at saturation is found
by assuming that the final electron states are ,
where is a n=0 Landau level spatial wave function, is a product
of a Mn ion (S=5/2) state with a conduction band (s=1/2) basis state, and the initial hole
state is in the lowest-energy mixed acceptor state .
4.1.1 Angular Momentum Mixing of Hole Spin and Mn ion Spin
In the acceptor, mixing occurs between the j=3/2 hole spin and the S=5/2 Mn2+ spin. The total angular momentum of the hole-Mn complex is J=j+S=1,2,3,4. Using Clebsch-Gordon coefficients, the eigenstates for the lowest energy state J=1 are:
The final states in the cb are products of Mn ion states with Landau level
states for the cb. The n=0 Landau level state is , where the
=+1/2 state has the lower energy, since the effective g-factor, g*=0.44, is negative.
4.1.2 Optical Transition Matrix Elements
The interband optical transitions coupling electrons in the conduction band to free holes in the valence band involve the standard matrix elements between Luttinger-Kohn basis states. The velocity operators, , are in units of P/m, where P is the interband matrix element. These are given below for the two circular and linear polarizations, and , respectively.
4.1.3 Combined Angular Momentum Mixing and Optical Matrix Elements
The following table shows the product of angular momentum mixing and optical matrix elements for transitions in which an electron in the n=0 cb Landau level combines with a hole in the J=1 magnetic acceptor complex (omitting a constant overlap integral, and P/m).
4.1.4 Wavefunction Overlap
In addition to the angular momentum mixing and optical matrix elements, there is also a factor involving the overlap of the hole wavefunction = with the Landau wavefunctions of the conduction band. Several theories of acceptors incorporating central cell attraction have been developed.[15, 29] Baldereschi and Lipari have modeled the acceptor without central cell attraction.[30] In this model, the acceptor-bound hole wavefunctions in the spherical approximation are given by:[31]
where the multicomponent wavefunctions on the right side are usually represented as column vectors instead of row vectors.
5 Results of Polarization Saturation
From Fig. 6 we find the experimental circular and linear polarizations at saturation, listed in the table below. The theoretical values were computed using the coefficients in the first three rows of the table in section 4.1.3.
For circular polarization there is good agreement between experiment and theory. For linear polarization the agreement is not as good. However, by assuming a smaller wavefunction overlap for -polarization, where =, then =0 is in better agreement with the experiment.
6 SUMMARY
The emission arising from recombination of electrons with holes bound in Mn acceptors in lightly-doped GaAs:Mn becomes polarized in an applied magnetic field. In a Faraday configuration, the circular polarization saturates at high fields at a value of =1/3. On the other hand, in a Voigt configuration, the linear polarization has near-zero polarization. These values are in agreement with theory by taking into account: (i) the angular momentum mixing of the 3/2 hole-spin with the 5/2 Mn spin; and (ii) the optical transition matrix elements connecting the conduction and valence band states. It was found that there is little effect on the polarization due to overlap of the electron and hole wavefunctions.
ACKNOWLEDGMENTS
This work was supported by the NSF grant DMR-0305360. Samples were provided by J. Hao and K.C.
Hsieh.
References
- [1] S. Datta and B. Das, “Electronic analog of the electro-optic modulator,” Appl. Phys. Lett. 56, p. 665, 1990.
- [2] G. A. Prinz, “Magnetoelectronics,” Science 282, pp. 1660–1662, 1998.
- [3] D. Loss and D. P. DiVincenzo, “Quantum computation with quantum dots,” Phys. Rev. A 57, p. 120, 1998.
- [4] B. E. Kane, “A silicon-based nuclear spin quantum computer,” Nature 393, pp. 133–137, 1997.
- [5] H. Ohno, A. Shen, F. Matsukura, A. Oiwa, A. Endo, S. Katsumoto, and Y. Iye, “(Ga,Mn)As: A new diluted magnetic semiconductor based on GaAs,” Appl. Phys. Lett. 69, p. 363, 1996.
- [6] H. Ohno, “Making nonmagnetic semiconductors ferromagnetic,” Science 281, p. 951, 1998.
- [7] T. Dietl, H. Ohno, F. Matsukura, J. Cibert, and D. Ferrand, “Zener model description of ferromagnetism in zinc blende magnetic semiconductors,” Science 287, pp. 1019–22, 2000.
- [8] J. Konig, H.-H. Lin, and A. H. MacDonald, “Theory of diluted magnetic semiconductor ferromagnetism,” Phys. Rev. Lett. 84, pp. 5628–5631, 2000.
- [9] H. Akai, “Ferromagnetism and its stability in the diluted magnetic semiconductor(In,Mn)As,” Phys. Rev. Lett. 81, pp. 3002–3005, 1998.
- [10] J. Szczytko, A. Twardowski, K. Swiatek, M. Palczewska, M. Tanaka, T. Hayashi, and K. Ando, “Mn impurity in Ga1-xMnxAs epilayers,” Phys. Rev. B 60, pp. 8304–8, 1999.
- [11] J. Schneider, U. Kaufmann, W. Wilkening, M. Baeumler, and F. Kohl, “Electronic structure of neutral manganese acceptor in GaAs,” Phys. Rev. Lett. 59, p. 240, 1987.
- [12] J. Kreisel and W. Ulrici, “Neutral manganese acceptor in GaP: An electron-paramagnetic-resonance study,” Phys. Rev. B 54, p. 10508, 1996.
- [13] R. A. Chapman and W. G. Hutchinson, “Photoexcitation and photoionization of neutral manganese acceptors in gallium arsenide,” Phys. Rev. Lett. 18, p. 443, 1967.
- [14] A. Petrou, M. C. Smith, C. H. Perry, J. M. Worlock, J. Warnock, and R. L. Aggarwal, “Photoluminescence of Mn accceptor in GaAs at high magnetic fields,” Sol. State Commun. 55, p. 865, 1985.
- [15] A. K. Bhattacharjee and C. Benoit a la Guillaume, “Theory of Mn acceptors in GaAs,” Sol. State Commun. 113, pp. 17–21, 1999.
- [16] D. A. Woodbury, J. A. Kennewell, and J. S. Blakemore, “Negative magnetoresistance in GaAs containing Mn or Ni acceptors,” J. Appl. Phys. 48, pp. 1268–1271, 1977.
- [17] M. Ilegems, R. Dingle, and L. W. Rupp, “Optical and electrical properties of Mn-doped GaAs grown by molecular-beam epitaxy,” J. Appl. Phys. 46, pp. 3059–3065, 1975.
- [18] Y. Iye, A. Oiwa, A. Endo, S. Katsumoto, F. Matsukura, A. Shen, H. Ohno, and H. Munekata, “Metal insulator transition and magnetotransport in III-V compound diluted magnetic semiconductors,” Mat. Sci. Eng. B 63, pp. 88–95, 1999.
- [19] X. C. Liu, D. Heiman, J. Hao, and K. C. Hsieh, “Magnetic acceptor complex in Mn doped GaAs: a new type of exchange center,” Materials Science Forum 182, pp. 627–30, 1995.
- [20] J. Szczytko, W. Mac, A. Twardowski, F. Matsukura, and H. Ohno, “Antiferromagnetic p-d exchange in ferromagnetic Ga1-xMnxAs epilayers,” Phys. Rev. B 59, pp. 12935–12939, 1999.
- [21] D. Heiman, P. Wolff, and J. Warnock, “Spin-flip scattering, bound magnetic polaron, and fluctuations in (Cd,Mn)Se,” Phys. Rev. B 27, p. 4848, 1983.
- [22] D. Heiman, Spectroscopy of Magnetic Ions in High Magnetic Fields, p. 847. High Magnetic Fields in the Physics of Semiconductors II, eds. G. Landwehr and W. Ossau, World Scientific, 1997.
- [23] F. Matsukura, H. Ohno, A. Shen, and Y. Sugawara, “Transport properties and origin of ferromagnetism in (Ga,Mn)As,” Phys. Rev. B 57, pp. R2037–2040, 1998.
- [24] T. Omiya, F. Matsukura, T. Dietl, Y. Ohno, T. Sakon, M. Motokawa, and H. Ohno, “Magnetotransport properties of (Ga,Mn)As investigated at low temperature and high magnetic field,” cond-mat/9909393 , 1999.
- [25] J. Okabayashi, A. Kimura, O. Rader, T. Mizokawa, A. Fujimori, T. Hayashi, and M. Tanaka, “Mn 3d partial density of states in Ga1-xMnxAs studied by resonant photoemission spectroscopy,” Phys. Rev. B 58, pp. R4211–4, 1998.
- [26] C. H. Wu and K. C. Hsieh, “The effects of As overpressure and diffusion source on the diffusion of Mn in GaAs,” J. Appl. Phys. 72, p. 5642, 1992.
- [27] D. Bimberg, “Anomaly of the linear and quadratic Zeeman effect of an effective-mass acceptor: C in GaAs,” Phys. Rev. B 18, pp. 1794–1799, 1978.
- [28] M. Linnarsson, E. Janzen, B. Monemar, M. Kleverman, and A. Thilderkvist, “Electronic structure of the GaAs:MnGa center,” Phys. Rev. B 55, pp. 6938–6944, 1997.
- [29] A. V. Malyshev, I. A. Merkulov, and A. V. Rodina, “Theory of acceptor-ground-state description and hot photoluminescence in cubic semiconductors,” Phys. Rev. B 55(7), pp. 4388–4399, 1997.
- [30] A. Baldereschi and N. O. Lipari, “Cubic contributions to the spherical model of shallow acceptor states,” Phys. Rev. B 9, pp. , 1525–1539, 1974.
- [31] A. Baldereschi and N. O. Lipari, “Spherical model of shallow acceptor states in semiconductors,” Phys. Rev. B 8, pp. 2697–2709, 1973.