Electron-lattice coupling and the broken symmetries of the molecular salt (TMTTF)2SbF6
Abstract
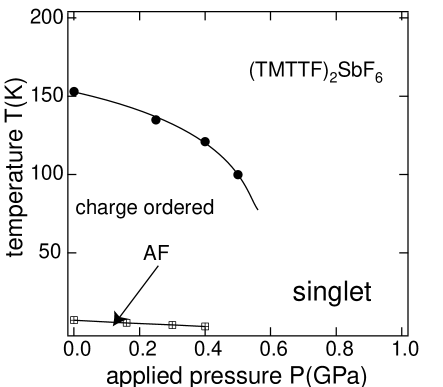
(TMTTF)2SbF6 is known to undergo a charge ordering (CO) phase transition at and another transition to an antiferromagnetic (AF) state at . Applied pressure causes a decrease in both and . When , the CO is largely supressed, and there is no remaining signature of AF order. Instead, the ground state is a singlet. In addition to establishing an expanded, general phase diagram for the physics of TMTTF salts, we establish the role of electron-lattice coupling in determining how the system evolves with pressure.
The isostructural family of charge transfer salts and are formed with singly charged anions, such as , , and Jerome and Schultz (2002), so the average hole count is /donor. In the case of the salts, they are susceptible to a charge-ordering (CO) transition at temperatures of the order of Chow et al. (2000); Monceau et al. (2001), which is often attributed to the importance of both on-site and near-neighbor Coulomb repulsion Seo and Fukuyama (1997), and influenced by electron-lattice coupling Mazumdar et al. (1999); Riera and Poilblanc (2001); Monceau et al. (2001); Clay et al. (2003); Brazovskii et al. (2003). Compared to the analog materials, the bandwidths are much smaller, and therefore models naturally producing charge order and including only electronic degrees of freedom could be expected to describe some aspects of the physics correctly. Nevertheless, it is unclear whether realistic parameters successfully describe the experiments in several ways. First, it has been argued that the near-neighbor repulsion may not be strong enough to stabilize the charge order Mazumdar et al. (2000); Riera and Poilblanc (2001); Clay et al. (2003). Furthermore, although the charge-order (CO) order parameter has not been determined directly, there is indirect evidence from transport Nad and Monceau (2002) and EPR Nakamura (2003) measurements that the order-parameter’s wavevector changes when the symmetry of the counterion is changed. An explanation should involve coupling of the charge degrees of freedom on the molecular stacks to the lattice. Calculations on one dimensional models including intramolecular, intermolecular, and counterion coupling indicate that when these degrees of freedom are included, a variety of new broken symmetry states are possible Clay et al. (2003); Riera and Poilblanc (2001); Brazovskii et al. (2003). At least in the case of the insulating TMTTF materials, it is not be surprising that the robustness of the CO influences what ground state is observed Zamborszky et al. (2002). To date, very little is known about the details of the observed phases and what controls their stability.
The sensitivity to chemical or mechanical pressure of this class of materials provides an opportunity to explore some general trends. The pressure/temperature phase diagram for Yu et al. (a), determined using NMR spectroscopy on spin-labeled crystals, appears in Fig. 1. As the pressure is increased, the ordering temperature to the CO state decreases. is reduced by almost half, to , with applied pressure. Over the same pressure range, the charge order amplitude is significantly reduced, and becomes unidentifiable at pressures beyond it. As a consequence, the actual transition line is not established beyond . Also decreasing is the AF ordering temperature . When , no experimental signature for the AF state is observed. For technical reasons associated with the experiments that are likely complicated by quenched disorder, we have not identified a phase boundary for the ground state found at high pressures. Rather, the results of experiments conducted in the range of exhibit the signatures of a singlet ground state Yu et al. (a). Below, we describe experiments that demonstrate the role of the counterion sublattice in determining the observed phase diagram.
The samples were prepared as described previously. Spin-labeled TMTTF donors were synthesized with two nuclei on the bridging sites at the center of the dimer molecules Merlic et al. (1999), and subsequent crystal growth was carried out by electrolysis. The experiments consist of and NMR spectroscopy on as a function of pressure and temperature. In the first case, the external field was , with the field applied perpendicular to the (molecular stacking) axis. For the measurements, was used. High pressure experiments were performed using a standard BeCu clamp cell using Flourinert 75 (3M) for the medium. The stated pressure, as shown in Fig. 1, is derived from the forces applied at , and systematic consistency was verified using separate calibration runs.
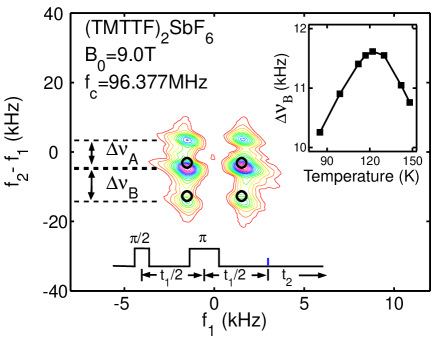
Typical spectral changes are illustrated in Fig. 2, which shows the results of two-dimensional spin-echo spectroscopy Ernst et al. (1990) NMR experiments. The experiment separates the hyperfine and chemical shifts from the internuclear dipolar coupling frequencies between pairs of neighboring nuclei app . The shifts are plotted on the vertical axis, and the -dipolar coupling is shown on the horizontal axis. We note that the frequencies and result from the Fourier transform of the two dimensional data set in , as defined in the figure. The spectrum taken with is shown directly, and the spectrum for is represented by the dark, open circles. Consider first the spectrum of the high-temperature phase. The signal appears at two frequencies on the axis. When , the signal features multiply.
We understand the spectrum and how the changes pertain to charge disproportionation as follows Chow et al. (2000). Within each molecule, there are two inequivalent sites, with distinct hyperfine couplings. This is the reason for signals appearing at two frequencies along the axis in the high symmetry phase. Let’s refer to them as for the higher (lower) frequency. The number of features are doubled in the CO phase because two inequivalent molecular environments develop, which we can label as , . As the NMR frequencies are related to the carrier densities on the and molecules, the frequency differences (e.g.,) are related to the CO order parameter. Some of the absorption features are unresolved in the spectrum shown. The inset shows the temperature dependence , which saturates and then decreases upon cooling.
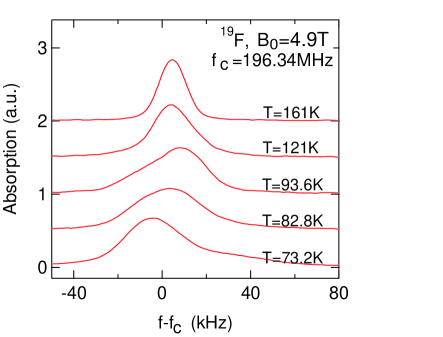
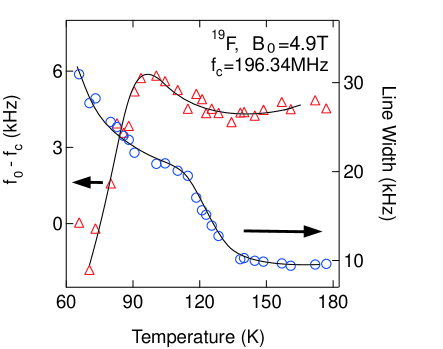
In Fig. 3 are shown spectra recorded over a range of temperatures. From approximately and below, changes in both the first moment and linewidth are noticeable. These are summarized in Fig. 4, where the linewidth is defined as the frequency span that includes half of the integrated intensity. Changes appear to occur in two steps, the first in a temperature range centered about and the second in a temperature range around .
In discussing these results, we first consider the nature of the linewidth broadening. It is natural, at least in part, to consider the spectral effects as related to motion of the counterion. More generally, the counterions of the TMTTF and TMTSF salts fall into two classes: centrosymmetric and non-centrosymmetric. In the first class are the hexaflourides , , and , and , and in the second are , , etc. All are small and compact; is one of the largest, with the linear distance approximately . At high temperatures the orientation of the counterions is known to be highly disordered, and thought to be rotating McBrierty et al. (1982). Upon cooling, the non-centrosymmetric counterions orientationally order Pouget and Ravy (1996) in a first order phase transition, lowering the space group symmetry of the crystal. The centrosymmetric ions are not reported to do that; instead, their motions are considered activated so linebroadening is expected to occur as a crossover upon cooling and there is no broken symmetry. At first glance, our results appear inconsistent with this scenario because the lineshape is asymetric. In a single crystal, this would indicate highly disordered sites at low temperatures, and the resulting variation of chemical or Knight shifts. From the data, we see that a distribution of chemical shifts is not observable (the line is homogeneously broadened). Nevertheless, we do not rule out crystal twins as a contributing factor in producing the observed lineshape. In either case, the broadening results when anionic motions become suitably slow or a first-order orientational ordering transition of some kind takes place. The second step in the linewidth appears to be associated with dynamics of some of the methyl groups and coupling. As evidence, we note that there is a strong peak in the spin lattice relaxation in the same temperature range, and very similar in strength and temperature range to what is observed in the TMTSF salts McBrierty et al. (1982).
In this context, there is a natural association of the decrease in CO order parameter, from Fig. 2, with the line broadening and shift. For the broadening to occur, the anions must be stationary on a time scale of the order of the inverse (high-temperature) homogeneous linewidth Slichter (1996), which can occur through an activated diffusion process or as a result of a structural phase transition. For either case, the behavior of the order parameter suggests that suppression of counterion motion, or disorder associated with it, leads to suppression of the charge disproportionation on the donor molecules.
Finally, we address the evolution with pressure of both the CO order parameter and the ground states. In Fig. 1, neither the line demarking a transition to the CO phase, nor the CO/AF line is followed to . In transport experiments Monceau , there is an indication that the dielectric and resistive anomalies associated with the transition to the CO phase are monotonically suppressed with applied pressure. Our own transport studies confirm this. In the NMR spectrum, we observe some broadening of the spectral features, along with a weakening of the CO order parameter as pressure is increased. Beyond , the CO features are unresolved. At the same time, the temperature at which linebroadening is observed coincides with the broadening and increases with pressure Yu et al. (b). These observations suggest that there is a phase competing with the CO, and its stability is associated with counterion degrees of freedom.
A natural first step is the quasi-one dimensional extended Hubbard model, including only electronic degrees of freedom Seo and Fukuyama (1997). With large enough on-site and near-neighbor repulsions and (relative to hopping integral ) in -filled systems, a charge pattern of alternating rich and poor sites is produced and the ground state is antiferromagnetic. Nevertheless, there are no diffraction experiments identifying the order parameter, and including electron-lattice coupling leads to other possibilities for the charge configuration of the CO state Mazumdar et al. (2000). It is also argued that the physically appropriate values for may not exceed the threshold for charge order. Nevertheless, producing ferroelectricity, as inferred from low-frequency dielectric experiments Monceau et al. (2001), from the CO phase requires more couplings. Including the counterion naturally gives rise to ferroelectric order parameters Riera and Poilblanc (2001); Brazovskii et al. (2003). And Peierls-type coupling to the lattice leads to order parameters reminiscent of Spin-Peierls order Mazumdar et al. (1999); Riera and Poilblanc (2000). Then, it follows that a large-amplitude CO follows from coupling to the counterion and competes with the Peierls coupling and the SP ground state Kuwabara et al. (2003). Experimental evidence for the competition was seen previously in experiments on Zamborszky et al. (2002). In the experiments reported here, the relative importance of the anion coupling is diminished once the anions freeze into place. That is, the freezing limits in some way the motion of the counterion. In turn, the coupling is reduced and the CO phase is destabilized.
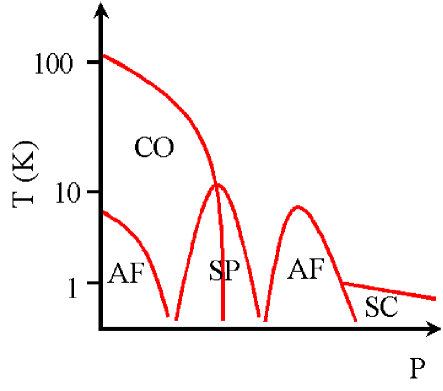
To conclude, we offer a generic phase diagram for the TMTTF and TMTSF salts that incorporates our observations for the salt. At low chemical pressure, the donor stacks are strongly dimerized, is of the order , and the ground state is antiferromagnetic. Increasing pressure leads to a frustration of the CO resulting from a modified coupling to the counterion, and once it is sufficiently suppressed the ground state is singlet (Spin-Peierls) rather than antiferromagnetic. The observation that for , is presumably associated with a competition with this non-magnetic ground state found at higher pressure. Further pressurization leads to the familiar sequence: another AF state and superconductivity. It is reasonable to ask whether this second, higher-pressure, AF state is a re-entrance of the phase described in Fig. 1, or whether it is a distinctly different symmetry breaking. The salts and should provide the answer, as they are understood to be representative of that portion of the phase diagram where the second AF phase appears. X-ray scattering results Pouget and Ravy (1997) from the two materials provide evidence for a coexistence of weak charge and bond modulations, suggesting an even richer evolution of the phases than is presented in Fig. 5.
Acknowledgements.
The research was supported by the National Science Foundation under grant number DMR-0203806. The authors are grateful for conversations with S. Brazovskii, S. Mazumda, P. Monceau, and H. Seo.References
- Jerome and Schultz (2002) D. Jerome and H. J. Schultz, Advances in Physics 51, 293 (2002).
- Chow et al. (2000) D. S. Chow, F. Zamborszky, B. Alavi, D. J. Tantillo, A. Baur, C. A. Merlic, and S. E. Brown, Phys. Rev. Lett. 85, 1698 (2000).
- Monceau et al. (2001) P. Monceau, F. Y. Nad, and S. Brazovskii, Phys. Rev. Lett. 86, 4080 (2001).
- Seo and Fukuyama (1997) H. Seo and H. Fukuyama, J. Phys. Soc. Japan 66, 1249 (1997).
- Mazumdar et al. (1999) S. Mazumdar, S. Ramasesha, R. T. Clay, and D. K. Campbell, Phys. Rev. Lett. 82, 1522 (1999).
- Riera and Poilblanc (2001) J. Riera and D. Poilblanc, Phys. Rev. B 63, 241102 (2001).
- Clay et al. (2003) R. T. Clay, S. Mazumdar, and D. K. Campbell, Phys. Rev. B 67, 115121 (2003).
- Brazovskii et al. (2003) S. Brazovskii, P. Monceau, and F. Nad, Synth. Metals 137, 1331 (2003).
- Mazumdar et al. (2000) S. Mazumdar, R. T. Clay, and D. K. Campbell, Phys. Rev. B 62, 13400 (2000).
- Nad and Monceau (2002) F. Y. Nad and P. Monceau, J. Phys. IV 12, 133 (2002).
- Nakamura (2003) T. Nakamura, J. Phys. Soc. Japan 72, 213 (2003).
- Zamborszky et al. (2002) F. Zamborszky, W. Yu, W. Raas, S. E. Brown, B. Alavi, C. A. Merlic, and A. Baur, Phys. Rev. B 66, 081103 (2002).
- Yu et al. (a) W. Yu, F. Zamborszky, B. Alavi, A. Baur, C. A. Merlic, and S. E. Brown, cond-mat/0312387.
- Merlic et al. (1999) C. A. Merlic, A. Baur, D. J. Tantillo, and S. E. Brown, Synth. Commun. 29, 2953 (1999).
- Ernst et al. (1990) R. R. Ernst, G. Bodenhausen, and A. Wokaun, Principles of nuclear magnetic resonance in one and two dimensions (Oxford University Press, Oxford, 1990), pp. 360–366.
- (16) Two inequivalent, coupled spins produce a spectrum with four lines. The Hamiltonian is given by , and the lines appear at frequences , .
- McBrierty et al. (1982) V. J. McBrierty, D. C. Douglass, F. Wudl, and E. Aharon-Shalom, Phys. Rev. B 26, 4805 (1982).
- Pouget and Ravy (1996) J. P. Pouget and S. Ravy, J. Phys. I 6, 1501 (1996).
- Slichter (1996) C. P. Slichter, Principles of nuclear magnetic resonance (Springer-Verlag, Berlin, 1996), pp. 592–595, 3rd ed.
- (20) P. Monceau, (private communication).
- Yu et al. (b) W. Yu, F. Zhang, F. Zamborszky, B. Alavi, A. Baur, C. A. Merlic, and S. E. Brown, (unpublished).
- Riera and Poilblanc (2000) J. Riera and D. Poilblanc, Phys. Rev. B 62, 16243 (2000).
- Kuwabara et al. (2003) M. Kuwabara, H. Seo, and M. Ogata, J Phys. Soc. Japan 72, 225 (2003).
- Pouget and Ravy (1997) J. P. Pouget and S. Ravy, Synth. Metals 85, 1523 (1997).