Two Superconducting Phases in CeRh1-xIrxIn5
Abstract
Pressure studies of CeRh1-xIrxIn5 indicate two superconducting phases as a function of , one with K for and the other with K for . The higher phase, phase-1, emerges in proximity to an antiferromagnetic quantum-critical point; whereas, Cooper pairing in the lower phase-2 is inferred to arise from fluctuations of a yet to be found magnetic state. The -- phase diagram of CeRh1-xIrxIn5, though qualitatively similar, is distinctly different from that of CeCu2(Si1-xGex)2.
pacs:
71.27.+a, 74.70.Tx, 74.62.Dh, 74.62.FjAs a conventional superconductor is cooled below , a finite energy gap in the electronic density-of-states opens over the entire Fermi surface. This gap to quasiparticle excitations produces an exponential temperature dependence of physical properties that depend on , eg. specific heat, thermal conductivity, and spin-lattice relaxation rate. In contrast, power-law dependences of these properties are found in superconducting heavy-fermion systems Grewe91 as well as in cuprates,Orenstein00 ruthenates Ishida00 and low-dimensional organics.McKenzie97 The existence of these power laws can be understood if the superconducting energy gap, instead of being everywhere finite, is zero on parts of the Fermi surface so that the excitation spectrum starts from zero energy. These qualitative departures from conventional behavior suggest that Cooper pairing may be mediated by excitations other than phonons. In each class of materials mentioned above, a ’dome’ of superconductivity emerges in proximity to a magnetic transition that is tuned toward zero temperature by applied pressure or changes in chemical composition. The close proximity to magnetism and evidence for power-law behaviors below argue for magnetically mediated superconductivity in which the orbital component of the superconducting order parameter is greater than zero and power laws reflect the nodal structure of the order parameter.Sigrist91
With two notable counter examples, a single dome of superconductivity tends to appear only in a relatively narrow range of tuning parameter values. One of these counter examples is U1-yThyBe13. In this case, substitutions of nonmagnetic Th for U cause a non-monotonic variation of with a sharp, non-zero minimum in near that is not due simply to pair-breaking effects, since superconductivity persists to at least .Lambert86 Pressure studiesLambert86 of the phase diagram reveal that the minimum in near evolves into a range of where there is no superconductivity and provide convincing evidence that the minimum at atmospheric pressure delineates two distinct superconducting phases. Though weak magnetism coexists with unconventional superconductivity for at atmospheric pressure, the origin of two distinct transitions remains unclear.
The other counter example is the prototypical heavy-fermion compound CeCu2Si2.Steglich79 Until recently, its inexplicably robust superconductivity with respect to pressure and complex variation of have appeared incompatible with magnetically mediated superconductivity. Detailed pressure studies of CeCu2Si2 and its slightly larger volume relatives CeCu2(Si1-xGex)2 reveal the existence of two distinct domes of different superconducting phases, one at low pressures controlled by proximity to an antiferromagnetic quantum-critical point and a second at higher pressures that coincides with a weakly first-order phase boundary delineating an isostructural volume collapse.Yuan2003 The former is consistent with a magnetic pairing mechanism, whereas the latter suggests that density fluctuations and associated Ce-valence fluctuations are involved in Cooper pairing.
CeRh1-xIrxIn5 is a candidate for demonstrating two superconducting phases. CeRhIn5 Hegger00 and CeIrIn5 Petrovic01 are isostructural, isovalent heavy-fermion compounds that form solid solutions in which the ratio of tetragonal lattice parameters, , varies linearly across the series.Pagliuso01b With progressive substitutions of Rh by Ir in CeRh1-xIrxIn5, the ground state at atmospheric pressure evolves continuously, just as it does in CeRhIn5 with applied pressure, Mito03 from antiferromagnetic () to antiferromagnetic with coexisting superconductivity () and finally to superconducting without apparent evidence for long-range magnetic order ().Pagliuso01b As the end composition CeIrIn5 is approached, there is a cusp-like minimum in near where bulk superconductivity is suppressed. The specific heat anomaly at for this composition is small, , which is only about 10% of the weak-coupling BCS value,Bianchi01 and may be non-zero because of slight variations in Rh/Ir concentrations throughout the sample. Though suppression of bulk superconductivity with small additions of Rh in CeIrIn5 might arise from Cooper-pair breaking by non-magnetic Rh ’impurities’, for or , the specific heat jump at is comparable to the BCS value,Pagliuso01b ; Bianchi01 and below , the relaxation rate and specific heat divided by temperature , indicative of unconventional superconductivity.Zheng01 As we will show, the cusp in near in CeRh1-xIrxIn5 evolves with applied pressure to become a range of compositions that separates two superconducting phases.
Simultaneous electrical resistivity and ac susceptibility measurements were used to study the response to pressure of high quality single crystals of CeRh1-xIrxIn5 for , 0.1, 0.25, 0.5, 0.75, 0.85 and 1.0. The crystals, grown from excess In flux, were carefully screened at atmospheric pressure by SQUID magnetometry to ensure the absence of free In. Pressures to 2.3 GPa were generated in a Be-Cu clamp-type cell with Flourinert as the pressure-transmitting medium, and at least seven, approximately equally spaced, pressure measurements were made on each composition. The inductively measured shift in the superconducting transition of high purity Sn or Pb determined the clamped pressure at low temperatures.
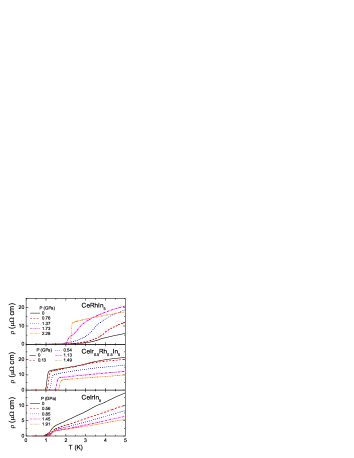
Figure 1 shows the electrical resistivity at various pressures for , 0.5 and 1.0 in CeRh1-xIrxIn5. These responses are representative of the series. For , the low temperature resistivity increases initially with applied pressure and the temperature at which the resistivity is a maximum (not shown) decreases with . Near and above , opposite trends appear — the low temperature resistivity decreases and the resistivity maximum moves to higher temperatures with applied pressure. As seen in Fig. 1, Rh/Ir substitutions have a small effect on potential scattering since the limiting resistivity just above either an antiferromagnetic or superconducting phase transition at atmospheric or high pressure varies from about for and 1.0 to about for . Qualitatively, this reflects Nordheim’s rule for isovalent substitutionsOlsen62 and is a further indication of sample homogeneity. Superimposed on this frozen disorder scattering are comparable or larger pressure-dependent changes in the inelastic scattering rate. For , pressure enhances the scattering rate as magnetic order is replaced by superconductivity; whereas, for , the scattering rate at atmospheric pressure is already relatively large and decreases with applied pressure and this trend continues with increasing . The variation in the low-temperature resistivity of this CeRh1-xIrxIn5 series at atmospheric pressure is analogous to responses found in several antiferromagnets as they are tuned by applied pressure toward a quantum critical point. Miyake02 This analogy argues that Ir substitution for Rh acts principally as an effective applied pressure and that there is a quantum-critical point at atmospheric pressure in the series near . Indeed, the ambient-pressure Néel temperature drops to at where the specific heat begins to diverge logarithmically,Pagliuso01a and, as shown in Fig. 2, Ir substitution and applied pressure are demonstrably equivalent for . The rigid shift by a constant pressure of the superconducting transition , the Néel temperature and the temperature , where the resistivity is a maximum, scales each onto a common curve. For these three compositions, the rigid pressure shift , which, extrapolating to , implies that CeIrIn5 is under an effective chemical pressure of about 10 GPa relative to CeRhIn5. This straightforward scaling breaks down for , indicating additional effects of Ir substitution.

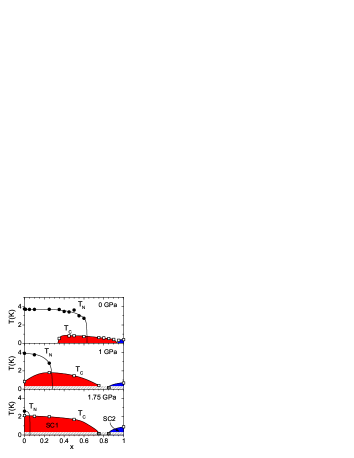
Linear interpolations of , defined by the onset of a diamagnetic response in ac susceptibility, and , determined from a change in slope of , for each value of allow the construction of isobaric phase diagrams. Data in the upper panel of Fig. 3 are results from ambient-pressure measurements,Pagliuso01b and those in the middle and lower panels are representative diagrams at pressures of 1.0 and 1.75 GPa. Similar isobaric diagrams at intermediate pressures confirm the smooth evolution seen in Fig. 3, and, in particular, the phase diagram at 2 GPa shows no evidence for antiferromagnetism. As seen in Fig. 3, the cusp-like suppression of near at evolves with applied pressure to become a range of compositions where no bulk superconductivity is detected above 0.3 K by ac susceptibility. Therefore, in CeRh1-xIrxIn5 under pressure, there is a range of compositions separating two superconducting phases, phase-1 with K for and phase-2 with K for .footnote
The results of Fig. 3 appear analogous to the evolution of in U1-yThyBe13, particularly, if we consider CeRh1-xIrxIn5 as Rh-doped CeIrIn5, as well as to the observation of two superconducting phases in CeCu2(Si,Ge)2. In the latter, each dome of superconductivity is controlled by proximity to a distinctly different transition that is tuned to by pressure. This conclusion was possible by realizing that Ge substitution for Si expands the unit-cell volume and that this expansion can be compensated by an externally applied pressure to produce nearly identical superconducting phase diagrams as a function of cell volume for both CeCu2Si2 and CeCu2Ge2.Yuan2003 A similar argument is inferred from the pressure scaling shown in Fig. 2. If the primary role of Ir substitutions for Rh is to decrease the cell volume, then the observation of two superconducting phases in CeRh1-xIrxIn5 suggests that a second superconducting phase also might emerge in CeRhIn5 at much higher pressures than investigated here. Besides a dome of superconductivity centered near the antiferromagnetic critical point at GPa where exceeds 2 K, Muramatsu et al.Muramatsu01 have reported a second dome of superconductivity in CeRhIn5 with a maximum K near 6.5 GPa. Considering that details of Ir/Rh substitution were ignored in estimating the effective pressure in CeIrIn5, this estimate and the observed pressure of 6.5 GPa are in good agreement and further suggest that the second, high-pressure dome of superconductivity in CeRhIn5 is analogous to phase-2 superconductivity in CeRh1-xIrxIn5.
This simple volume-based extrapolation was implied from the empirical observation that for . Studies at atmospheric pressure show, however, that ’s of CeRh1-xIrxIn5 are a linear function of the ratio of tetragonal lattice parameters and not cell volume (). Pagliuso02 This apparent dichotomy suggests that is not a monotonic function of pressure even though the cell volume is. Pressure-dependent structural studies of CeRhIn5 confirm this suggestion:Kumar04 exhibits two maxima as a function of pressure, one near 2.5 GPa and a second near 6 GPa. The correspondence between these maxima and those in reinforces the relationship between and found in the Rh/Ir solid solutions at atmospheric pressure. The pronounced non-monotonic variation of in CeRhIn5, though not directly established in other members of CeRh1-xIrxIn5 or in isostructural CeCoIn5, also may account for the different responses of to uniaxial pressure observed in CeIrIn5 and CeCoIn5.Oeschler03
Though the emergence of two superconducting phases in CeRh1-xIrxIn5 and CeRhIn5 under pressure appears similar to the non-monotonic variation of in CeCu2(Si,Ge)2, there is an important distinction. In the latter, there are well-defined regimes of pressure where K and K, but, the high-pressure, high- regime is accompanied by topological changes in the Fermi surfaceThomas96 and/or an increase in ground state degeneracyJaccard99 ; Bellarbi84 so that superconductivity with different ’s develops out of qualitatively different electronic states. This is not true in CeRh1-xIrxIn5 and CeRhIn5 under pressure. deHaas-van Alphen studies find that, except for expected quantitative changes due to their slightly different ratio of tetragonal lattice parameters, CeIrIn5 at and superconducting CeRhIn5 have the same Fermi-surface topology and comparably large quasiparticle masses.Haga01 ; Shishido02 Further, at atmospheric pressure, the electronic entropy to 5 K is for all ,Pagliuso01b indicating the same ground state degeneracy.
On the basis of scaling shown in Fig. 2, we assume reasonably that superconductivity in phase-1 has the same origin as in CeRhIn5 near and below 2.5 GPa, namely that superconductivity is mediated by excitations associated with proximity to an antiferromagnetic quantum-critical point. The pairing mechanism for phase-2 superconductivity is not so obvious since antiferromagnetic order appears to be well removed from this part of the phase diagram and there is no evidence for a line of valence transitions as a function of or . Like superconductivity in phase-1 where and below , the same power laws are foundThompson03 in CeIrIn5, which is representative of phase-2 superconductivity, and indicate an unconventional mechanism for superconductivity in phase-2. The pairing mechanism for phase-2 is suggested from thermal expansion measurements on CeIrIn5 in a field sufficient to destroy bulk superconductivity. In these experiments, the coefficient of -axis thermal expansion , a temperature dependence expected for thermal expansion dominated by three-dimensional critical fluctuations at an antiferromagnetic quantum-critical point.Oeschler03 These observations, together with a non-Fermi-liquid like above in CeIrIn5,Zheng01 ; Kohori01 imply that phase-2 superconductivity in CeRh1-xIrxIn5 for and, by inference, in CeRhIn5 at GPa is mediated by fluctuations arising from some form of hidden magnetic order. One possibility is that this hidden order manifests itself in field-induced magnetic transitions observed in CeIrIn5 near 40 T Stewart02 and in CeRhIn5 near 50 T.takeuchi01 Whatever the precise nature of this hidden magnetic order, the lower of phase-2 superconductivity suggests that pair-mediating fluctuation spectrum is more nearly 3-dimensional, coupling electronic states less efficiently than magnetic excitations associated with and phase-1 superconductivity.
We thank A. V. Balatsky, Y. Bang, C. D. Batista, Z. Fisk, and M. J. Graf for useful discussions. Work at Los Alamos was performed under the auspices of the U.S. Department of Energy. V. A. S. acknowledges support of the Russian Foundation for Basic Research, Grant No. 03-02-17119.
References
- (1) N. Grewe and F. Steglich, in: Handbook on the Physics and Chemistry of Rare Earths, eds. K. A. Gschneidner and L. Eyring, Vol. 14 (Elsevier, Amsterdam 1991) 343.
- (2) For example, J. Orenstein and A. J. Millis, Science 288, 468 (2000).
- (3) K. Ishida, H. Mukuda, Y. Kitaoka, Z. Q. Mao, Y. Mori, and Y. Maeno, Phys. Rev. Lett. 84, 5387 (2000).
- (4) For example, R. H. McKenzie, Science 278, 820 (1997).
- (5) M. Sigrist and K. Ueda, Rev. Mod. Phys. 63, 239 (1991).
- (6) S. E. Lambert, Y. Dalichaouch, M. B. Maple, J. L. Smith, and Z. Fisk, Phys. Rev. Lett. 57, 1619 (1986).
- (7) F. Steglich, J. Aarts, C. D. Bredl, W. Lieke, D. Meschede, W. Franz, and H. Schäfer, Phys. Rev. Lett. 43, 1892 (1979).
- (8) H. Q. Yuan, F. M. Grosche, M. Deppe, C. Geibel, G. Sparn, and F. Steglich, Science 302, 2104 (2003).
- (9) H. Hegger, C. Petrovic, E. G. Moshopoulou, M. F. Hundley, J. L. Sarrao, Z. Fisk, and J. D. Thompson, Phys. Rev. Lett. 84, 4986 (2000).
- (10) C. Petrovic, R. Movshovich, M. Jaime, P. G. Pagliuso, M. F. Hundley, J. L. Sarrao, Z. Fisk, and J. D. Thompson, Europhys. Lett. 53, 354 (2001).
- (11) P. G. Pagliuso, C. Petrovic, R. Movshovich, D. Hall, M. F. Hundley, J. L. Sarrao, J. D. Thompson, and Z. Fisk, Phys. Rev. B 64, 100503(R) (2001).
- (12) T. Mito S. Kawasaki, Y. Kawasaki, G. -q. Zheng, Y. Kitaoka, D. Aoki, Y. Haga, and Y. Ōnuki, Phys. Rev. Lett. 90, 077004 (2003); S. Kawasaki, T. Mito, Y. Kawasaki, G.-q. Zheng, Y. Kitaoka, D. Aoki, Y. Haga, and Y. Ōnuki, Phys. Rev. Lett. 91, 137001 (2003).
- (13) A. Bianchi, R. Movshovich, M. Jaime, J. D. Thompson, P. G. Pagliuso, and J. L. Sarrao, Phys. Rev. B 64, 220504 (2001).
- (14) G.-q. Zheng et al., unpublished; G.-q. Zheng, K. Tanabe, T. Mito, S. Kawasaki, Y. Kitaoka, D. Aoki, Y. Haga, and Y. Ōnuki, Phys. Rev. Lett. 86, 4664 (2001).
- (15) For example, J. L. Olsen, Electron Transport in Metals (Wiley, New York, 1962).
- (16) K. Miyake and O. Narikiyo, J. Phys. Soc. Jpn. 71 867 (2002).
- (17) P. G. Pagliuso et al., unpublished.
- (18) Additional measurements find that is less than 1 K for CeRh0.5Ir0.5In5 at GPa and that the bulk superconducting transition of CeIrIn5 does not exceed 1.2 K at pressures to GPa.
- (19) T. Muramatsu, N Tateiwa, T. C. Kobayashi, K. Shimizu, K. Amaya, D. Aoki, H. Shishido, Y. Haga, and Y. Ōnuki, J. Phys. Soc. Jpn. 70, 3362 (2001).
- (20) P. G. Pagliuso, R. Movshovich, A. D. Bianchi, M. Nicklas, N. O. Moreno, J. D. Thompson, M. F. Hundley, J. L. Sarrao, Z. Fisk, Physica B 312-313, 129 (2002).
- (21) R. S. Kumar, H. Kohlmann, B. E. Light, A. L. Cornelius, V. Raghavan, T. W. Darling, and J. L. Sarrao, Phys. Rev. B 69, 014515 (2004).
- (22) N. Oeschler, P. Gegenwart, M. Lang, R. Movshovich, J. L. Sarrao, J. D. Thompson, and F. Steglich, Phys. Rev. Lett. 91, 076402 (2003).
- (23) F. Thomas, C. Ayache, I. A. Fominey, J. Thomasson and C. Geibel, J. Phys.: Condens. Matter 8, L51 (1996).
- (24) D. Jaccard, H. Wilhelm, K. Alami-Yadri, E. Vargoz, Physica B 259-261, 1 (1999).
- (25) B. Bellarbi, A. Benoit, D. Jaccard, J. M. Mignot, and H. F. Braun, Phys. Rev. B 30, 1182 (1984).
- (26) Y. Haga, Y. Inada, H. Harima, K. Oikawa, M. Murakawa, H. Nakawaki, Y. Tokiwa, D. Aoki, H. Shishido, S. Ikeda, N. Watanabe, and Y Ōnuki, Phys. Rev. B 63, 060503 (2001).
- (27) H. Shishido, R. Setai, D. Aoki, S. Ikeda, H. Nakawaki, N. Nakamura, T. Iizuka, Y. Inada, K. Sugiama, T. Takeuchi, K. Kindo, T. C. Kobayashi, Y. Haga, H. Harima, Y. Aoki, T. Namiki, H. Sato, and Y. Ōnuki, J. Phys. Soc. Jpn. 71, 162 (2002).
- (28) J. D. Thompson, M. Nicklas, A. Bianchi, R. Movshovich, A. Llobet, W. Bao, A. Malinowski, M. F. Hundley, N. O. Moreno, P. G. Pagliuso, J. L. Sarrao, S. Nakatsuji, Z. Fisk, R. Borth, E. Lengyel, N. Oeschler, G. Sparn, and F.Steglich, Physica B 329-333, 446 (2003).
- (29) Y. Kohori, Y. Yamato, Y. Iwamoto, T. Kohara, E. D. Bauer, M. B. Maple, and J. L. Sarrao, Phys. Rev. B 64, 134526 (2001).
- (30) J. S. Kim, J. Alwood, P. Kumar and G. R. Stewart, Phys. Rev. B 65, 174520 (2002).
- (31) T. Takeuchi, T. Inoue, K. Sugiyama, D. Aoki, Y. Tokiwa, Y. Haga, K. Kindo and Y. Ōnuki, J. Phys. Soc. Jpn. 70, 877 (2001).