Damping of the de Haas-van Alphen oscillations in the superconducting state of MgB2
Abstract
The de Haas-van Alphen (dHvA) signal arising from orbits on the Fermi surface sheet of the two-gap superconductor MgB2 has been observed in the vortex state below . An extra attenuation of the dHvA signal, beyond those effects described in the conventional Lifshitz-Kosevich expression, is seen due to the opening of the superconducting gap. Our data show that the band gap is still present up to . The data are compared to current theories of dHvA oscillations in the superconducting state which allow us to extract estimates for the evolution of the band gap with magnetic field. Contrary to results for other materials, we find that the most recent theories dramatically underestimate the damping in MgB2.
I Introduction
The existence of two distinct energy gaps in the superconducting state of MgB2 has been demonstrated by a number of experiments, including: tunneling,Iavarone et al. (2002) specific heat,Bouquet et al. (2001, 2002) magnetic penetration depth Manzano et al. (2002) and angle resolved photoemission spectroscopy (ARPES). Souma et al. (2003); Tsuda et al. (2003) Although there have been indications of two, or multi-gap, effects in other materials, Shen et al. (1965); Binnig et al. (1980) it is in MgB2 where the behavior has been most thoroughly investigated. Band structure calculations Kortus et al. (2001) have shown that the Fermi surface of MgB2 consists of four sheets, mostly arising from the boron orbitals. Two quasi-two-dimensional sheets originate from the boron orbitals and two more isotropic honeycomb shaped sheets from the boron orbitals. Theoretical work Liu et al. (2001); Choi et al. (2002) has predicted that the superconducting energy gap is substantially larger on the sheets than on the sheets (at zero field and temperature the two gaps have been measured to be 78 K and 29 K).Manzano et al. (2002); Carrington and Manzano (2003)
Although there have been several studies which have accurately measured the temperature dependence of the two gaps,Gonnelli et al. (2002); Iavarone et al. (2002); Szabo et al. (2001) there has been much less work in establishing how they evolve with magnetic field. Theoretical work Graser et al. (2004) predicts that at high field both gaps decrease towards zero at a common upper critical field () value, although at lower field is depressed much more rapidly than , particularly for . Dahm Experimentally, the only direct studies of this have been by point contact spectroscopy. It has been suggested Daghero et al. (2003) that goes to zero at (for ), which is much lower than , although othersBugoslavsky et al. (2003); Gonnelli et al. (2003) have concluded that remains finite above but becomes increasingly difficult to resolve because of scattering. In this paper, we use dHvA measurements as a probe of the gap in high magnetic fields. Our data clearly show the presence of a gap on one -band sheet right up to the ‘bulk’ .
The existence of dHvA oscillations in the superconducting state has been the subject of study for a number of years, and has been observed in a number of different materials: NbSe2 (Ref. Corcoran et al., 1994a), V3Si (Ref. Corcoran et al., 1994b), Nb3Sn (Ref. Harrison et al., 1994), (ET)2Cu(NCS)2 (Ref. Clayton et al., 2002), YNi2B2C (Ref. Heinecke and Winzer, 1995) and several heavy fermion compounds.Settai et al. (2001); Inada et al. (1999); Ohkuni et al. (1999); Bergemann et al. (1997); Hedo et al. (1995) The effect is usually thought to arise through the overlap of quasiparticle states outside the vortex core. The amplitude of the oscillations is governed by the magnitude of the field dependent superconducting energy gap. In theory the effect can be used to resolve the gaps on different Fermi surface sheets and to probe the field dependence of these gaps. However, in the current study scattering restricts our study to only one Fermi surface sheet.
The amplitude of the dHvA oscillations is interpreted using the Lifshitz-Kosevich equation for the oscillatory torque of a three-dimensional Fermi liquid. The amplitude of the first harmonic is given by Shoenberg (1984); Wasserman and Springford (1994)
| (1) |
Here the dHvA frequency is related to the extremal area () of the orbit in -space by , is the curvature factor and is the phase. The factor where , accounts for the effects of thermal broadening of the Landau-levels. It is from this temperature dependent term that the quasi-particle effective mass is determined. The Dingle factor accounts for the effect of impurities and is given by , where , is the unenhanced band mass Shoenberg (1984); Wasserman and Springford (1994) and is the scattering time. The spin splitting factor accounts for the reduction of amplitude caused by beating between the spin-up and spin-down Fermi surfaces. It is given by where is the orbitally averaged exchange-correlation (Stoner) enhancement factor, is the electron -factor, is the free-electron mass and is an integer. The final factor, , parameterizes the effect of superconductivity on the dHvA amplitude. It is this factor which is the primary focus of the current work and will be described more fully below.
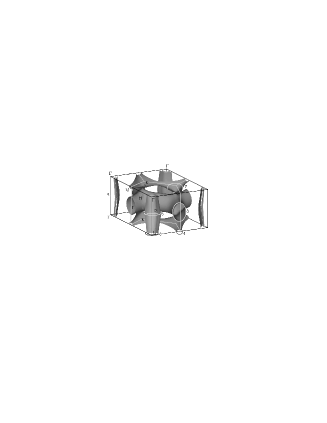
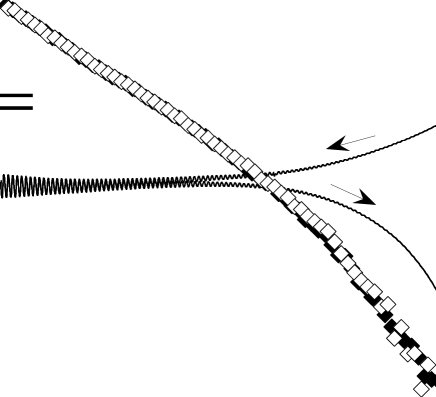
The calculated Fermi surface of MgB2, with predictedHarima (2002); Rosner et al. (2002); Mazin and Kortus (2002) dHvA orbits, is shown in Fig. 1. We denote the frequency of each orbit, , at a general angle by . Previous studiesYelland et al. (2002); Carrington et al. (2003) have succeeded in observing orbits 1 to 6, thus verifying the topology of the calculated Fermi surface. The measured -space areas of the orbits and the quasiparticle effective masses were found to be in good overall agreement with the calculations.Harima (2002); Rosner et al. (2002); Mazin and Kortus (2002) Orbit 7 (Ref. Harima, 2002) was not observed experimentally, perhaps because of a slight departure of Fermi surface topology from the calculations, or alternatively because of increased scattering on this orbit.

The relative amplitude of the various orbits is somewhat sample dependent. We have found that the mean-free-paths for different orbits does not change in a uniform way between samples.Carrington et al. (2003) Orbits 1-3 have by far the largest amplitude for fields below 20 T. The frequencies of these orbits all vary approximately like (or ), although for and there are some departures from this simple behavior due to the warping of the band sheet (see Ref. Yelland et al., 2002 for details). The amplitude of orbits 1 – 3 as a function of angle as the magnetic field is rotated from (=0) to (=90∘) is shown in Fig. 2. The strong angular dependence of , combined with the exponential attenuation of the signal by the Dingle factor, limits the range of angles where we are able to observe oscillations below to 6681∘ for the present crystals. The amplitude of the signal from orbits 1 and 2 at (Fig. 2 inset) is many orders of magnitude below our noise level, and so our study is limited to orbit 3 on the electron-like sheet. We estimate that the mean-free-path would have to be 3 times larger on orbit 1 for us to be able to see these oscillations at T (for these crystals T at , although this does decrease with increasing [Ref. Carrington et al., 2003]).
II Experimental Details
Rather than measure the oscillations in the magnetic susceptibility, as in a conventional field modulated dHvA experiment, we have used miniature piezoresistive cantilevers pie to measure the oscillations in the torque. We have found that this latter technique is significantly more sensitive than the former for the small size of the available high quality crystals of MgB2.
The MgB2 crystals were fixed with epoxy to the end of a boron-doped silicon cantilever about 150m long. Deflections in the cantilever were measured through the strain-induced changes in its electrical resistance, using an AC bridge technique. The torque values are reported here in units of bridge resistance , i.e, the off-balance voltage divided by the excitation current (the change in cantilever resistance is ). We estimate, using the weight of the sample, that R ( in Nm and in ). The noise limit is around 2m or Nm (this can vary by up to a factor of 10 between different levers). In addition to the changes in resistance caused by the torque there is a small monotonic magnetoresistance of the sensor which we have not attempted to correct for.
The cantilever is mounted on a single axis rotation stage in a 3He cryostat inside the bore of a 19 T superconducting magnet (20.5 T at =2.2 K). Unless otherwise stated, all measurements in this paper were performed in liquid 3He at 32020 mK. The orientation of the cantilever mount is detected using a pickup coil and a small modulated field collinear with the DC field. The small offset between the crystal plane and the cantilever mount was corrected using the symmetry of the dHvA frequencies around the and 90∘ points giving an uncertainty in the out of plane angle of 0.2∘ (at ). The in-plane orientation of the crystal, , (measured from the a-axis) is fixed for each run and measured by optical photographs and Laue X-ray diffraction (to ). A more precise determination of was made by comparing the minimum in the frequency of orbit 3 as a function of to the known frequency for this orbit at , as measured on a large number of other crystals Cooper et al. (2003) (the minimum frequency varies approximately as .
The torque, both due to the oscillations and the background magnetism, causes a deflection of the lever, and so is not quite constant during the field sweep. Using the strong angular dependence of the dHvA frequencies, we are able to measure the correspondence between the measured torque signal and the angular deflection of the cantilever. We find that the deflection is given by , which is approximately 4 times smaller than the value estimated from the manufacturer’s data sheet.pie This ‘torque interaction’ effect gives rises to spurious harmonics and mixing of the main frequencies. As the amplitude of the signal is also angle dependent (see Fig. 2) the field dependence of the signal will not exactly follow Eq. 1. Fortunately, this effect is small enough to be neglected for the purposes of the current work. This was verified by measuring samples with different masses and comparing up and down field sweeps (see later).
The samples used in this work were grown by a high pressure synthesis route as described in Ref. Karpinski et al., 2003. Most of the work reported here was conducted on a crystal measuring m3 (mass=3.9g). The of samples from this batch (AN77) was measured to be 38.5 K.
III Results
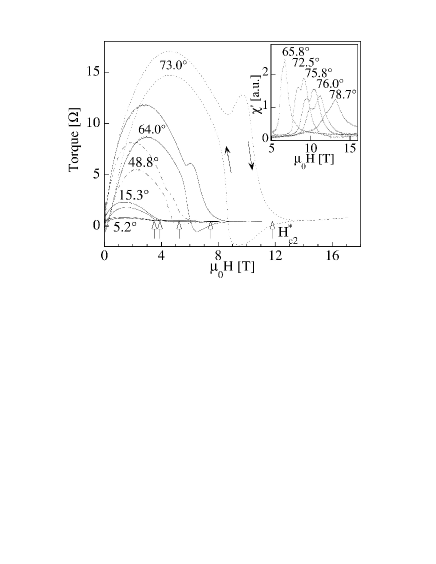
In Fig. 3 we show the measured torque versus field over a large range of field for a small sample from the same batch as our main crystal (mass=0.4g). This small sample was selected for this part of the study to avoid overstressing the cantilever. The general shape of the curve, a bell shaped bump with peak at around , has been explained theoretically in Ref. Hao and Clem, 1991. Near there is evidently a pronounced peak effect which grows in size as the angle is increased. In addition, there is a significant region above the peak effect region where the torque is sizeable and remains hysteretic. Similar features have been reported previously by Angst et al. Angst et al. (2002, 2003) in their torque study of MgB2 single crystals. Their study was conducted at higher temperature and lower field than the current work, and the peak effect they observed was less marked. In the inset to Fig. 3 we show data for the ac susceptibility of another crystal from the same batch (mass=17g). Many of the same features evident in the torque data are also visible here, namely the broad superconducting transition and the pronounced peak effect.
The existence of a pronounced curvature in the region of the normal/superconducting transition along with the peak effect feature means that there is no unambiguous way of extracting from the measured torque curves. The rounding of the transition is common in high materials where it is usually attributed to the presence of thermal or quantum fluctuations, which are enhanced relative to conventional low materials due to the low dimensionality and high of the former. MgB2 is not strongly anisotropic, but has a relatively high (for parallel to the basal plane) and hence small coherence lengths. The existence of hysteresis in this rounding region however, points to an explanation either in terms of surface superconductivityRydh et al. (2003) or an as yet unexplained two gap effect, rather than fluctuations. It may also be possible that it could result from crystal inhomogeneity, although this is unlikely as reproducible behavior is found between crystals from the same batch.
We find that the angular dependence of derived by various extrapolation schemes (e.g., position of peak effect maximum or a linear extrapolation from low field) gives different absolute values, but essentially the same form for (the same conclusion was found by Angst et al.Angst et al. (2003)). As we shall see later, the onset of damping of the dHvA oscillations essentially coincides with a critical field derived by extrapolating the low field behavior, and so it seems likely that this represents the bulk upper critical field, at least for the band.
In Fig. 4 we show values of extracted from the torque data in Fig. 3. These values are in good agreement with those extrapolated from higher temperature studies.Angst et al. (2002) In this figure we also show extracted from ac susceptibility data (inset to Fig. 3) in a similar way.
In an anisotropic superconductor the angular dependence of is usually described by
| (2) |
where is the anisotropy of . In MgB2, the contribution of multiple Fermi surface sheets with different superconducting gaps is known to cause to increase with decreasing temperature and to cause deviations from the angular dependence predicted Eq. (2).Angst et al. (2003) However, these are small on the scale of Fig. 4, and are most pronounced near . A fit of this to the data is shown as a solid line in Fig. 4 ( and 0.3 T ).
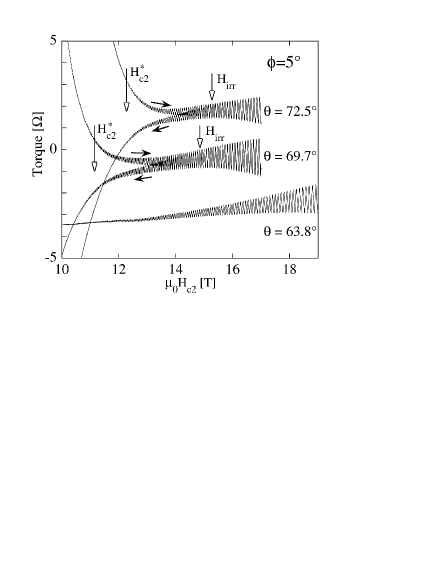
Torque versus field for our main crystal is shown in Fig. 5 for three angles ( and ). At these angles only one dHvA frequency () is visible in our field range. For pronounced hysteresis is observable which disappears at an irreversibility field T. There is a small residual field dependence in the background torque which extends to 16 T. We note that both these fields are far in excess of our estimate of obtained from the raw torque ( T). Similar behavior can be seen for .
The field dependent amplitude of the dHvA oscillations was extracted by fitting (the linear term accounts for the background torque) to different sections of data comprising of oscillations. The data were then divided by the weakly field dependent term to give (see Eq. 1). The quasiparticle effective mass in the expression for was determined by measuring the temperature dependence of the dHvA amplitude [for , at ].
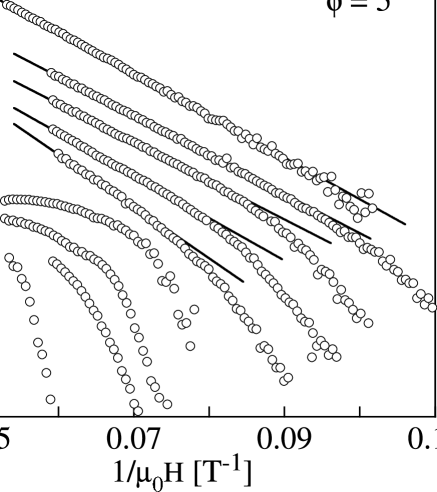
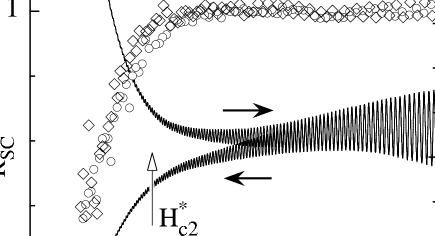
In Fig. 6 we show versus inverse field on semi-log axes (‘Dingle plot’) for several angles. For , varies strictly exponentially with inverse field, from which we estimate that the quasiparticle mean free path on this orbit is Å. For this angle there is no evidence of superconductivity in either the background or oscillatory torque (see Fig. 5). As is increased increases sharply and the Dingle plots have marked downturns below some critical field. We attribute this to the opening of the gap as the sample enters the superconducting state. To extract we fit in the normal state to the exponential expression for and extrapolate this dependence into the superconducting state (solid line in Fig. 6). Dividing by thus yields . An example of this is shown in Fig. 7 in which we also show the raw hysteretic torque. From this figure it can be seen that the onset of attenuation of the dHvA signal from does not occur until the field is below , and closely corresponds to the value (indicated by an arrow on Fig. 7) deduced by extrapolating the lower field data.
Most previous studies of the dHvA effect in the superconducting state have been conducted by the field modulation technique. In studies where this technique has been used the strong flux pinning close to (peak effect) has prevented data collection in this region. This did not present a serious problem as the oscillations could be observed far below [e.g., down to in YNi2B2C (Ref. Terashima et al., 1997) or in V3Si (Ref. Janssen et al., 1998)]. Studies of YNi2B2C have shown that, in contrast to field modulation measurements, torque measurements Goll et al. (1996) are not affected by this increased pinning. In MgB2, oscillations are only observable very close to and so all our measurements are essentially carried out in the peak effect region.
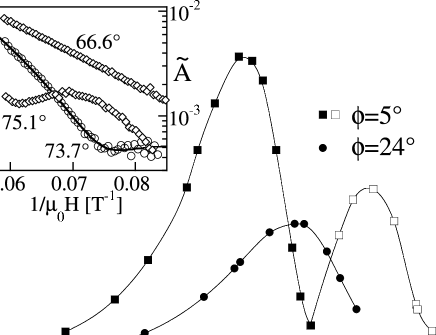
For near to there is a pronounced dip is found in the amplitude of the dHvA signal at (see Fig. 8). This feature has been present in every crystal we have measured to date and always occurs when and are adjusted so that T. Previously Carrington et al. (2003); Yelland et al. (2002) this feature has been attributed to a ‘spin-zero’, i.e., an angle where the angle dependent band mass multiplied by the Stoner factor exactly equals /2, so that . However, a detailed analysis of the field dependence of the dHvA amplitude for angles above reveals that in fact this dip is produced by a beat between two dHvA orbits with very similar frequencies. The inset to Fig. 8 shows Dingle plots close to . The data clearly show oscillatory beating damped by the Dingle factor. A fit that takes account of this effect is shown for in Fig. 8. The frequency difference is T at and extrapolates to zero at (for ). The relative amplitudes of the two frequencies are almost equal over the whole angular range. The characteristics of this orbit are very similar to an additional orbit predicted by Harima. Harima (2002) A full account of this result will be given elsewhere.Carrington and Fletcher (2004)
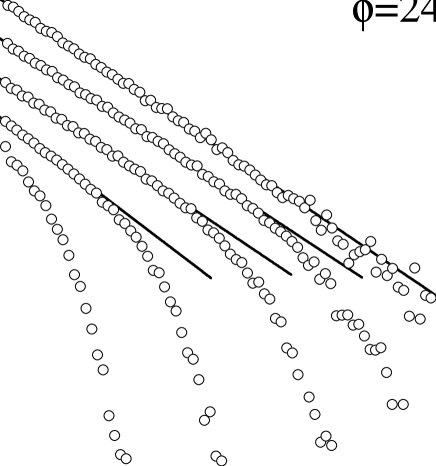
A consequence of the above dip feature is that at angles close to or beyond it is difficult to extract as the functional form of is more complicated. For this reason we performed a second set of sweeps at a different in-plane angle . With , is increased to 2930 T and thus the dip does not occur for any value of (see Fig. 8). In Fig. 9 we show the curves for this in-plane angle.
As mentioned earlier, the deflection of the cantilever, either by the background or oscillatory torque, means that the fields sweeps are not done at strictly constant angle. As the dHvA amplitude is angle dependent this may cause some additional field dependence to , which becomes large as the sample enters the superconducting state, and might cause error in our determination of . The insensitivity of our results for to this deflection is perhaps best demonstrated by comparing curves for up and down field sweeps. In Fig. 10 we show both the raw torque signal and for . There is a large difference in the background torque below in the two cases, which means that the sample is deflected in opposite directions (maximum deflection ), however it can be see that the drop in below is virtually identical (see also Fig. 7). As a further check we have repeated some our measurements on a fragment of crystal cut from our main sample which had mass of only 1.3g ( mass of main sample). We found identical behavior, showing again that the lever deflection does not affect our results. The close correspondence of the results for for up and down sweeps is also a strong indication that our data is not strongly affected by pinning in the peak effect region.
IV Extracting the gap from the superconducting state damping factor
dHvA oscillations in the superconducting state have been observed in many different materials, and in all cases the oscillations persist into the superconducting state with the same frequency as in the normal state but with reduced amplitude. As the dHvA amplitude depends exponentially on field, all the materials investigated to date are those with high values, and are not necessarily conventional. For example, NbSe2 and Nb3Sn, have recently been suspected of having an exotic gap structure. Boaknin et al. (2003); V. Guritanu et al. (2004) In some ways, MgB2 is the best understood of all the materials where this phenomena has been observed to date, although its multiple energy gap structure may complicate the analysis.
Several theoretical models have been proposed to describe the effect (see Ref. Yasui and Kita, 2002 and references therein). Two theories have proved most successful in describing the data to date. MakiMaki (1991) used a semiclassical approach following that of Brandt et al.Brandt et al. (1967), in which the gap is approximated by the spatially averaged value of and the magnetic field is considered to be uniform. For quasiparticles moving perpendicular to the magnetic field this model predicts that the excitation spectrum is gapless. It is this gaplessness which is the physical origin of the quantum oscillations. The extra damping in the superconducting state is given by
| (3) |
In this expression, the effective field dependent energy gap is resolved to that on a particular quasiparticle orbit. An equivalent expression was also derived by different authors starting from alternative physical pictures. Stephen (1992); Wasserman and Springford (1994)
An alternative expression was derived by Miyake,Miyake (1993) who considered the effect of incorporating the zero field BCS quasiparticle energy and occupation numbers into the usual Lifshitz-Kosevich theory. In the superconducting state the sharp step in the Fermi function is replaced with the BCS quasiparticle occupation function () whose width is set by the superconducting energy gap. This gives a more gradual emptying of Landau levels than in the normal state, and hence a reduced dHvA amplitude. The size of the damping factor in this model is given by
| (4) |
where is the Bessel function of the second kind. Miller and Györffy Miller and Gyorffy (1995) have derived the same result starting from the Bogoliubov-de Gennes equations.
Studies in other materials have shown that extracted by fitting data to these expressionsJanssen et al. (1998) does not always coincide with the known energy gap measured by more conventional means (for example tunneling). The correspondence between and the superconducting gap is different in each theory, and this may also be different for different materials. For example, Janssen et al.Janssen et al. (1998) found that for NbSe2 the Maki model gave whereas the Miyake model gave, . For V3Si, was found to be 2.6 and 0.61 for the two models respectively. It is generally found that the Maki model gives values for which are much larger than the Miyake model.
To compare these theories with experiment we can take two approaches. The first is to assume a form for the field dependence of the effective gap and then fit Eq. (3) or Eq. (4) to directly. The second is to solve Eq. (3) or Eq. (4) for at each field point and then compare to the expected behavior. We shall show both methods below.
In the usual mean-field BCS theory we expect
| (5) |
However, the observed rounding of the superconducting transition means that does not change discontinuously at and so a more appropriate expression is
| (6) |
This form of was used by Clayton et al.Clayton et al. (2002) to account for the effect of superconducting fluctuations, as it interpolating the mean field result at low field to the form expected for a strongly fluctuating system near . The phenomenological parameter sets the strength of the fluctuations. As it is not clear where the rounding of the superconducting transition in MgB2 is caused by fluctuations, we will regard as a phenomenological parameter which describes the rounding, rather than attributing to it for now any particular physical significance. In any case, the values of are mostly determined by the portion of the curve well below (i.e., the data for the higher values of ).
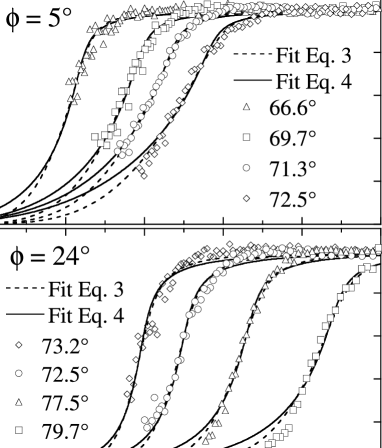
Combining Eq. 6 with either Eq. (3) or Eq. (4) results in 3 fitting parameters per curve (, and ). We found that in general there was too much covariance between the parameters to arrive at accurate values for if we allowed all three to vary between the fits at each angle. As we do not expect either or to vary strongly with we found that more consistent results were obtained by fitting to the data for at all angles simultaneously, only allowing to vary as a function of angle.
| Theory | |||
|---|---|---|---|
| Maki | 5∘ | 200 K | 55 |
| Maki | 24∘ | 320 K | 34 |
| Miyake | 5∘ | 32 K | 27 |
| Miyake | 24∘ | 60 K | 22 |
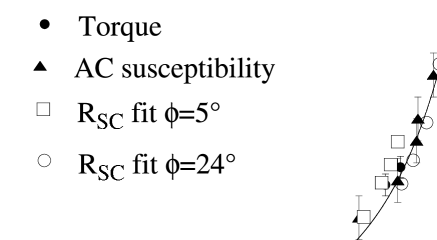
The fits obtained for both and are shown in Fig. 11. In these fits we have taken , i.e., assuming the band mass scales like the dHvA frequency.Mazin and Kortus (2002); mas The values of and and are shown in Table 1. It can be seen that both theories provide an adequate fit to the experimental data. The main difference is in the size of the extracted superconducting gap. As orbit 3 is on the electron like sheet of Fermi surface we should compare these values with the zero field value for the smaller MgB2 gap ( 29 K). Manzano et al. (2002) The Miyake fit gives values comparable to this whereas the Maki fit gives values up to 10 times larger. The trend is similar to that found for NbSe2. The values of are also somewhat larger in the Maki fits to those in the Miyake fits. The values of extracted from our fits are shown in Fig. 4. The values are very similar to those extracted from the background torque, consistent with our interpretation of our extrapolated as the bulk critical field for the band. There is a consistent difference in values for the two values of , with the values for being % higher than those for . This implies a slight in-plane anisotropy of .
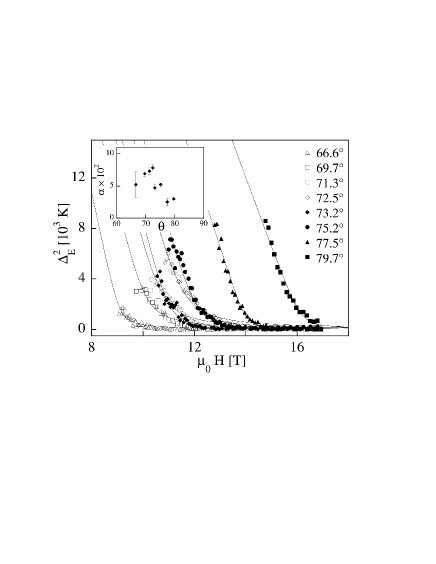
Although there is some ambiguity between the theories as to the magnitude of the gap, it is clear that a sizeable gap does exist on this sheet of Fermi surface right up to . There is some difference between the gap values derived from the data at the two in-plane rotation angles. We note that although there is a large difference between the gaps on the and Fermi surface sheets, the difference within a sheet (or indeed pair of sheets) is expected to be small.Mazin et al. (2004) One reason for this orientation dependence is that the data for cover a wider range of and hence, the extrapolated gap value is more accurate. For the runs with different where the values are close, the curves are very similar, and any difference results from the field range of the fit. Next, we show in Fig. 12 the field dependent effective gap calculated by inverting Eq. (3), along with fits to the field dependent gap given by Eq. (6). The main difference between using Eq. (4) rather than Eq. (3) is just in the magnitude of the extracted rather than its field dependence. In the fits we have fixed to 300 K for all values of and and allowed to vary. The curvature near and the approximately linear behavior of at lower field are evident. The covariance between the gap and mentioned above arises from the rounding at the transition and the small field range available at some angles. There is however a discernible progressive change in shape of the curves as and are varied. This is reflected in the angular dependence of in the inset to the figure. This may be an artifact of the data analysis but could also result from a two gap effect.
It is clear that the extrapolation to the zero field gap is not a trivial one as our data does not extend below 0.85. This is particularly significant in a material like MgB2, where non mean-field gap behavior is expected. Numerical calculationsGraser et al. (2004); Dahm of the field dependence of the energy gaps in MgB2 show that they differ considerably from the mean field behavior given by Eq. (5). Close to , for , we find that the numerical data can be approximated by . This accounts naturally for some (but not all) of the rounding in our plots. The steep drop of at low field found in the calculations means that a linear extrapolation from high field underestimates the true zero field gap by approximately 50%.
Recently, there has been further theoretical work on the dHvA effect in superconductors. Duncan and Györffy Duncan and Gyorffy (2003) have extended the work in Ref. Miller and Gyorffy, 1995 and given a new formula for . We have fitted our data to this formula and find fits that are comparable in quality to those in Fig. 11, with K, for . This is very close to the values calculated from the Maki formula [Eq. (3)]. Yasui and Kita Yasui and Kita (2002) have made a detailed numerical investigation of the approximations used in many of the other previous superconducting state dHvA theories. They proposed an equation for which should give quantitative values for the energy gap which can be compared to the actual thermodynamic values. Their expression for is
| (7) |
where is a numerically evaluated constant. This was shown to correctly describe the damping in Nb3Sn and NbSe2 with approximately equal to the actual superconducting energy gap. It can be seen that this is almost exactly the same as Maki’s formula, Eq. (3), except for a factor which equals 0.94 for T and T. Hence, the gap values extracted by fitting this formula are virtually identical to those from Eq. (3) i.e., up to 10 times larger then the gap values extracted by other means.
V Conclusions
In conclusion, we have made a detailed study of the attenuation of the dHvA signal in MgB2 as it enters the superconducting state. Only a single orbit on the electron-like band is observable. The data clearly show that a sizeable gap exists on this orbit even at high field. The transition from normal to superconducting states as seen in both the background magnetisation as well as the dHvA amplitude are rather broad, which may result from either fluctuation effects or a two-gap effect. The data provide a new test for theories of the dHvA effect in the superconducting state being applied for the first time to a material which clearly has two superconducting gaps.
Both the Miyake and the Maki theories fit the data well, although the Miyake theory produces gap values which are much closer to those expected from the low field data for the band. The most recent theoretical work Yasui and Kita (2002); Duncan and Gyorffy (2003) however, suggests that the Miyake theory should seriously overestimate the damping and that the Maki model should provide an accurate quantitative estimate of the average gap on the dHvA orbit. Our data is in serious disagreement with this as the gap values found from the Maki model fits are more than a factor 10 times larger than the expected zero field band gap. We conclude that the present theories of the dHvA effect in the superconducting state, when applied to MgB2, dramatically underestimate the damping.
VI Acknowledgments
We would like to thank J.R. Cooper, S.M. Hayden, B. Györffy and P.J. Meeson for useful discussions.
References
- Iavarone et al. (2002) M. Iavarone, G. Karapetrov, A. E. Koshelev, W. K. Kwok, G. W. Crabtree, D. G. Hinks, W. N. Kang, E. M. Choi, H. J. Kim, H. J. Kim, and S. I. Lee, Phys. Rev. Lett. 89, 187002 (2002).
- Bouquet et al. (2001) F. Bouquet, Y. Wang, R. A. Fisher, D. G. Hinks, J. D. Jorgensen, A. Junod, and N. E. Phillips, Europhys. Lett. 56, 856 (2001).
- Bouquet et al. (2002) F. Bouquet, Y. Wang, I. Sheikin, T. Plackowski, A. Junod, S. Lee, and S. Tajima, Phys. Rev. Lett. 89, 257001 (2002).
- Manzano et al. (2002) F. Manzano, A. Carrington, N. E. Hussey, S. Lee, A. Yamamoto, and S. Tajima, Phys. Rev. Lett. 88, 047002 (2002).
- Souma et al. (2003) S. Souma, Y. Machida, T. Sato, T. Takahashi, H. Matsui, S. C. Wang, H. Ding, A. Kaminski, J. C. Campuzano, S. Sasaki, and K. Kadowaki, Nature 423, 65 (2003).
- Tsuda et al. (2003) S. Tsuda, T. Yokoya, Y. Takano, H. Kito, A. Matsushita, F. Yin, J. Itoh, H. Harima, and S. Shin, Phys. Rev. Lett. 91, 127001 (2003).
- Shen et al. (1965) L. Y. L. Shen, N. M. Senozan, and N. E. Phillips, Phys. Rev. Lett. 14, 1025 (1965).
- Binnig et al. (1980) G. Binnig, A. Baratoff, H. E. Hoenig, and J. G. Bednorz, Phys. Rev. Lett. 45, 1352 (1980).
- Kortus et al. (2001) J. Kortus, I. I. Mazin, K. D. Belashchenko, V. P. Antropov, and L. L. Boyer, Phys. Rev. Lett. 86, 4656 (2001).
- Liu et al. (2001) A. Y. Liu, I. I. Mazin, and J. Kortus, Phys. Rev. Lett. 8708, 087005 (2001).
- Choi et al. (2002) H. J. Choi, D. Roundy, H. Sun, M. L. Cohen, and S. G. Louie, Nature 418, 758 (2002).
- Carrington and Manzano (2003) A. Carrington and F. Manzano, Physica C 385, 205 (2003).
- Gonnelli et al. (2002) R. S. Gonnelli, D. Daghero, G. A. Ummarino, V. A. Stepanov, J. Jun, S. M. Kazakov, and J. Karpinski, Phys. Rev. Lett. 89, 247004 (2002).
- Szabo et al. (2001) P. Szabo, P. Samuely, J. Kacmarcik, T. Klein, J. Marcus, D. Fruchart, S. Miraglia, C. Marcenat, and A. G. M. Jansen, Phys. Rev. Lett. 87, 137005 (2001).
- Graser et al. (2004) S. Graser, T. Dahm, and N. Schopohl, Phys. Rev. B 69, 014511 (2004).
- (16) T. Dahm, (Private communication).
- Daghero et al. (2003) D. Daghero, R. S. Gonnelli, G. A. Ummarino, V. A. Stepanov, J. Jun, S. M. Kazakov, and J. Karpinski, Physica C 385, 255 (2003).
- Bugoslavsky et al. (2003) Y. Bugoslavsky, Y. Miyoshi, G. Perkins, A. Caplin, L. Cohen, A. Pogrebnyakov, and X. Xi (2003), cond-mat/0307540.
- Gonnelli et al. (2003) R. Gonnelli, D. Daghero, A. Calzolari, G. Ummarino, V. Dellarocca, V. Stepanov, J. Jun, S. Kazakov, and J. Karpinski (2003), cond-mat/0308152.
- Corcoran et al. (1994a) R. Corcoran, P. Meeson, Y. Onuki, P. A. Probst, M. Springford, K. Takita, H. Harima, G. Y. Guo, and B. L. Gyorffy, J. Phys.-Condes. Matter 6, 4479 (1994a).
- Corcoran et al. (1994b) R. Corcoran, N. Harrison, S. M. Hayden, P. Meeson, M. Springford, and P. J. Vanderwel, Phys. Rev. Lett. 72, 701 (1994b).
- Harrison et al. (1994) N. Harrison, S. M. Hayden, P. Meeson, M. Springford, P. J. Vanderwel, and A. A. Menovsky, Phys. Rev. B 50, 4208 (1994).
- Clayton et al. (2002) N. J. Clayton, H. Ito, S. M. Hayden, P. J. Meeson, M. Springford, and G. Saito, Phys. Rev. B 65, 064515 (2002).
- Heinecke and Winzer (1995) M. Heinecke and K. Winzer, Z. Phys. B-Condens. Mat. 98, 147 (1995).
- Settai et al. (2001) R. Settai, H. Shishido, S. Ikeda, Y. Murakawa, M. Nakashima, D. Aoki, Y. Haga, H. Harima, and Y. Onuki, J. Phys.-Condes. Matter 13, L627 (2001).
- Inada et al. (1999) Y. Inada, H. Yamagami, Y. Haga, K. Sakurai, Y. Tokiwa, T. Honma, E. Yamamoto, Y. Onuki, and T. Yanagisawa, J. Phys. Soc. Jpn. 68, 3643 (1999).
- Ohkuni et al. (1999) H. Ohkuni, Y. Inada, Y. Tokiwa, K. Sakurai, R. Settai, T. Honma, Y. Haga, E. Yamamoto, Y. Onuki, H. Yamagami, S. Takahashi, and T. Yanagisawa, Philos. Mag. B-Phys. Condens. Matter Stat. Mech. Electron. Opt. 79, 1045 (1999).
- Bergemann et al. (1997) C. Bergemann, S. R. Julian, G. J. Mcmullan, B. K. Howard, G. G. Lonzarich, P. Lejay, J. P. Brison, and J. Flouquet, Physica B 230, 348 (1997).
- Hedo et al. (1995) M. Hedo, Y. Inada, T. Ishida, E. Yamamoto, Y. Haga, Y. Onuki, M. Higuchi, and A. Hasegawa, J. Phys. Soc. Jpn. 64, 4535 (1995).
- Shoenberg (1984) D. Shoenberg, Magnetic Oscillations in Metals (Cambridge University Press, Cambridge, 1984).
- Wasserman and Springford (1994) A. Wasserman and M. Springford, Physica B 194, 1801 (1994).
- Harima (2002) H. Harima, Physica C 378, 18 (2002).
- Rosner et al. (2002) H. Rosner, J. M. An, W. E. Pickett, and S. L. Drechsler, Phys. Rev. B 66, 024521 (2002).
- Mazin and Kortus (2002) I. I. Mazin and J. Kortus, Phys. Rev. B 65, 180510 (2002).
- Yelland et al. (2002) E. A. Yelland, J. R. Cooper, A. Carrington, N. E. Hussey, P. J. Meeson, S. Lee, A. Yamamoto, and S. Tajima, Phys. Rev. Lett. 88, 217002 (2002).
- Carrington et al. (2003) A. Carrington, P. J. Meeson, J. R. Cooper, L. Balicas, N. E. Hussey, E. A. Yelland, S. Lee, A. Yamamoto, S. Tajima, S. M. Kazakov, and J. Karpinski, Phys. Rev. Lett. 91, 037003 (2003).
-
(37)
ThermoMicroscopes, Sunnyvale, California.
http:
www.thermomicro.com. - Cooper et al. (2003) J. R. Cooper, A. Carrington, P. J. Meeson, E. A. Yelland, N. E. Hussey, L. Balicas, S. Tajima, S. Lee, S. M. Kazakov, and J. Karpinski, Physica C 385, 75 (2003).
- Karpinski et al. (2003) J. Karpinski, M. Angst, J. Jun, S. M. Kazakov, R. Puzniak, A. Wisniewski, J. Roos, H. Keller, A. Perucchi, L. Degiorgi, M. R. Eskildsen, P. Bordet, L. Vinnikov, and A. Mironov, Supercond. Sci. Technol. 16, 221 (2003).
- Hao and Clem (1991) Z. D. Hao and J. R. Clem, Phys. Rev. B 43, 7622 (1991).
- Angst et al. (2002) M. Angst, R. Puzniak, A. Wisniewski, J. Jun, S. M. Kazakov, J. Karpinski, J. Roos, and H. Keller, Phys. Rev. Lett. 88, 167004 (2002).
- Angst et al. (2003) M. Angst, R. Puzniak, A. Wisniewski, J. Roos, H. Keller, P. Miranovic, J. Jun, S. M. Kazakov, and J. Karpinski, Physica C 385, 143 (2003).
- Rydh et al. (2003) A. Rydh, U. Welp, J. M. Hiller, A. E. Koshelev, W. K. Kwok, G. W. Crabtree, K. H. P. Kim, K. H. Kim, C. U. Jung, H. S. Lee, B. Kang, and S. I. Lee, Phys. Rev. B 68, 172502 (2003).
- Terashima et al. (1997) T. Terashima, C. Haworth, H. Takeya, S. Uji, H. Aoki, and K. Kadowaki, Phys. Rev. B 56, 5120 (1997).
- Janssen et al. (1998) T. J. B. M. Janssen, C. Haworth, S. M. Hayden, P. Meeson, M. Springford, and A. Wasserman, Phys. Rev. B 57, 11698 (1998).
- Goll et al. (1996) G. Goll, M. Heinecke, A. G. M. Jansen, W. Joss, L. Nguyen, E. Steep, K. Winzer, and P. Wyder, Phys. Rev. B 53, R8871 (1996).
- Carrington and Fletcher (2004) A. Carrington and J. Fletcher (2004).
- Boaknin et al. (2003) E. Boaknin, M. A. Tanatar, J. Paglione, D. Hawthorn, F. Ronning, R. W. Hill, M. Sutherland, L. Taillefer, J. Sonier, S. M. Hayden, and J. W. Brill, Phys. Rev. Lett. 90, 117003 (2003).
- V. Guritanu et al. (2004) V. V. Guritanu, W. Goldacker, F. Bouquet, Y. Wang, R. Lortz, G. Goll, and A. Junod (2004), cond-mat/0403590.
- Yasui and Kita (2002) K. Yasui and T. Kita, Phys. Rev. B 66, 184516 (2002).
- Maki (1991) K. Maki, Phys. Rev. B 44, 2861 (1991).
- Brandt et al. (1967) U. Brandt, W. Pesch, and L. Tewordt, Z. Phys 201, 209 (1967).
- Stephen (1992) M. J. Stephen, Phys. Rev. B 45, 5481 (1992).
- Miyake (1993) K. Miyake, Physica B 188, 115 (1993).
- Miller and Gyorffy (1995) P. Miller and B. L. Gyorffy, J. Phys.-Condes. Matter 7, 5579 (1995).
- (56) This scaling is found both experimentally and in band-structure calculations Harima (2002).
- Mazin et al. (2004) I. I. Mazin, O. K. Andersen, O. Jepsen, A. A. Golubov, O. V. Dolgov, and J. Kortus, Phys. Rev. B 69, 056501 (2004).
- Duncan and Gyorffy (2003) K. P. Duncan and B. L. Gyorffy, J. Phys.-Condes. Matter 15, 239 (2003).