[
DNA-condensation, redissolution and mesocrystals induced by tetravalent counterions
Abstract
The distance-resolved effective interaction potential between two parallel DNA molecules is calculated by computer simulations with explicit tetravalent counterions and monovalent salt. Adding counterions first yields an attractive minimum in the potential at short distances which then disappears in favor of a shallower minimum at larger separations. The resulting phase diagram includes a DNA-condensation and redissolution transition and a stable mesocrystal with an intermediate lattice constant for high counterion concentration.
PACS: 87.15.Kg, 61.20Ja, 82.70.Dd, 87.10+e
]
Multivalent polyamines such as trivalent spermidine (Spd) and tetravalent spermine (Spe) are abundant in living cells and play a key role in maintaining cellular DNA in a compact state [1, 2, 3]. They modulate ion channel activities of cells and are essential for normal cell growth. Polyamines also facilitate the packaging of DNA in certain viruses. The implications can effectively be applied in gene delivery and in the field of genetic therapy. Under physiologic ionic and pH conditions, the polyamines are positively charged and hence DNA is their prime target of interaction.
In the last decade different experiments have shown a condensation and a subsequent redissolution of DNA for increasing polyamine concentration [3, 4, 5, 6, 7, 8, 9]. The condensation and redissolution occur at concentrations and respectively. Between these two thresholds, for , there is a coexistence of a liquid-like dense DNA phase and a very dilute DNA solution. Several theoretical explanations have been presented for the condensation based on counterion-induced attractions between the DNA molecules [1, 3, 10, 11, 12, 13, 14, 15]. However, the origin of the experimentally found redissolution transition [10, 16] is not understood on a molecular level. Proposed mechanisms range from an increased DNA-hydrophilicity induced by polyamine bindings [5] to Bjerrum pair condensation [6, 7, 17] formed by multivalent counter- and monovalent coions and DNA-overcharging [11].
In this letter we investigate the condensation and redissolution of DNA on a molecular level by using primitive-model computer simulations with explicit tetravalent counterions and monovalent salt ions. We trace back the condensation and redissolution to the attractions in the distance-dependent effective potential between two parallel DNA molecules with denoting the radial distance between their two centers. In fact, the depth and position of the attractive minimum play a crucial role in whether there is liquid-gas-like phase separation. For monovalent microions, the interaction is repulsive [18]. For increasing tetravalent counterion concentration , an attractive minimum in at small separations shows up which then disappears in favor of a shallower minimum at larger separations . Using two-dimensional liquid-state theory for the fluid and lattice sums for the solid phases, we calculate the phase diagram for columnar DNA assemblies. It includes the DNA-condensation and redissolution transition and the associated threshold concentrations and are in agreement with the experimental data. For high concentrations mM, we predict a stable hexagonal mesocrystal with an intermediate lattice constant which can coexist either with a dense hexagonal crystal or a dilute solution.
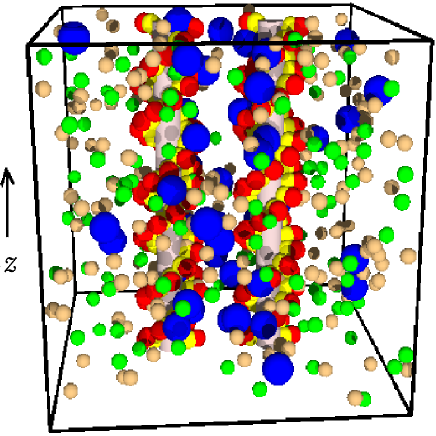
In our computer simulations, we consider B-DNA molecules which form a double helix with a pitch length of =34Å and =20 phosphate charges per pitch using the realistic groove-geometry and charge pattern of the Montoro-Abascal model (MAM) [19, 20]. A single DNA molecule or a pair of parallel DNA molecules, which are oriented in the z direction, are placed on the xy diagonal of a cubic simulation box of length which is three times the pitch length. The box also contains tetravalent ions, monovalent coions and monovalent counterions [21]. Here is the number of added salt ion pairs, and is fixed by the DNA charge due to the constraint of global charge neutrality; for a single DNA and for two DNA molecules in the box. All ions are modelled as charged hard spheres with denoting the diameter of the tetravalent counterions. All diameters of the monovalent microions are assumed to be equal and we choose them to be =4Å. Hereafter we shall call the tetravalent counterions spermine (Spe) since experimental data support the idea that it is the charge of a counterion, rather than its structural specificities, which is important in DNA condensation and recondensation processes.
Periodic boundary conditions in all three directions are applied. The whole system is held at room temperature and the water is modelled as a continuous dielectric medium with . The interaction potentials between the different particle species are a combination of hard core and Coulomb potentials. We have performed extensive grand canonical molecular dynamics (GCMD) simulations, as described in Ref. [22], for a range of different Spe and salt concentrations. A typical configurational snapshot in the simulation box is shown in Figure 1.
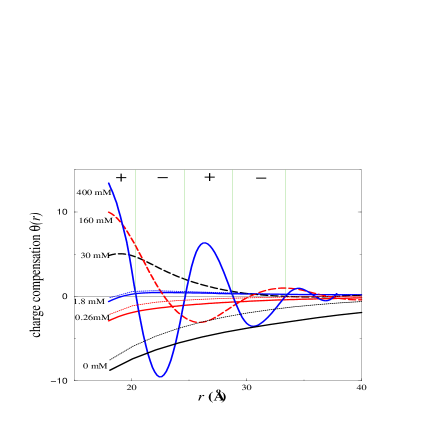
First we consider a single DNA molecule in the simulation box. It is known that, in the presence of multivalent ions, the ionic cloud may not only compensate the polyion charge, but even exceed it, resulting in an opposite values of the electrostatic potential at some distances [17]. The charge compensation parameter of DNA phosphate charges, defined as
| (1) | |||
| (2) |
accounts for the integrated total charge at distance away from the DNA axis. Here are radial ion charge densities per pitch length and is the elementary charge. Data for , often called a distance dependent effective DNA charge, are plotted in Figure 2 for different Spe and salt densities.
For dense Spe concentrations a layered structure appears in due to the bulk charge-density oscillations in strong electrolytes [23]. The simulations reveal qualitatively different types of competition between the Spe and salt ions on the DNA surface depending on whether the DNA is overcharged or not. We find that, at a constant salt density condition and for 1.8mM (undercharged DNA case), the added Spe ions replace the small counterions on the DNA surface. For Spe concentration 1.8mM (overcharged DNA) i) the influence of salt on the parameter diminishes, in other words, once the DNA is overcharged, it reluctantly responds to added salt, ii) the number of condensed counterions remains constant, the total adsorbed ionic charge in DNA grooves remains constant. It is only the strand ionic charge which increases gradually as more Spe is added to solution. Thus, the DNA overcharging emerges mainly due to the excess Spe charge adsorbed on the DNA phosphate strands.
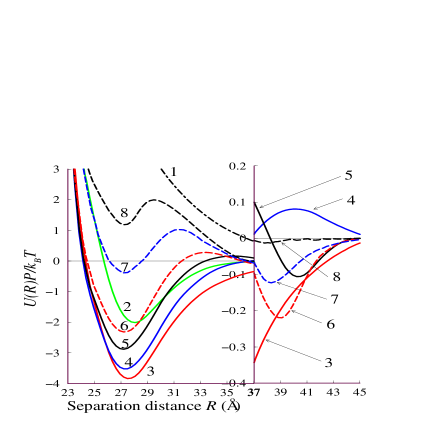
The rest of this letter is devoted to the question, how the overcharged DNA and the alternating charge layers affect the interaction between two DNA molecules. To reveal this impact, we calculate the total effective pair interaction potential per unit length for a given bulk salt concentration and different Spe concentrations . The quantity is gained by integrating the distance-resolved interaction force averaged over all microion configurations [24]. Results are shown in Figure 3. It is seen that even a small trace of spermine ions - well below the overcharging threshold - induces an attraction between the DNA molecules, except at very close distances, see curve (2) for =0.1mM. This attraction has mainly a pure electrostatic origin and arises due to charge correlations in the electrolyte. For increasing , this (first) minimum is getting deeper and is achieving a maximal depth at the overcharging concentration mM. There the minimum is mainly resulting from entropic forces, i.e. from layering in the Spe number density. Further increasing , again reduces the depth of the first minimum. The position of the first minimum, on the other hand, hardly depends on . The combined Spe-layering around the pair of DNA molecules induces a second minimum at larger separations as revealed in the enlarging inset of Figure 3. This minimum is of electrostatic origin and occurs for mM. Again the depth of the second minimum increases and decreases with . At intermediate Spe concentrations, we are thus confronted with a double minimum potential which is induced by layering. Bearing in mind that the potentials in Figure 3 are scaled for one DNA pitch length, very long DNA molecules may easily collapse into the minimum of curve (2). This implies that DNA aggregation can take place well below overcharging Spe concentrations.
The characteristic double-minimum structure of the interaction potential will give rise to unusual phase behavior. We have calculated the phase diagram of a columnar DNA assembly on the basis of our simulated effective pair interactions. We assume that the DNA molecules are parallel along a certain length . This length is an additional parameter which we fix to be . We comment on the dependence of the phase diagram on later. The assembly of parallel DNA can be considered as a two-dimensional many-body system interacting via and being characterized by a DNA particle number density . We calculated the free energies of the fluid and solid phases by using different techniques outlined below and perform the traditional Maxwell double tangent to identify the coexisting densities.
The free energy of dilute fluid phase is approximated by the two-dimensional perturbation theory according to Weeks, Chandler and Anderson [25]. The total potential is split into a repulsive part and a an attractive part . The former is identical to but truncated and shifted towards zero at the first minimum at . This repulsive potential is then mapped onto that of effective hard disks of diameter using the Barker-Henderson formula [26] . Here the cross-section diameter for the DNA molecule is . The total Helmholtz free energy involves that of a hard disk fluid with effective area fraction and a mean-field correction which we simply model as . For the former quantity analytical expressions are available [27]. The free energy of the solid phase, on the other hand, is calculated by a lattice sum assuming a two-dimensional triangular lattice as a possible candidate structure. The lattice constant is directly related to the DNA number density .
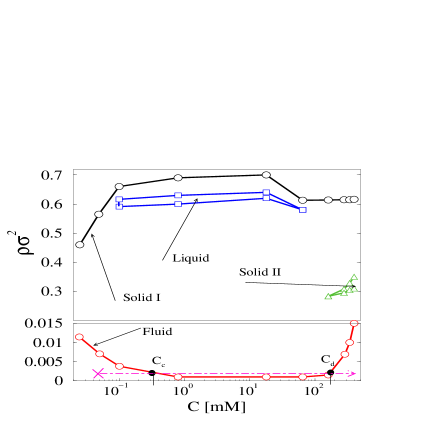
The resulting phase diagram with the coexisting DNA densities is shown in Figure 4 for the whole range of Spe concentrations . At low there is a strong first-order fluid-crystal phase transition. Increasing widens the coexistence region considerably due to the increasing attractions. Above a threshold concentration of mM there is enough attraction to stabilize a liquid phase of high DNA density. The stability of the liquid ceases at mM. At even higher Spe concentrations a second crystal with a considerable smaller lattice constant than that of the high-density solid emerges. We call this novel phase a mesocrystal since its density is intermediate between that of the fluid and the other almost closed-packed solid.
Another implication of the phase diagram is the condensation and subsequent redissolution. Let us start at small with a dilute DNA solution (see the cross in Figure 4) and increase (dot-dashed line in Figure 4). We keep fixed to which corresponds to a typical DNA concentration of 1mg/ml DNA. First the fluid-liquid coexistence line is hit, which implies that the system will split into a low density fluid and a high density liquid which is the condensation transition. At much higher the coexistence line is touched again and the system redissolutes back into the dilute fluid phase. The corresponding threshold concentrations of the condensation and redissolution are in the range mM and mM and agree well with the experimental findings [10, 4].
Let us finally comment on the dependence of the phase diagram on the DNA length . Since is a prefactor of the effective potential it plays formaly the role of an inverse system temperature. We have explored the phase behaviour for smaller DNA segment lengths of and for larger . As a result, the stability of liquid pocket depends sensibly on : it disappers completely for small but extends towards larger for larger . The second feature concerns the fluid coexistence density: it shifts to considerably higher values for smaller . Hence, condensation and redissolution is prohibited for small DNA-segment lengths This is in line with the experiments of Ref. [28] where a threshold value of for the minimal length required for condensation is reported.
In conclusion, we have calculated the influence of tetravalent counterions on the effective interaction and the phase diagram of columnar DNA assemblies by primitive-model-type computer simulations and statistical theories. We find that a small concentration of tetravalent counterions induces DNA condensation. The layering of the strongly coupled tetravalent counterions to the DNA strands yields an oscillatory effective interaction potential with a double minimum structure at intermediate counterion concentrations. This explains the redissolution transition and triggers a novel stable mesosolid. Our threshold concentrations are in good agreement with experimental data.
Future work should address the phase behaviour of DNA solutions which are polydisperse in their length on the basis of the effective interaction found in this paper. Furthermore it would be interesting to explore the stability of a cholesteric phase [3, 4, 5, 6, 7] based on an effective interaction which incorporates the relative orientation of the two DNA molecules.
Acknowledgments: We acknowledge discussions with R. Blossey. Financial support from DFG within LO 418/9 is acknowledged.
REFERENCES
- [1] V. A. Bloomfield, Biopolymers 44, 269 (1997).
- [2] S. S. Cohen, A Guide to Polyamines, Oxford University Press, New-York, NY, 1998.
- [3] M. Saminathan, T. Thomas, A. Shirahata, C. K. S. Pillai, T. J. Thomas, Nucleic Acids Research 30, 3722 (2002).
- [4] J. Pelta, F. Livolant, J.-L. Sikorav, J. Biological Chemistry 271, 5656 (1996); J. Pelta. D. Durand, J.Doucet, F. Livolant, Biophys. J. 71, 48 (1996).
- [5] M. Saminathan, T. Antony, A. Shirahata, L. H. Sigal, T. Thomas, T. J. Thomas, Biochemistry 38, 3821 (1999).
- [6] F. J. Solis, M. O. De la Cruz, Eur. Phys. E. 4, 143 (2001).
- [7] F. J. Solis, J. Chem. Phys. 117, 9009 (2002).
- [8] R. de Vries, Biophys. J. 80, 1186 (2001).
- [9] Y. Murayama, Y. Sakamaki, M. Sano, Phys. Rev. Letters 90, 018102-1 (2003).
- [10] E. Raspaud, I. Chaperon, A. Leforestier, F. Livolant, Biophys. J. 77, 1547 (1999); E. Raspaud, M. Olvera, M. O. de la Cruz, J.-L. Sikorav, F. Livolant, Biophys. J. 74, 381 (1998).
- [11] T. T. Nguyen, I. Rouzina, B. I. Shklovskii, J. Chem. Phys. 112, 2562 (2000); T. T. Nguyen, B. I. Shklovskii, J. Chem. Phys, 115, 7298 (2001).
- [12] V. A. Bloomfield, Curr. Opin. Struct. Biol. 6, 334 (1996).
- [13] Y. Burak, G. Ariel, D. Andelman, Biophys. J. 85, 2100 (2003).
- [14] P. G. Arscott, A.-Z. Li, V. A. Bloomfield, Biopolymers 29, 619 (1990).
- [15] F. J. Solis, M. O. De la Cruz, J. Chem. Phys 112, 2030 (2000).
- [16] V. S. Trubetskoy, J. A. Wolff, V. G. Budker, Biophys. J. 84, 1124 (2003).
- [17] M. Tanaka, A. Yu. Grosberg, J. Chem. Phys. 115, 567 (2001).
- [18] E. Allahyarov, H. Löwen, Phys. Rev. E 62, 5542 (2000).
- [19] J. L. F. Abascal, J. C. G. Montoro, J. Chem. Phys. 114, 4277 (2001).
- [20] E. Allahyarov, H. Löwen, G. Gompper, Phys. Rev. E. 68, 061903 (2003).
- [21] Here, ions with the same valency are treated as indistinguishable. For example, counterions that neutralize the DNA charge are indistinguishable from salt counterions.
- [22] E. Allahyarov, G. Gompper, H. Löwen, Phys. Rev. E. 69, 0419XX-1 (2004).
- [23] P. Attard, Adv. Chem. Phys. 92, 1 (1996); J. Phys. Chem. 99, 14174 (1995).
- [24] E. Allahyarov, I. D’Amico, H. Löwen, Phys. Rev. Letters 81, 1334 (1998).
- [25] J. D. Weeks, D. Chandler, H. C. Andersen, J. Chem. Phys. 54, 5237 (1971).
- [26] R. Evans, Liquids at Interfaces, Les Houches, p.30 (1988).
- [27] A. Santos, M. Lopez de Haro, S. Bravo Yuste, J. Chem. Phys. 103, 4622 (1995).
- [28] R. Goobes, O. Cohen, A. Minsly, Nucleic Acids Research 30, 2154 (2002).