Rotation-induced 3D vorticity in 4He superfluid films adsorbed on a porous glass
Abstract
Detailed study of torsional oscillator experiments under steady rotation up to 6.28 rad/sec is reported for a 4He superfluid monolayer film formed in 1 m-pore diameter porous glass. We found a new dissipation peak with the height being in proportion to the rotation speed, which is located to the lower temperature than the vortex pair unbinding peak observed in the static state. We propose that 3D coreless vortices (”pore vortices”) appear under rotation to explain this new peak. That is, the new peak originates from dissipation close to the pore vortex lines, where large superfluid velocity shifts the vortex pair unbinding dissipation to lower temperature. This explanation is confirmed by observation of nonlinear effects at high oscillation amplitudes.
pacs:
67.40.Vs, 67.57.Fg, 67.70.+n, 67.40.RpSuperfluid 4He films adsorbed in porous media provide unique possibility to study the interplay between 2D and 3D physicsRp . Especially for the superfluid transition, the system shows similar behavior to the 2D film (the Kosterlitz-Thouless transitionKT ) such as the density proportional superfluid transition temperatute , with the energy dissipaton peak around Rp ; Shir ; KW ; Gabor ; Mikhin . Whereas the superfluid density critical index is found close to Rp of 3D system and a sharp cusp of the specific heatMurphy appearing around , which is similar to the transition of the bulk 4He.
A crucial role in the Kosterlitz -Thouless 2D transition belongs to thermally excited vortex-antivortex pairs (VAPs). Also for the transition of the 3D system, a similar mechanism is proposed where the vortex rings play the important roleGW . However, multiple connectivity of the superfluid film in porous media allows a variety of vortex configurations other than VAP, e.g., vortex rings and 3D coreless pore vortices Min ; Mahta ; GW ; OK . Therefore one may expect that the response of the film on a porous substrate would be essentially different from that on a plane substrate, and observation under rotation should be quite interesting for understanding the role of these vortices on the superfluid transition.
An effective experimental method to study superfluidity of films, both on a plane and on a porous substrate, is the torsional oscillator technique (TO)Rpflt . The vortex dynamics of 2D films, which is probed in torsional oscillator experiments, was developed by Ambegaokar, Halperin, Nelson and Siggia (AHNS)AHNS . The theory and the experiment revealed that close to the critical temperature, the VAPs give a rise to a dissipation peak, where VAPs start to dissociate and free vortices appear according to the AHNS theoryAHNS . The vortices in the superfluid film are created by thermal fluctuations and therefore their number is strongly temperature-dependent and also depends on parameters which are difficult to measure or estimate independently. On the other hand, rotation with the angular velocity produces free vortices with temperature-independent areal density ( is 4He circulation quantum), and this makes the dynamical properties easier for the analysis. Adams and GlabersonAdGl have shown experimentally that rotation-induced vortices in the plane superfluid film responsible for essential dissipation at low temperature side of dissipation, where the density of thermally created vortices is negligible and dissipation is not detectable without rotation. They obtained valuable information on 2D vortex diffusivity from the low-temperature dissipation tail under the rotation.
We investigate monolayer superfluid films covering a 1m-pore porous-glass substrateKubota under rotation by the TO technique. We have chosen the porous glass with this pore diameter because of the clear thin film feature of He and apparent 3D connectivity. Namely He atom de Broglie wave length is much smaller than the pore diameter under the conditions of present study and our situation is closely connected to the one considered by theoretical works for thin filmsMin ; Mahta ; OK . The 2D superfluid density (per unit area) is derived from the period change of the oscillation, while the information about the vortex dynamics is obtained from the dissipation, characterized by the change of the quality factor . Traditionally the response of the superfluid film in the TO experiment is described by the “dielectric permeability” , which is the ratio of the effective mass of the superfluid component participating in the oscillation to the total, or “bare” superfluid mass. Then , where M is the total superfluid mass of the film of area and MTO is the oscillator’s effective mass.
The design and performance of the rotating dilution refrigerator used were reported previouslyrotref . It can be rotated with the angular velocity up to 6.28 rad/sec, while temperature of the mixing chamber is controlled in the range, 50 mK-2 K. A magnetic seal unit connects the cryostat with the stationary gas handling system and provides continuous operation during rotation. Be-Cu TO (f=477Hz, quality factor Q100mK=106) with the stack of the porous glass disks (diameter =15 mm, total height 9 mm)is mounted below the mixing chamber through a vibrational isolation scheme.
After studying superfluid density (period shift) and dissipation (Q value) from the lowest temperature to above , TO is cooled down to 0.95, where is the superfluid onset temperature determined in the same manner as in Shir , then rotation of the cryostat at angular velocity 0 6.28rad/sec is started and period and amplitude of the TO are recorded while the temperature is slowly swept up to T=1.05 during 20 hours for each . This procedure provides reproducibility of period and amplitude data of the TO. In order to calculate the level of the background is measured before this measurement cycle and is subtracted from the data, which are shown in Fig. 1. Each curve in the upper frame represents near the superfluid transition under rotation with the angular velocities from 0.79 to 6.28 rad/sec.
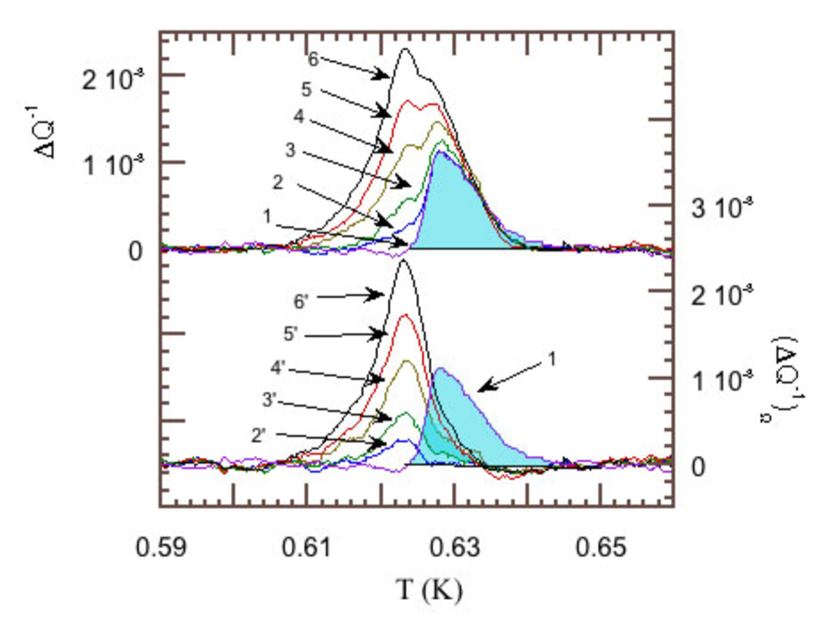
The location of the static peak in comparison to the superfluid density is different from flat film caseShir . Namely it is located at higher temperature than rapid change in superfluid density occurrs. The period shift curves are found to be common for the data in static state and under rotation, i.e., there was no detectable change in under rotation in this angular velocity range (Fig.2). Under rotation two pronounced features of dissipation were detected, which are dramatically different from the response of flat films to rotation:
-
1.
There was no low-temperature tail of dissipation, which characterized the response of the flat film to rotation AdGl . Instead a sharp cut-off of dissipation at the low temperature side of the peak was observed.
-
2.
The double-peak structure of the dissipation was revealed with sharp peaks at constant temperatures.
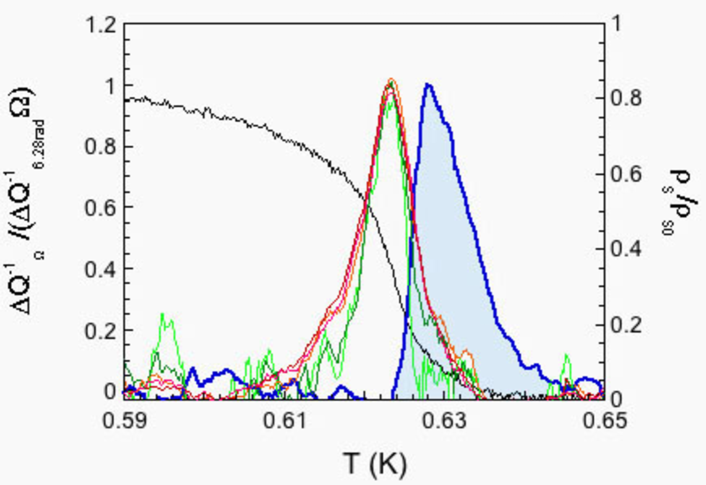
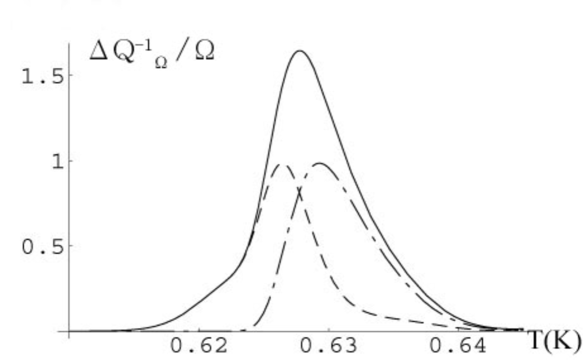
A peak, which is seen on the right (high T) side of rapid change of superfluid density in Fig. 2, is present even in the static state, =0. The other (left) one, which is found only under rotation, grows proportionally to the rotation speed,. And the peak is located at a constant temperature about below , where no excess dissipation was detected when =0. In order to demonstrate that rotation really produces a new dissipation peak , Fig. 2 shows the rotation-induced dissipation peaks , where the contribution of the static state was subtracted from the total dissipation, as a function of temperature. Then rotation induced peaks were scaled (divided) by and =6.28 rad/sec. They collapse on the same curve except for low temperature ends, which are worth of more careful analysis. The half width of the rotational peak is about 1%.
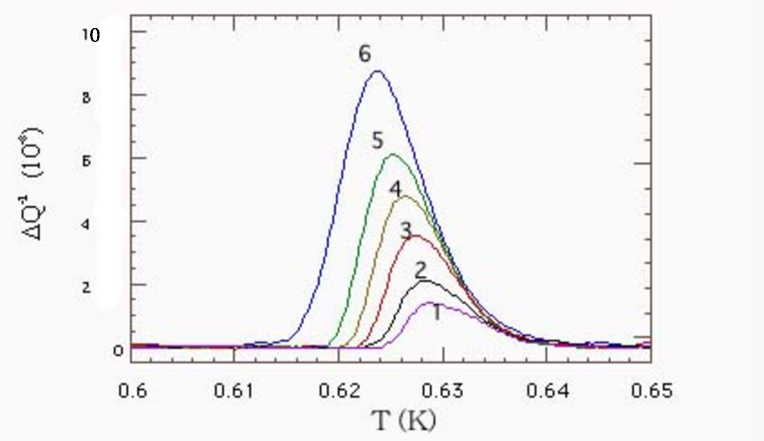
The amplitude of the torsional oscillation, used for the recording of the data in Fig. 1, corresponds to the drive AC velocity of the TO VAC =0.03 cm/sec, which is an average velocity calculated from the oscillator dimensions and it is in the linearly responding region. We have also measured dissipation peaks at a wide range of AC amplitude under static as well as under rotation conditions. Fig. 3 presents the peaks under staticcondition at the range of drive AC velocity, 0.09 cm/V 0.9 cm/. The non-linear effect becomes pronounced above V cm/sec.
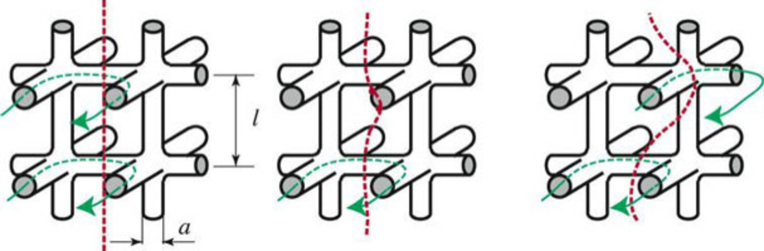
Now, we shall utilize these nonlinear response data in explaining the rotational dissipation peak. We model the porous medium with the “jungle gym” structureMin , which is a 3D cubic lattice of intersecting cylinders of diameter with period (Fig. 4). If this structure is a substrate for a superfluid film, multiple connectivity allows a new type of vortices, which is impossible in a flat single connected film: a 3D vortex without a 2D core, i.e., without any phase singularity in the film. The position of vortex line is confined within the pores around which there is a superfluid velocity circulation. Vortex motion is possible as a creep process, when the vortex line shifts from one pore to another by crossing cylinders. Crossing of a cylinder means creation of a VAP in the film, which covers this cylinder, as shown in Fig. 4.
If the vortex line moves on distances much larger than the structure-cell size one may describe the vortex motion by a continuous displacement of the vortex line. But for small-amplitude oscillations the position-vector has a poor physical meaning, because it can be defined only with accuracy of the structure period . In practice this means that the vortex is locked at some chain of pores by “intrinsic pinning” (a concept suggested for vortices in layered superconductors). However, if the vortex line cannot move, the question arises, how it is possible to detect its presence at all. We argue that though the 3D vortex lines cannot move themselves once 3D coherence is established, they can influence the gas of VAPs, and the rotation experiment reveals this influence. This immediately explains the first feature of the rotation response: no low-temperature dissipation. Indeed, an essential number of VAPs is possible only close to the transition temperature. Since one can notice the rotation-induced vortex lines only via their effect on VAPs, one can reveal the presence of locked 3D coreless vortices also only at high temperatures where 2D VAPs are present.
In order to explain the second feature of the rotation response (the double-peak structure), we shall consider the effect of circular currents around the 3D vortices on the VAP dissipation. At the highest rotation speed rad/sec, the average inter-3D vortex distance is . This means that the 3D vortices are well separated: is about 90 times larger than under rotations in question. As a result of it, the 3D-vorticity generated superfluid velocity relative to the substrate is effectively zero except for the regions close to the 3D vortex centers. For each 3D vortex, the length of the squares of cylinders surrounding the center is . Here is of the closest square to the center, is of the 2nd closest one, etc. The superfluid velocity for the circulation in the -th closest square is then . (As goes larger, the circulation changes to circular from square. Here we neglect this change because it changes only by a numerical factor.) Here we assume , which gives reasonable aspect ratio seen from SEMKubota and STM observations. For , we obtain [cm/s], [cm/s], [cm/s], [cm/s], [cm/s], and so on.
Assuming that these circular flows around vortex lines produce the same effect on dissipation as large amplitude AC flows, we shall utilize corresponding large amplitude AC dissipation data in Fig. 3 respectively at [cm/s], [cm/s], [cm/s] and [cm/s] for : The rotational dissipation mainly comes from the nonlinear dissipation of VAPs in with of the 3D vortices;
| (1) | |||||
where are data from Fig. 3 for , is the substrate surface area in the -th closest square and is the total substrate area per single vortex. The prefactor takes when is measured by radian per second. Then, the height of has turned to be
| (2) |
with in . This value is times smaller than the experimental one, although the peak position at [K] is in good agreement with the experiment (a little bit higher than the experimental one). In Fig. 5, the rotation-induced dissipation multiplied by this correction is plotted along with the dissipation of the static state, which looks similar to the experimental one shown in Fig.2. The total dissipation should be a simple sum of these two dissipations. But the double-peak structure, which one can see in the experimental curve in Fig. 1, would appear in the calculated total dissipation only if the calculated rotation dissipation peak were narrower. Altogether, this means that our model based on using the experimental data on large-amplitude AC dissipation yields the rotation dissipation peak in 10 times lower in height and somewhat narrower than the experimental one. This disagreement does not look discouraging bearing in mind complicated geometry for AC and DC external flows. One of the reasons why our model predicts a weaker dissipation is because the large-amplitude AC flows change its direction every period and it should weaken their effect on dissipation comparing with static circular flows generated by 3D vorticity.
In conclusion, we demonstrated the existence of an additional dissipation peak whose height changes proportionally to the rotation speed in the torsional-oscillator experiment with submonolayer superfluid 4He films in porous glass. We relate the rotation-induced peak to 3D coreless pore vortices threading through the jungle-gim strucure cells. We argue that the rotation peak is due to high superfluid velocity around centers of 3D vortices. This effect is similar to the nonlinear effect of high-amplitude oscillating velocity, which was revealed both for flat and multiplly-connected porous substrates. Using our own measurements of this nonlinear effect for our system, we were able to reproduce the structure of the observed rotation dissipation peak within a reasonable numerical agreement. One can expect larger seperation of the peaks for films condensed on smaller pore size porous glass and for larger pore systems we would expect merging of the two peaks into one, but it would be still different from flat film responce.
Authors express acknowledgments to W. I. Glaberson, J. D. Reppy, and W. F. Vinen for fruitful discussions. E.B.S. acknowledges hospitality and support of the Institute for Solid State Physics, the Univ. of Tokyo. This work has been supported by Grant-in-Aid for Scientific Research from JSPS.
References
- (1) J. D. Reppy, J. Low Temp. Phys.87 205 (1992) and references therein.
- (2) J. M. Kosterlitz and D. J. Thouless, J. Phys. C6, 1181 (1973); and Prog. Low Temp. Phys. B 7, 373 (1978).
- (3) K. Shirahama et al., Phys. Rev. Lett. 64, 1541 (1990); Physica B 165-166, 545 (1990).
- (4) A. Gabor et al., Phys. Rev. Lett.80, 4482 (1998).
- (5) N. P. Mikhin et al., Physica B 329-333, 272 (2003).
- (6) V. Kotsubo, G. Williams, Phys. Rev.Lett. 53,691(1984).
- (7) Murphy SQ, Reppy JD, Physica B 165Part 1, 547 (1990).
- (8) G. A. Williams, Phys. Rev. Lett. 82, 1201 (1999); ibid 68, 2054 (1992).
- (9) T. Minoguchi, Y. Nagaoka, Progr. Theor. Phys. 80, 397 (1988).
- (10) J. Machta and R. A. Guyer, Phys. Rev. Lett. 60, 2054 (1988); J. Low Temp. Phys. 74, 231 (1989).
- (11) T. Obata, M. Kubota, Phys. Rev. B 66,140506 (2002).
- (12) D. J Bishop and J. D Reppy, Phys. Rev. Lett. 40, 1727 (1978); Phys. Rev. B 22, 5171 (1980).
- (13) V. Ambegaokar, B. I. Halperin, D. R. Nelson, E. D. Siggia, Phys. Rev. B21, 1806 (1980).
- (14) P. Adams, W. Glaberson, Phys. Rev. B35, 4633 (1987).
- (15) M. Kubota, Surf. Sci. 283, 404-413 (1993).
- (16) V. Kovacik et al., J. Low Temp. Phys. 101, 567 (1995).
- (17) M. Zalalutdinov, et al. , Czechoslovak J. Phys. 46, Suppl. S 39, (1996).
- (18) K. A. Gillis, S. Voltz, and J. M. Mochel, J. Low Temp. Phys. 61, 172 (1985); S. Giorgini and R. M. Bowley, ibid. 102, 171 (1996).