Present address: ]Department of Physics and Astronomy, Michigan State University, East Lansing, MI-48824, USA.
Detection of a persistent-current qubit by resonant activation
Abstract
We present the implementation of a new scheme to detect the quantum state of a persistent-current qubit. It relies on the dependency of the measuring Superconducting Quantum Interference Device (SQUID) plasma frequency on the qubit state, which we detect by resonant activation. With a measurement pulse of only , we observed Rabi oscillations with high visibility ().
Superconducting circuits containing Josephson junctions are promising candidates to be the building blocks (qubits) for future quantum computers Makhlin02 . Coherent dynamics has been observed with several different qubit designs. Complex sequences of rotations on the Bloch sphere could be performed in NMR-like experiments : Rabi, Ramsey, spin-echo, composite pulse sequences were demonstrated Nakamura99 ; Vion02 ; Martinis02 ; Chiorescu03 . In these experiments, the detection of the qubit energy state is done after the coherent operations have been accomplished by reading out a macroscopic detector with an output that is correlated to the qubit energy eigenstate. By averaging the signal delivered, one infers the qubit eigenstate occupation probability.
A hysteretic DC SQUID has been succesfully employed to measure the state of a flux-qubit Chiorescu03 (a similar scheme was used in Vion02 in the case of a split Cooper pair box). In this experiment, a fast dc current pulse (DCP) sent through the SQUID induced switching to the finite-voltage state conditional on the qubit state. In this Rapid Communication, we propose and demonstrate a new read-out method, faster than the previous one, which does not require a large bandwidth line to inject current through the SQUID and thus will allow a stronger filtering of the bias lines. The method is based on the dependence of the SQUID plasma frequency on the qubit’s state measured by a resonant activation microwave pulse (RAP). We compare Rabi oscillations obtained by the two schemes in exactly the same conditions, and show that the RAP method significantly increases the contrast.
The persistent-current qubit consists of a micron-size superconducting loop intersected with three Josephson junctions Mooij99 . It is threaded by a magnetic flux generated by an external coil. When the total phase across the three junctions is close to (meaning that is close to ), the loop has two low-energy eigenstates (ground state and excited state ) well separated from the higher-energy ones, and can thus be used as a qubit. They are linear combinations of two states and which carry an average persistent-current of and and are coupled by tunnelling. The effective hamiltonian reads in the basis, where is the tunnelling matrix element between the two basis states, and . This leads to an energy separation between the two states Caspar00 .
The average current in state () can be computed from the previous equations. It is shown in figure 1c for the parameters of our sample. The qubit is inductively coupled to a hysteretic DC-SQUID whose critical current depends on by an amount , where is the mutual inductance between the qubit and the SQUID, and is the slope of the SQUID modulation curve. The requirement imposed upon any detection scheme is to detect the small (about ) variation in the SQUID critical current associated with a transition between the qubit states in a time shorter than the qubit’s energy relaxation time . A first method was demonstrated in Vion02 , Chiorescu03 . It consists of applying a short DCP to the SQUID at a value during a time , so that the SQUID will switch out of its zero-voltage state (Cottet02 ,Balestro03 ) with a probability . For well-chosen parameters, the detection efficiency , where () is the switching probability if the qubit is in the ground (excited) state, can approach . The switching probability then directly measures the qubit’s energy level population.
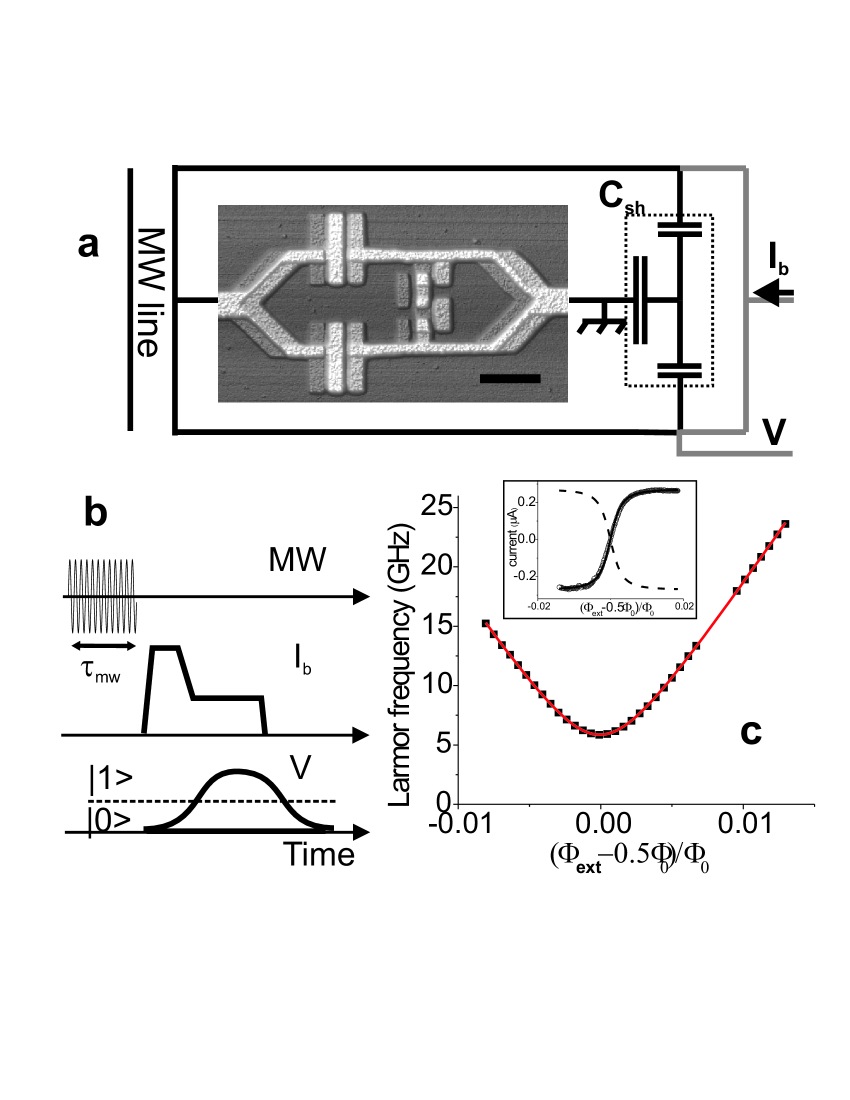
The tunnel junctions as well as the SQUID and qubit’s aluminium loops were obtained by e-beam lithography and shadow-evaporation on an oxidized silicon substrate. The SQUID was shunted by an on-chip aluminium capacitor and connected to the current injection line through a on-chip gold resistor (see figure 1a). Both current and voltage line were filtered by copper-powder filters Devoret87 . The voltage across the SQUID was amplified at room-temperature and sampled by an acquisition card. By repeating the measurements typically times at a rate of we derive the switching probability. Pulsed microwave irradiation was applied to the qubit through a coaxial cable attenuated by at . The sample was enclosed in a copper box thermally anchored to the mixing chamber of our dilution refrigerator (base temperature ) to shield it from RF noise.
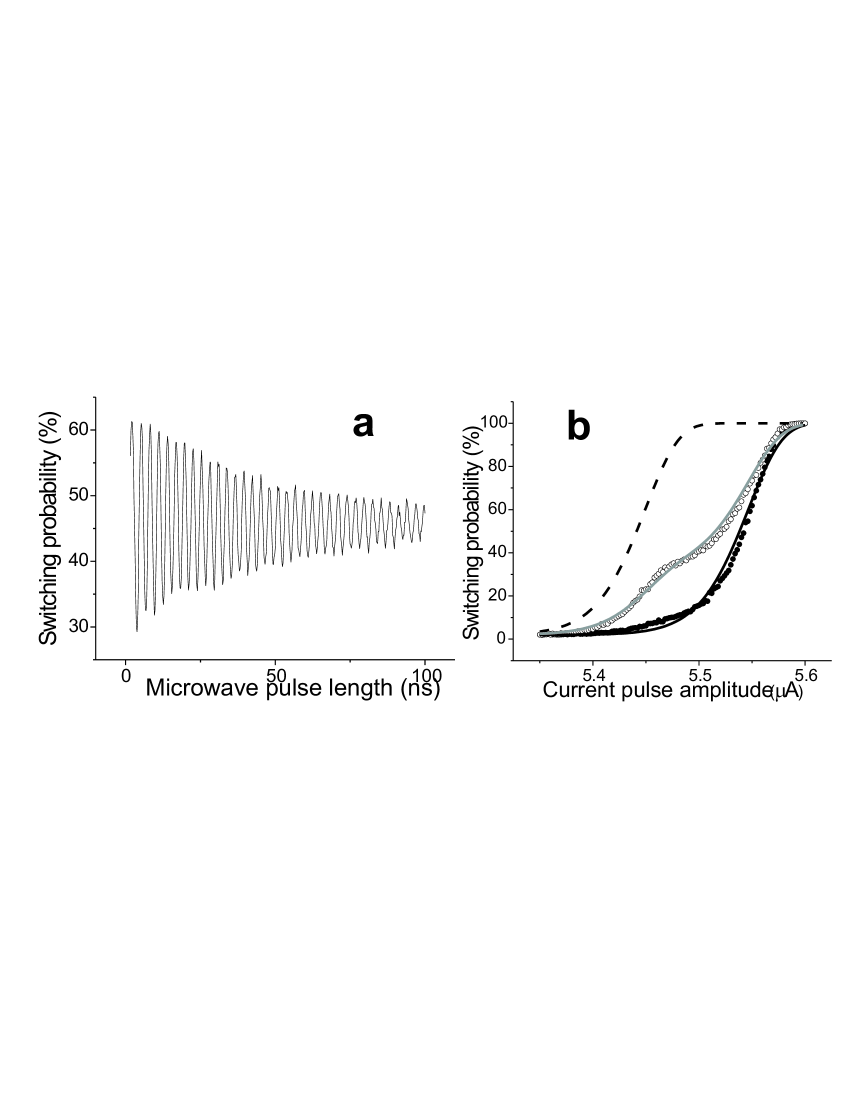
The parameters of our qubit were determined by fitting spectroscopic measurements with the above formulae. For , , the agreement is excellent (see figure 1c). We also determined the coupling constant between the SQUID and the qubit by fitting the qubit “step” appearing in the SQUID’s modulation curve Caspar00 (see insert of figure 1c) and found . We first performed Rabi oscillation experiments with the DCP detection method (figure 1b). We chose a bias point , tuned the microwave frequency to the qubit resonance and measured the switching probability as a function of the microwave pulse duration . The observed oscillatory behavior (figure 2a) is a proof of the coherent dynamics of the qubit. A more detailed analysis of its damping time and period will be presented elsewhere ; here we focus on the amplitude of these oscillations.
In the data shown here, the contrast is , but we observed a strong dependence on the exact bias point, ranging between and . This visibility was lower than in our previous experiment Chiorescu03 . We checked that the amplitude of the current pulse was optimal by measuring the switching probability as a function of both without microwave () and after a pulse (). Typical data are shown in figure 2b. The solid black curve is a fit to assuming that switching occurs by thermal activation across the potential barrier Balestro03 . The dotted line was calculated with the same parameters assuming that the qubit is always in . The curve is then well approximated by a weighted sum of the curves and with coefficients and (grey solid line). From this we conclude that the detection efficiency of our detector, as designed, should be of at least , but that the excited state of our qubit is only populated up to when switching to the running state occurs at the end of the DCP. Thus, it seems that the qubit partially relaxes towards its ground state during the measurement process. As we will show below, this problem does not occur with the alternative measurement scheme described hereafter.
The SQUID, connected to the capacitor by aluminum wires of inductance , behaves as an oscillator with a characteristic frequency called the plasma frequency . This frequency depends on the bias current and on the critical current via the Josephson inductance . Thus, the plasma frequency takes different values or depending on the qubit’s state. This effect has already been observed in Lupascu03 by measuring the transmission of a weak probe at a frequency close to while keeping the SQUID in the zero-voltage state. With a probe of larger power, it has recently been demonstrated that a Josephson junction could switch between two distinct oscillation states while staying in the zero-voltage regime, due to its non-linearity Devoret03bis . Such a bifurcation amplifier could be used to detect the state of a charge qubit Devoret03 . Here we apply a microwave pulse at a frequency close to . We adjust the power so that the SQUID switches to the finite voltage state by resonant activation Devoret84 if the qubit is in state , whereas it stays in the zero-voltage state if it is in state . If the two resonant activation peaks corresponding to the frequencies and are distinct enough, the switching probability of the SQUID measures the probability that the qubit is in the state . Similarly, in Martinis02 , the quantum state of a current-biased Josephson junction (phase-qubit) has been detected by applying a microwave pulse that induces switching determined by the qubit state. In our experiment, the detector is distinct from the qubit. Although switching to the finite-voltage state is a dissipative process potentially harmful for quantum computation, the specific interest of this scheme is that it allows to heavily filter the bias-current line since no fast DC or RF pulse is needed there.
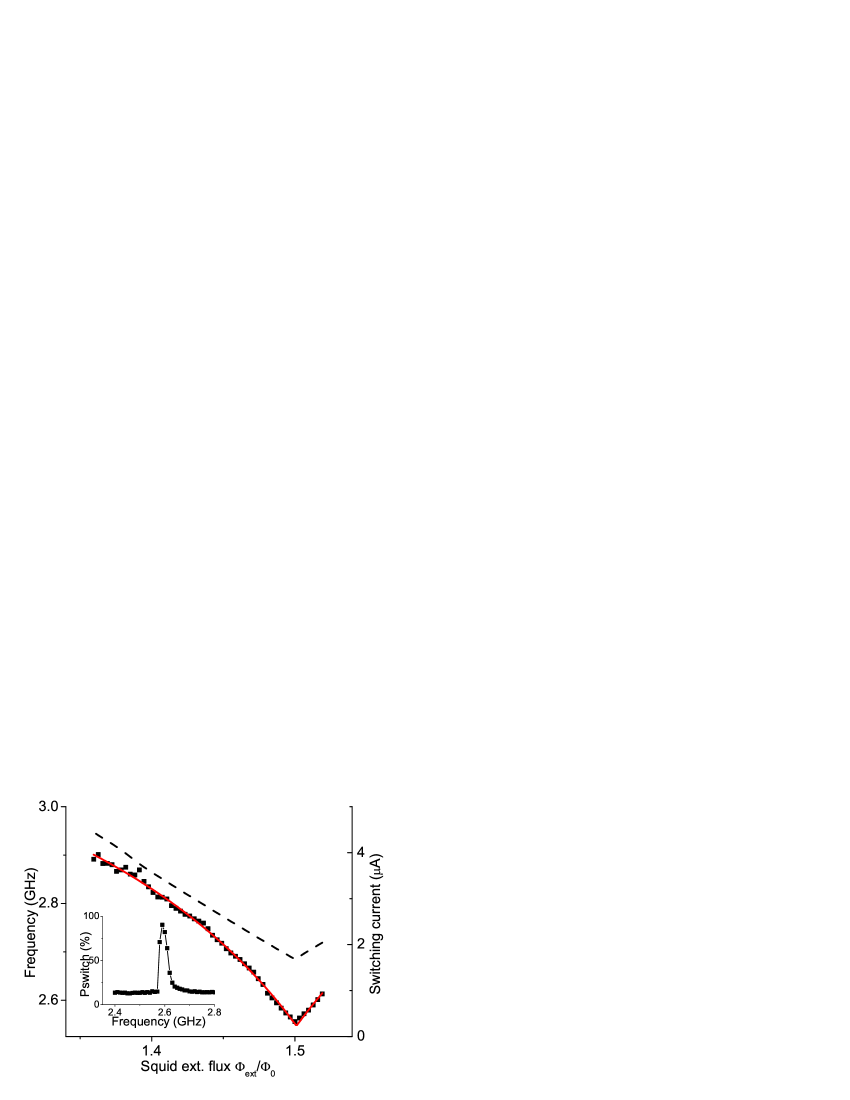
A typical resonant activation peak is shown in the insert of figure 3. Its width depends on the frequency, ranging between and . This corresponds to a quality factor between and . The peak has an asymmetric shape, with a very sharp slope on its low-frequency side and a smooth high-frequency tail, due to the SQUID non-linearity. We could qualitatively recover these features by simple numerical simulations using the RCSJ model Devoret87b . The resonant activation peak can be unambiguously distinguished from environmental resonances by its dependence on the magnetic flux threading the SQUID loop . Figure 3 shows the measured peak frequency for different fluxes around , together with the measured switching current (dashed line). The solid line is a numerical fit to the data using the above formulae. From this fit we deduce the following values and , close to the design. We are thus confident that the observed resonance is due to the plasma frequency.
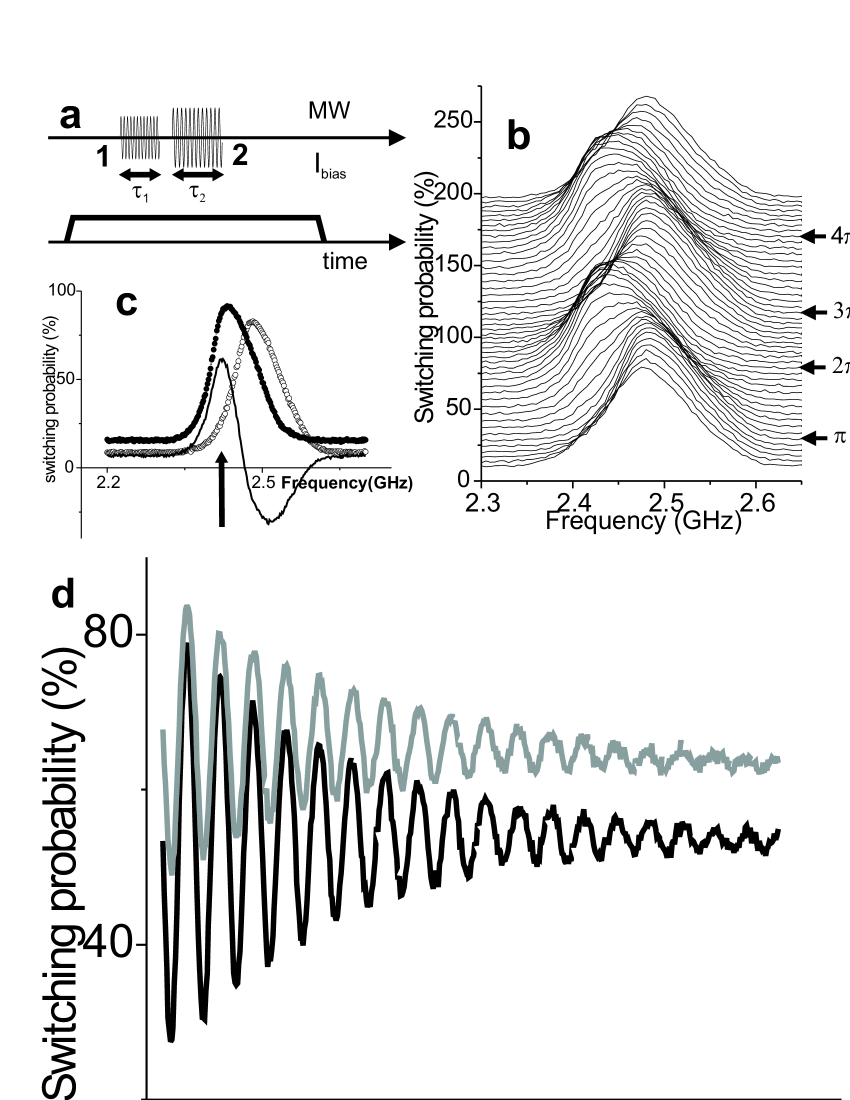
We then measure the effect of the qubit on the resonant activation peak. The principle of the experiment is sketched in figure 4a. A first microwave pulse at the Larmor frequency induces a Rabi rotation by an angle . A second microwave pulse of duration is applied immediately after, at a frequency close to the plasma frequency, with a power high enough to observe resonant activation. In this experiment, we apply a constant bias current through the SQUID (, ) and maintain it at this value after the microwave pulse to keep the SQUID in the running state for a while after switching occurs. This allows sufficient voltage to build up across the SQUID and makes detection easier, similarly to the plateau used at the end of the DCP in the previously shown method. At the end of the experimental sequence, the bias current is reduced to zero in order to retrap the SQUID in the zero-voltage state. We measured the switching probability as a function of for different Rabi angles . The results are shown in figure 4b. After the microwave pulse, the qubit is in a superposition of the states and with weights and . Correspondingly, the resonant activation signal is a sum of two peaks centered at and with weights and , which reveal the Rabi oscillations.
We show the two peaks corresponding to (curve , full circles) and (curve , open circles) in figure 4c. They are separated by and have a similar width of . This is an indication that the pulse efficiently populates the excited state (any significant probability for the qubit to be in would result into broadening of the curve ), and is in strong contrast with the results obtained with the DCP method (figure 2b). The difference between the two curves (solid line in figure 4c) gives a lower bound of the excited state population after a pulse. Because of the above mentioned asymmetric shape of the resonant activation peaks, it yields larger absolute values on the low- than on the high-frequency side of the peak. Thus the plasma oscillator non-linearity increases the sensitivity of our measurement, which is reminiscent of the ideas exposed in Devoret03 . On the data shown here, attains a maximum for a frequency indicated by an arrow in figure 4c. The value of strongly depends on the microwave pulse duration and power. The optimal settings are the result of a compromise between two constraints : a long microwave pulse provides a better resonant activation peak separation, but on the other hand the pulse should be much shorter than the qubit damping time , to prevent loss of excited state population. Under optimized conditions, we were able to reach .
Finally, we fixed the frequency at the value and measured Rabi oscillations (black curve in figure 4d). We compared this curve to the one obtained with the DCP method in exactly the same conditions (grey curve). The contrast is significantly improved, while the dephasing time is evidently the same. This enhancement is partly explained by the rapid RAP (for the data shown in figure 4d) compared to the DCP. But we can not exclude that the DCP intrinsically increases the relaxation rate during its risetime. Such a process would be in agreement with the fact that for these bias conditions, , three times longer than the DCP duration.
In conclusion, we demonstrated a new method for detecting the state of a persistent-current qubit. We exploited the dependence of the SQUID’s plasma frequency on the qubit’s state which we measured by applying a microwave pulse that induces resonant activation. It provided large detection efficiency even for short microwave pulses (). The contrast of the Rabi oscillations was mainly limited by the resonant activation peaks separation. By improving the quality factor of the plasma oscillator and using composite pulses, we might thus reach the single-shot regime while keeping the bias current line heavily filtered and having a large dephasing time.
We thank Y. Nakamura for direct input in this work, F. Balestro, A. Lupascu for fruitful discussions, R. Schouten and B. ven den Enden for technical support. P. B. acknowledges financial support from a European Community Marie Curie fellowship.
References
- (1) Y. Makhlin, G. Schœn, and A. Shnirman, Rev. Mod. Phys. 73, 357 (2001).
- (2) Y. Nakamura, Yu. A. Pashkin, and J. S. Tsai, Nature (London) 398, 786 (1999).
- (3) D. Vion et al., Science 296, 886 (2002).
- (4) J. M. Martinis, S. Nam, J. Aumentado, and C. Urbina, Phys. Rev. Lett. 89, 117901 (2002).
- (5) I. Chiorescu, Y. Nakamura, C. J. P. M. Harmans, and J. E. Mooij, Science 299, 1869 (2003) ; published online 10.1126/science.1081045 (2003).
- (6) J.E. Mooij, T. P. Orlando, L. Levitov, L. Tian, C. H. van der Wal, and S. Lloyd, Science 285, 1036 (1999).
- (7) C. H. van der Wal et al., Science 290, 773 (2000).
- (8) A. Cottet et al., Physica C 367, 197 (2002).
- (9) F. Balestro, J. Claudon, J. P. Pekkola, and O. Buisson, Phys. Rev. Lett. 91, 158301 (2003).
- (10) A. Lupascu, C. J. M. Verwijs, R. N. Schouten, C. J. P. M. Harmans and J. E. Mooij, arXiv:cond-mat/0311510.
- (11) I. Siddiqi et al., arXiv:cond-mat/0312553.
- (12) I. Siddiqi et al., arXiv:cond-mat/0312623.
- (13) J.M. Martinis, M. H. Devoret, and J. Clarke, Phys. Rev. B 35, 4682 (1987).
- (14) M. H. Devoret, J. M. Martinis, D. Esteve, and J. Clarke, Phys. Rev. Lett. 53, 1260 (1984).
- (15) M. H. Devoret, D. Esteve, J. M. Martinis, A. Cleland, and J. Clarke, Phys. Rev. B 36, 58-73 (1987)