STS Observations of Landau Levels at Graphite Surfaces
Abstract
Scanning tunneling spectroscopy (STS) measurements were made on surfaces of two different kinds of graphite samples, Kish graphite and highly oriented pyrolytic graphite (HOPG), at very low temperatures and in high magnetic fields. We observed a series of peaks in the tunnel spectra associated with Landau quantization of the quasi two-dimensional electrons and holes. Comparison with calculated local density of states at the surface layers allows us to identify Kish graphite as bulk graphite and HOPG as graphite with finite thickness of 40 layers. This explains the qualitative difference between the two graphites reported in the recent transport measurements which suggested the quantum Hall effect in HOPG. This work demonstrates how powerful the combined approach between the high quality STS measurement and the first-principles calculation is in material science.
pacs:
71.70.Di, 71.20.Tx, 73.61.Wp, 73.43.FjGraphite is one of the best studied materials concerning its electronic properties both experimentally and theoretically. It is a semimetal or zero gap semiconductor with a unique massless linear dispersion relation for the conduction band. Graphite is also an important mother system for technologically attractive materials such as carbon nanotubes, fullerene, nanographites, etc. Thus, any new insight on this material should have broad impacts.
Recently, graphite has been attracting renewed fundamental interests particularly for its transport properties in magnetic fields. Kopelevich and coworkers kopelevich observed a plateau in the Hall resistance for highly oriented pyrolytic graphite (HOPG) in the quasi quantum limit, which suggests the quantum-Hall effect (QHE) characteristic of the 2D electron systems (2DES) with high mobility. But this behaviour was not observed for a Kish graphite sample kopelevich . Although the QHE is theoretically predicted for a 2D graphene sheet zheng , graphite is a far less ideal 2D conductor in spite of its layered structure. Reentrant field-driven metal-insulator transitions were also reported kopelevich ; kempa for both types of graphites. Theories khveshchenko predict the electron-hole pairing as a possible mechanism. Even for zero field properties, the gapless spin-1 neutral collective mode has been recently suggested from the view point of the resonating valence bond baskaran .
The aim of this work is to investigate the electronic states of Kish graphite and HOPG in high fields and low temperatures by scanning tunneling spectroscopy (STS). The STS technique, which probes the local density of states (LDOS), should potentially be a powerful tool to study the Landau quantization in 2DES in magnetic fields. This was recently demonstrated for the adsorbate-induced 2DES at the surface of InAs(110) with evaporated Fe submonolayers morgenstern . For both types of graphites, we observed clear peak structures in the tunnel spectra associated with the Landau levels (LLs). This is the first STS observation of the LLs in bulk materials. Comparisons with our LDOS calculations reveal that HOPG has a rather distinct 2D electronic state due to the effective finite thickness but Kish graphite does not. This provides a spectroscopic explanation for the qualitatively different transport properties between the two types of graphites and the possible QHE in HOPG. More generally, it is an important achievement that in combination with the theoretical calculations we could determine the surface and underneath electronic states in layered materials in quantitative manners from the STS measurements.
The STS data were taken with a recently constructed ultra-low temperature STM ULT-STM at temperatures below 50 mK and in magnetic fields up to 6 T. The Kish graphite sample kish is single crystalline graphite grown as precipitation from molten iron. The HOPG sample hopg is synthesized by chemical vapor deposition and subsequent heat treatment under high pressures. HOPG is polycrystalline graphite with ordered -axis orientation. The typical microcrystallite (platelet) size is of the order of 1 m. The samples were cleaved in air and then quickly loaded into an ultra high vacuum chamber ( Pa) of the STM. The differential tunnel conductance (), which is proportional to the sample density of states (DOS), was measured by the lock-in technique with a bias modulation of 0.6 or 1.4 mV at a frequency of 131 or 877 Hz. Here is the bias voltage applied to the sample relative to the tip.
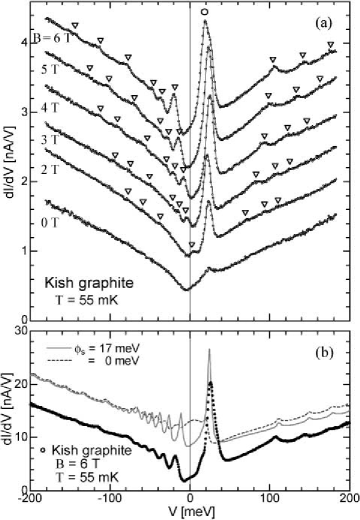
Fig. 1(a) shows measured tunnel spectra for Kish graphite at several different fields. Each spectrum at a given field is an average of raw data taken at 400 different positions over a nm2 area which is much smaller than the platelet size. The “V” shaped spectrum with a non-zero DOS at 0, i.e., , in zero magnetic field is characteristic of semimetallic properties of graphite. To our knowledge, the DOS of graphite has never been measured with such a high energy resolution before.
In finite fields (), several peaks appear superimposed onto the V-shaped base line (the open triangles in Fig. 1(a)). The peaks become more pronounced at higher fields, and the peak energies are roughly in proportion to . A typical energy separation between the two successive peaks is 20-40 meV at 6 T which is in the same order as for the electrons ( meV) and holes ( meV) calculated from the in-plane effective masses (, ). Here is the cyclotron frequency and is the bare electron mass. Thus we believe that these peaks are associated with the LLs in graphite. In addition to the field dependent small peaks, there exists a much pronounced peak just above ( mV) for each spectrum. The peak energy is nearly field independent, but the amplitude grows rapidly with increasing field. The absence of field dependence of the peak energy strongly suggests that it originates from the (electron) and (hole) LLs nakao . These levels are characteristic of the graphite lattice structure nakao ; dresselhaus_trigonal and have been known so far only indirectly. The important point is that this peak almost disappears in zero field.
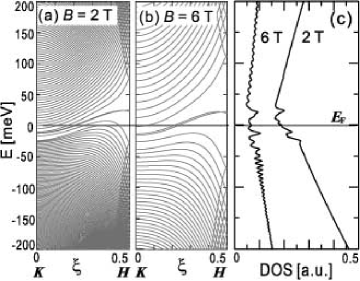
Let us now compare the observed tunnel spectra with theoretically expected LLs in bulk graphite. Figs. 2(a)(b) show Landau subbands calculated from the SWMcC model SWMcC along the Brillouin zone edge (K-H axis) at 2 and 6 T. We followed here Nakao’s method nakao who avoided the infinite dimension problem of the magnetic Hamiltonian matrix by grouping it into three submatrices and then by truncating them at finite dimensions. We truncated them at 240 and 60 dimensions for and 6 T respectively, which are sufficiently large for studying the DOS in the energy range interested here. The seven band parameters in the SWMcC model were fixed to those used in Ref. nakao , and small Zeeman energies are neglected throughout this Letter. As seen in Fig. 2(b), the doubly degenerated narrow bands across , i.e., the lowest order LLs (), are nearly unchanged even by applying the field of 6 T due to the strong inter-band interaction. The DOS calculated from these subbands are shown in Fig. 2(c) where we applied a Lorentzian smearing of meV. There are general similarities between the experimental data (Fig. 1) and the theoretical DOS, for instance the existence of field independent peak just above and the asymmetry of peak structures above and below . However, we also notice several quantitative disagreements: First, the peak energy separations in the theoretical DOS are much smaller than those observed experimentally. Second, the relative height of the field independent peak to the others is much smaller in the theory.
These discrepancies can be resolved by calculating the LDOS at the surface layer of bulk graphite. We decomposed the SWMcC Hamiltonian into a Hamiltonian for successive layers and calculated the surface LDOS by the Green’s functions method SurfGreen1 ; tagami . The result of the calculation with the surface potential () of meV is shown as the solid line in Fig. 1(b) for the case of T. The agreement between the experiment and theory is now excellent. This means that what is measured with STS is the surface LDOS reflecting the bulk electronic state behind. This was confirmed by the fact that peak patterns calculated for underlayers rapidly change and approach that for bulk graphite shown in Fig. 2(c). The physical meaning of is band bending near the surface. Its possible origin is a local electrostatic potential induced by the tip. In the calculations, we added to on-site atomic levels at the surface layer in the Hamiltonian matrix. Note that the surface potential affects mostly the LLs and not the larger LLs (see the dashed line in Fig. 1(b)).
Next we show tunnel spectra obtained for the HOPG sample in Fig. 3(a). Each spectrum is an average of the raw data at 100 different positions over nm2 area. Again, we saw a series of growing and separating peaks with increasing field as well as a nearly field independent peak just above . The peak structures are, however, much more pronounced and complicated than those for Kish graphite except for the LLs. The peak amplitudes are comparable to those observed in the 2DES at the Fe/InAs(110) surface morgenstern . All these indicate that in HOPG an effectively 2D electronic state is created unlike in Kish graphite.
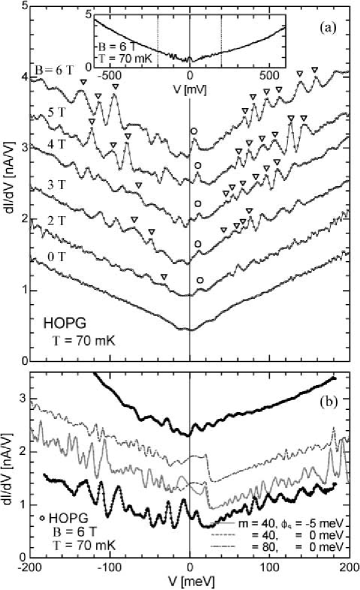
The somewhat irregular LL peak pattern for HOPG is explained by calculated LDOS at the surface of graphite with finite layer thickness (). We calculated the LDOS at each atomic site and each layer by diagonalizing the decomposed Hamiltonian matrices. As can be seen in Fig. 3(b), the experimental data for HOPG at 6 T are reproduced reasonably well by the calculation for 40 layers, where is the number of graphene layers ( nm). We assumed here meV. The many irregular peaks are results of complicated phase interference between the incoming and outgoing wave functions at the surface. The calculations show that the peak amplitudes at high energies decrease with increasing (cf. the dash-dotted line for 80 in Fig. 3(b)) and that, of course, the peak pattern approaches the result for bulk surface as tagami . It is also shown that the peak structure near due to the LLs does not depend appreciably on .
The electronic identification of HOPG as graphite with finite thickness is consistent with the fact that it contains a much higher stacking fault density than Kish or natural graphite. This fact was checked by measuring the ratio () of the in-plane electrical conductivity to the out-of-plane one. The values for Kish graphite and HOPG are 190 and , respectively. Furthermore, another HOPG sample with a lower value shows less corrugated tunnel spectra (the topmost spectrum in Fig. 3(b)) in accordance with the above mentioned calculations.
In the following, we discuss about the origin of . Experimentally, although the tunnel spectra within 30 meV of changed significantly depending on the tip condition, those at higher energies were always unaffected. In addition, the overall spectra were stable for many hours unless we changed the tip condition intentionally, for example, by applying high voltage pulses ( V). Thus the origin is attributable to the electrostatic potential caused by the tip. Note that, in graphite, the DOS in the vicinity of should be very sensitive to , since the subbands are much narrower compared to the others (see Figs. 2(a)(b)). In other words, the LDOS peak associated with the LLs can easily be enhanced even by a small amount of like in Fig. 1. This is also seen in Figs. 1(b) and 3(b) where the calculated LDOS peaks near are quite different between with and without the small surface potentials, whilst little is different for the higher energy peaks. We did not see a clear correlation between and the tip material (W or PtIr) which may suggest the importance of the work function difference between the tip and sample wildoer . The relatively small effects on the LL structure (except for the LLs) caused by the tip compared to the 2DES in semiconductors are presumably due to the higher carrier densities and, hence, more effective screening effect in graphite.
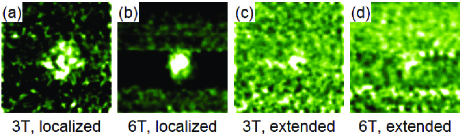
We observed a circular distribution of the LDOS around point defects on the HOPG surface in the image at an energy in between 1 and 2 LLs at 3 T as shown in Fig. 4(a). The radial extension is roughly equal to the magnetic length, ( nm at 3 T), of the 2DES, and decreases as increases to 6 T (see Fig. 4(b)) suggesting localization of the electronic wave function along an equipotential contour around the defects. In contrast, the images at energies corresponding to the 2 LL do not show such a distribution but complicated nonlocal networks of the wave function in addition to moderately bright local spots at different positions from the defects (Figs. 4(c)(d)). These observations defect indicate the existence of the 2DES in HOPG and likely the drift- and extended states previously observed in the Fe/InAs(110) system morgenstern .
It is generally expected for the LL structure to have a rather strong atomic-site dependence. Actually, the calculated LDOS peak structures are qualitatively different between the A and B sites in the case of graphite with finite thickness tagami . Note that the calculated LDOS shown in Fig. 3 is the sum of LDOS on the two sites. However, experimentally, averaged tunnel spectra on the B sites differ from those on the A sites only within the experimental errors. We speculate that the expected site dependence was masked by dominating tunnel currents from neighboring B-site atoms even when the tip is just above an A-site atom.
In conclusion, we succeeded in observing clearly the Landau quantization in bulk material (graphite) with STS in high magnetic fields and very low temperatures. By comparing with calculated LDOS, we found that the measured tunnel spectra for Kish graphite and HOPG well represent the LDOS at the surface layers of bulk graphite and graphite with finite thickness of about 40 layers, respectively. The more pronounced LL structure in HOPG indicates the much stronger 2D nature of the electronic state than previously thought. Our results provide a spectroscopic statement that HOPG has a high-mobility quasi 2DES which is eligible to show the quantum Hall effect as was conjectured by the recent transport measurements kopelevich . This was supported by the wave function mappings near surface defects which show the localization and extension of the electronic state depending on energy relative to the LL structure. The present work is the first example to extract quantitative information on the electronic states in bulk or finite thickness layered material from the surface LDOS measured with STS. This further expands the potentialities of the STS technique for material science.
We thank H. Aoki and Y. Takada for valuable discussions. We are also grateful to Y. Iye for kindly supplying us the Kish graphite samples. This work was financially supported by Grant-in-Aid for Scientific Research from MEXT, Japan and ERATO project of JST. T.M. and Y.N. acknowledge the JSPS Research Fellowship for Young Scientists.
References
- (1)
- (2) [∗]Electronic address: hiroshi@phys.s.u-tokyo.ac.jp
- (3) Y. Kopelevich et al., Phys. Rev. Lett. 90, 156402 (2003).
- (4) Y. Zheng and T. Ando, Phys. Rev. B 65, 245420 (2002).
- (5) H. Kempa, P. Esquinazi, and Y. Kopelevich, Phys. Rev. B 65, 241101(R) (2002).
- (6) D.V. Khveshchenko, Phys. Rev. Lett. 87, 206401 (2001); D.V. Khveshchenko, ivid., 246802 (2001); E.V. Gorbar et al., Phys. Rev. B 66, 045108 (2002).
- (7) G. Baskaran and S.A. Jafari, Phys. Rev. Lett. 89, 016402 (2002).
- (8) M. Morgenstern et al., Phys. Rev. Lett. 90, 056804 (2003).
- (9) T. Matsui et al., J. Low Temp. Phys. 121, 803 (2000); T. Matsui et al., Physica B 329, 1653 (2003); H. Kambara, T. Matsui, and H. Fukuyama, to be published.
- (10) We used Kish graphite samples from the same batch as that for the type B samples in Y. Iye, L.E. McNeil, and G. Dresselhaus, Phys. Rev. B 30, 7009 (1984).
- (11) Super Graphite (grade MB), Matsushita Electric Industrial Co., Ltd.
- (12) K. Nakao, J. Phys. Soc. Jpn. 40, 761 (1976).
- (13) G. Dresselhaus, Phys. Rev. B 10, 3602 (1974).
- (14) J. C. Slonczewski and P. R. Weiss, Phys. Rev. 109, 272 (1958); J. W. McClure, Phys. Rev. 108, 612 (1957).
- (15) M. B. Nardelli, Phys. Rev. B 60, 7828 (1999).
- (16) K. Tagami and M. Tsukada, to be published.
- (17) J.W.G. Wildöer, C.J.P.M. Harmans, and H. van Kempen, Phys. Rev. B 55, R16013 (1997).
- (18) Details will be published elsewhere.