Present address: ]The Institute of Physical and Chemical Research (RIKEN), Wako, Saitama 351-0198, Japan. Present address: ]Condensed matter sciences division, Oak Ridge National Laboratory , Oak Ridge, TN 37831-6393, USA.
Field-controlled phase separation at
the impurity-induced magnetic ordering
in the spin-Peierls magnet CuGeO3
Abstract
The fraction of the paramagnetic phase surviving at the impurity-induced antiferromagnetic order transition of the doped spin-Peierls magnet Cu1-xMgxGeO3 ( 5%) is found to increase with an external magnetic field. This effect is qualitatively explained by the competition of Zeeman energy and exchange interaction between local antiferromagnetic clusters.
pacs:
75.10.Jm, 75.50.Ee, 76.50.+gSpin-chain magnets of spin-Peierls Hase or Haldane Haldane types reveal a quantum-disordered singlet ground state which is separated from the excited magnetic states by an energy gap. Consequently, the disordered ground state is stable against the influence of the crystal field or a weak interchain exchange. Nevertheless, these quantum paramagnets may be driven into the ordered state by means of weak doping, both magnetic as well as non magnetic Hase3 ; Uchiyama . Impurity-induced magnetic ordering is explained by the local destruction of the singlet state and a concomitant onset of local staggered magnetization. This local antiferromagnetic (AFM) order consists of approximately 10 correlated spins of a spin chain with a total magnetic moment of 1 , see, e.g., Refs. Fukuyama, ; Miyashita, . According to this model, the staggered magnetization attains a maximum value at the sites of a spin chain near the impurity and decays exponentially with the distance from the impurity. Such areas of the staggered magnetization of about 10 interspin distances in size were detected experimentally in a doped spin-Peierls magnet Kojima . The overlap of the wings of these ordered areas and a weak interchain exchange should result in long-range AFM order Fukuyama ; shender-kivelson ; khomskii . Another theoretical model Onishi predicts a maximum of the AFM local order away from the impurity, and NMR experiments Kikuchi with off-chain doping of the spin-Peierls compound CuGeO3 revealed ”the absence of doping-induced moments next to an impurity”. Apart from one-dimensional magnets, impurity-induced ordering is also found in the dimer spin-gap system TlCuCl3 tlcucl3 ; tlcucl3-impurities-af .
In spin-Peierls systems the spin-gap phase originates from the magnetoelastic instability of a 3D crystal containing spin chains. At the temperature of instability, , the chains become dimerized with the exchange integral taking in turn two values and . The dimerization produces a gain in exchange energy which exceeds the loss in elastic energy Pytte . The spin-Peierls transition and the impurity-induced ordering were studied in detail in CuGeO3 having K (see, e.g., Ref. glazkov-phasesep, and references therein). The doping prevents dimerization, i.e. the temperature of a doped crystal is lower, than that of a pure one, and at an impurity concentration exceeding a threshold value , the lattice remains uniform. Thus, depending on the concentration, the Néel transition occurs on the dimerized (i.e. spin-gap) or uniform (gapless) background. The ()-diagram is reported in a variety of papers, for the case of non magnetic Mg-doping, with a detailed map of lattice and magnetic states given in Ref. Mg&Zn-masuda, .
Because the staggered magnetization induced by an impurity is localized on a short distance, the ordered phase should be highly inhomogeneous. It was found experimentally glazkov-phasesep ; smirnov02 ; smirnov96 that below the Néel temperature the AFM and paramagnetic (PM) resonance signals coexist. Considering the spatial inhomogenity, it means that the order parameter varies in space from a maximum value till zero and a true microscopic phase separation into AFM and PM phases occurs. These experiments demonstrated the coexistence of the PM and AFM responses in a magnetic field near kOe. For nonzero temperatures, the simple modeling (see Ref. glazkov-phasesep, , Fig. 9) predicted the coexistence of AFM areas of different sizes, surrounded by the residual of the spin-gap matrix. According to this model, large AFM areas, ranging for macroscopic distances, provide AFM resonance signals and an AFM susceptibility. Small AFM areas provide PM resonance signals and a Curie-like susceptibility due to their net magnetic moments. The numerical simulation for a low-doped spin-Peierls system Yasuda confirmed a strongly inhomogeneous ground state with practically 100% spatial modulation of the absolute value of the order parameter, this should imply a phase separation at a finite temperature.
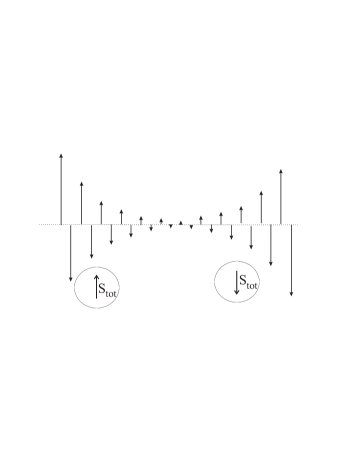
In the present paper we investigate the influence of a magnetic field on the structure of the impurity-induced ordered phase. The motivation to perform these experiments is the hypothesis that the correlation of the local order parameters of neighboring small AFM areas should be broken by the magnetic field, if a parallel orientation of the net magnetic moments hampers the coherent AFM order in these two areas (see Fig. 1). Indeed, such an influence of the magnetic field on the impurity-ordered phase can be deduced from our magnetic resonance experiment, which quantitatively probes the ratio of PM and AFM fractions dependent on the field.
We used the same set of Cu1-xMgxGeO3 single crystals as for the investigation of the phase diagram Mg&Zn-masuda and of the phase separation glazkov-phasesep . Details of the sample preparation and their quality control are described in Ref. Mg&Zn-masuda, . The method of electron spin resonance (ESR) enables one to detect the presence of two phases, because AFM and paramagnetic phases have different resonance frequencies (or different resonance fields, when measured at a fixed frequency ) glazkov-phasesep . The low-temperature ESR signal arises predominantly from the impurities, because the susceptibility of the spin-Peierls background is frozen due to the spin-gap. The characteristic feature of the AFM-resonance mode is the nonzero frequency in zero field. PM resonance of centers follows the simple frequency-field relation , and its integral intensity is proportional to the static susceptibility, hence, to the number of free spins. The fraction of the sample, which remains paramagnetic below the Néel point, can be derived as the ratio of the integral intensities of the PM resonance signals below and above . We have performed the measurements of this ratio in different magnetic fields by taking the ESR absorption as a function of the magnetic field at different microwave frequencies. By means of a set of transmission-type ESR spectrometers covering the range from 18 to 40 GHz and using additionally a commercial Bruker ELEXSYS X-Band spectrometer (9.5 GHz), we recorded the ESR lines in the field range kOe.
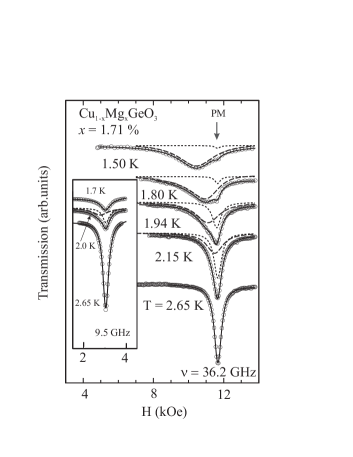
As a typical example Fig. 2 shows the evolution of the ESR lineshape with temperature in Cu1-xMgxGeO3 ( 1.71%) obtained at a microwave frequency GHz. Above the Néel temperature K the absorption spectrum is well described by a single Lorentzian line. An additional absorption signal arises at lower fields, when the temperature decreases below the Néel point. The resonance field of this additional signal decreases with decreasing temperature. At GHz it is observable in the whole temperature range and its intensity grows at cooling. Concomitantly, the intensity of the PM absorption decreases. Thus, at low temperatures and at GHz the ESR absorption is dominated by the component with the temperature-dependent resonance field. The frequency-field dependence of this mode reveals the characteristics of an orthorhombic AFM and can be identified as an AFM-resonance signal, see Ref. glazkov-phasesep, . The Néel temperature can be determined as the temperature of the onset of the AFM-resonance absorption. The values of obtained for all samples in this way are in agreement with the results of magnetization studies Mg&Zn-masuda . The X-band (9.5 GHz) measurements (inset of Fig. 2) reveal two coexisting lines only in a narrow temperature interval below , only the PM component is visible at low temperatures. The AFM component disappears quickly very close to because the AFM-resonance gap becomes larger than the microwave frequency. Nevertheless, the diminishing PM component indicates the coexistence of the increasing AFM fraction. Note that for a normal AFM transition only an AFM absorption signal should be present below . For Cu1-xMgxGeO3 we observe this normal scenario at , where the dimerization is fully suppressed. At low microwave frequencies, in contrast to the situation demonstrated in the inset of Fig. 2, the ESR line in a normal AFM disappears immediately below .
The concentration 2.48% lies in the crossover region, which separates the Néel transition on the dimerized lattice from the transition to the uniform AFM. For this concentration the magnetization measurements show two cusps at temperatures K and K, ascribed to the formation of the AFM phase coexisting with short-range dimerization order and with long-range spin-Peierls order, respectively Mg&Zn-masuda . We found that the transformation of the ESR line, corresponding to AFM ordering, occurs at the lower point , only. For temperatures the ESR line consists of a single PM resonance line.
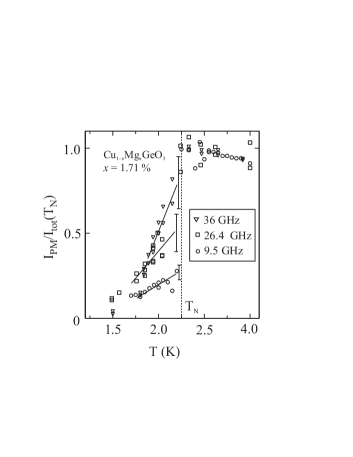
The ESR lines taken at different temperatures and frequencies were numerically fitted by a sum of two Lorentzians, this fitting enables one to measure the intensity of AFM (dashed line) and paramagnetic resonances (dotted line in Fig. 2). The temperature dependences of the integrated intensities of the paramagnetic component are shown in Fig. 3 for three different microwave frequencies. Extrapolating the temperature dependence of the intensity of the PM component to the transition point allows the determination of the fraction of the sample remaining paramagnetic at the Néel temperature. An unequivocal determination of the two ESR components with close resonance fields at temperatures just below is rather uncertain and an error of about 20% of the total intensity occurs close to the transition temperature for GHz and GHz. At 9.5 GHz, this error is only about 10%. However, the observed increase of the paramagnetic fraction with increasing microwave frequency is significantly beyond this error, as shown in Fig. 3. For 1.71% the PM fraction increases as a function of frequency (i.e. field) from 0.2 at 9.5 GHz to 0.8 at 36 GHz. This field-dependence of the paramagnetic fraction at the temperature just below is given in Fig. 4 for two concentration values. The relative intensity of the PM component at the Néel point increases with increasing magnetic field for both samples.
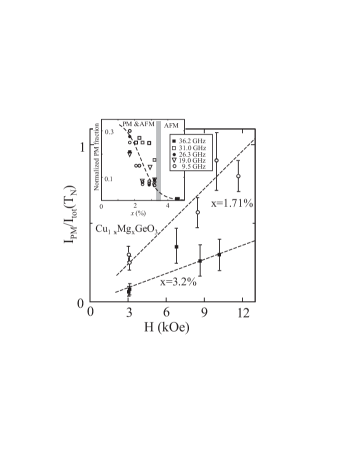
Concentration dependences of the PM fraction are shown in the inset of Fig. 4. The data taken at different frequencies are normalized to the microwave frequency (i.e. to the ESR field in the PM phase). The normalized dependences demonstrate a qualitatively similar behavior with the PM fraction vanishing at . The concentration dependence of the PM fraction can be understood in terms of the model developed previously in Ref. glazkov-phasesep, : with increasing impurity concentrations the volume of the PM phase should decrease, because the distances between the impurities become shorter and the areas of local AFM order more and more overlap by portions, where the spin projections are large. Hence, the volume fraction remaining for the undisturbed singlet matrix and for isolated AFM chain fragments decreases. Besides that, at 3.5% the dimerization is suppressed and neither a spin-gap nor phase separation shows up.
The magnetic field dependence of the PM fraction can be qualitatively explained using the concepts of Refs. Fukuyama, ; khomskii, ; shender-kivelson, . The local order parameter decays exponentially with the distance from the impurity, measured along the chain. At nonzero temperature the AFM correlation of spin projections will be lost at a distance from the impurity atom, this distance may be estimated by the relation
| (1) |
Here denotes the exchange-integral value and and characterizes the magnetic correlation length in the corresponding direction. The ensemble of correlated spins in the chain fragment of length near the impurity and of the spins from the neighboring chains, correlated with the spins in the fragment due to the interchain exchange, will be denoted further on as a ”cluster”. As mentioned above, each cluster carries a net magnetic moment of . As temperature decreases, the size increases and the clusters begin to overlap, thus the area of coherent AFM order increases. In a magnetic field the Zeeman energy of the clusters attains a minimum, if the net magnetic moments of all clusters are aligned parallel to the field, but the exchange energy reaches a minimum at a coherent correlation of local AFM-order parameters. Thus, an external magnetic field destroys the AFM correlation of neighboring clusters positioned as shown in Fig. 1. The correlation of the order parameters of two clusters on a chain fragment containing an odd number of spins will be destroyed by a magnetic field given approximately by the relation
| (2) |
Therefore, the magnetic field enlarges the number of clusters with uncorrelated AFM order parameters and results in an increase of the PM fraction of the sample. In other words, the increase of the field should increase the PM fraction below the transition point, in accordance with the experimental observations. This simplified consideration does not include the interchain correlation which may be also influenced by the magnetic field.
In this way, a strong magnetic field may destroy the long-range AFM order, but the local order near the impurities will survive. Therefore, this scenario can also explain the anomalously strong field dependence of the Néel temperature reported recently for the impurity-induced ordering in the Haldane magnet PbNi2V2O8 masuda-tn(h) .
In conclusion, we resume that the observation of a paramagnetic ESR signal below the impurity-induced Néel transition reveals a specific kind of AFM ordering, with a field-dependent microscopic separation of magnetic phases. The fraction of the paramagnetic phase is enlarged by application of an external magnetic field. Within a qualitative model, considering the competition between exchange interaction and Zeeman energy of the local antiferromagnetic clusters formed around the impurities, the influence of the magnetic field on the phase separation is explained.
This work is supported by the Russian foundation for basic research (RFBR) grant No. 03-02-16579, by the Deutsche Forschungsgemeinschaft (DFG) via Sonderforschungsbereich SFB 484 (Augsburg) and via the joint project with RFBR under contract No. 436RUS113/628, and by the German Bundesministerium für Bildung und Forschung (BMBF) under contract No. VDI/EKM 13N6917.
References
- (1) M. Hase et al., Phys. Rev. Lett. 70, 3651 (1993).
- (2) F. D. M. Haldane, Phys. Rev. Lett. 50, 1153 (1983).
- (3) M. Hase et al., Phys. Rev. Lett. 71, 4059 (1993).
- (4) Y. Uchiyama et al., Phys. Rev. Lett. 83, 632 (1999).
- (5) H. Fukuyama et al., J. Phys. Soc. Jpn. 65, 1182 (1996).
- (6) S. Miyashita and S. Yamamoto, Phys. Rev. B 48, 913 (1993).
- (7) K. M. Kojima et al., Phys. Rev. Lett 79, 503 (1997).
- (8) E. F. Shender and S. A. Kivelson, Phys. Rev. Lett. 66, 2384 (1991).
- (9) D. Khomskii et al., Czech. J. Phys. 46 S6, 3239 (1996).
- (10) H. Onishi and S. Miyashita, J. Phys. Soc. Jpn. 69, 2634 (2000).
- (11) J. Kikuchi et al., Phys. Rev. Lett 88, 037603 (2002).
- (12) A. Oosawa et al., Phys. Rev. B 65, 094426 (2002).
- (13) A. Oosawa et al., Phys. Rev. B 66, 020405 (2002).
- (14) E. Pytte, Phys. Rev. B 10, 4637 (1974).
- (15) V. N. Glazkov et al., Phys. Rev. B 65, 144427 (2002).
- (16) T. Masuda et al., Phys. Rev. B 61, 4103 (2000).
- (17) A. I. Smirnov et al., Phys. Rev. B 65, 174422 (2002).
- (18) A.I. Smirnov et al., JETP Lett. 64, 305 (1996).
- (19) C. Yasuda et al., Phys. Rev. B 64, 092405 (2001).
- (20) T. Masuda et al., Phys. Rev. B 66, 174416 (2002).