Similarity based cooperation and spatial segregation
Abstract
We analyze a cooperative game, where the cooperative act is not based on the previous behaviour of the coplayer, but on the similarity between the players. This system has been studied in a mean-field description recently [A. Traulsen and H. G. Schuster, Phys. Rev. E 68, 046129 (2003)]. Here, the spatial extension to a two-dimensional lattice is studied, where each player interacts with eight players in a Moore neighborhood. The system shows a strong segregation independent of parameters. The introduction of a local conversion mechanism towards tolerance allows for four-state cycles and the emergence of spiral waves in the spatial game. In the case of asymmetric costs of cooperation a rich variety of complex behavior is observed depending on both cooperation costs. Finally, we study the stabilization of a cooperative fixed point of a forecast rule in the symmetric game, which corresponds to cooperation across segregation borders. This fixed point becomes unstable for high cooperation costs, but can be stabilized by a linear feedback mechanism.
pacs:
02.50.Le, 87.23.-n, 89.65.-sI Introduction
The study of complex systems with game theoretic interactions has recently attracted a lot attention in statistical physics, biology, behavioral sciences, and economics. In contrast to standard game theory Neumann1953 the focus has recently been on evolutionary game theory Smith1982 ; Gintis2000 ; Hofbauer1998 ; Nowak2004a ; Nowak2004b . In particular, the prisoner’s dilemma Axelrod1984 has become the metaphor for the evolution of cooperation in populations of selfish individuals. If the game is not repeated, the dominating strategy is to defect. However, repeated interactions of individuals memorizing the past can establish high levels of cooperation from direct reciprocity Axelrod1984 . Reciprocity works also indirectly if individuals can observe the behavior of others and cooperate with respect to the reputation of others Nowak1998 ; Nowak1998b .
Real world interactions are often restricted to small local groups. Realizing that territoriality can have strong influences on the evolution of cooperation, Axelrod proposed the study of a spatially extended prisoner’s dilemma Axelrod1984 . Nowak and May studied a cellular automaton based on the prisoner’s dilemma Nowak1992 . They found that reducing interactions to small local groups can promote cooperation, as cooperative clusters minimize their contacts with neighboring defectors. Their paper initiated an intensive research on spatially extended games on two dimensional lattices Lindgren1994 ; Herz1994 ; Szabo1998 ; Szabo2002 and network topologies Abramson2001 ; Ebel2002 ; Holme2003 ; Szabo2004 . However, spatial structure does not necessarily lead to an increased level of cooperation Hauert2004 .
Another mechanism that can promote cooperation among related individuals is kin selection Hamilton1963 . Although kin selection is controversial in biology, indications for similarity based interaction mechanisms have been found on the molecular level Turner1999 ; Taga2003 . Riolo et al. introduced a model in which agents are equipped with traits that allow one to discriminate between different groups of players Riolo2001 . It has been argued that the model is of limited biological relevance, as agents are forced to cooperate within their own group Roberts2002 ; Hauert2002c . However, cooperation can evolve from a combination of kin selection and reciprocity, which can promote such an intragroup cooperation. The mechanism that leads to cooperation does not have to be the same for interaction within groups and between groups. In spatially extended systems agents can only prosper if they get sufficient support from their neighbors. Hence, cooperation based on similarity will lead to a segregation of different groups in spatially extended system Sigmund2001 .
Although the importance of group memberships is stressed in the social sciences Hammond2003 , segregation is usually not desired in social systems. We raise the question on the minimal requirements for agents in order to avoid this kind of segregation. We introduce a forecast rule that helps to overcome the segregation, leading to a population in which agents support others regardless of their group membership. The corresponding spatial pattern can be stabilized by a linear global feedback.
II Definition of the model
The evolution of cooperation in large populations is usually analyzed in systems based on public goods games Hardin1968 . For each cooperation a cost depending on the tag of the player is incurred which results in a benefit for the interaction partner. For simplicity, we restrict ourselves to two groups of agents only, red and blue. In every group there are two kinds of players. Intolerant players support only others with the same tag (). Tolerant players () support any other player, regardless of his group membership. The payoff of every player depends on the strategies of his interaction partners. We introduce , , and for the number of interaction partners that are tolerant red, intolerant red, tolerant blue and intolerant blue, respectively. The payoff can be written as
| (5) |
In the following we restrict ourselves to . The system with is analyzed in Section IV. In a single interaction the payoff is if both players cooperate with each other, indicating that the player has been exploited, and indicating that the player has exploited his interaction partner. The payoff is zero when both players refused to cooperate. The tolerant strategies are dominated by the intolerant strategies, as the payoffs of the strategies are never higher than the payoffs of the strategies. In well mixed systems without spatial structure this leads to bistability. One group becomes extinct and the other group dominates in the two evolutionary stable Nash equilibria with intolerant players of one tag only. An alternating dominance of both groups can be generated if there is a drift towards more tolerance Traulsen2003 .
III Spatially extended system
Players are arranged on a two dimensional regular cubic lattice with periodic boundary conditions. The system size is . Each player interacts with his eight nearest neighbors (Moore-neighborhood), i.e. . After interacting with all the neighbors, the players update their strategy synchronously. This corresponds to discrete, non-overlapping generations. Strategies are updated due to the deterministic “best takes over” rule Hauert2002a ; i.e. switches to the strategy among its nearest neighbors that reached the highest payoff;
| (6) |
If several nearest neighbors with different strategies have the same success, players keep as much of their identity as possible. Choosing between switching tag or tolerance, players will switch their tolerance. This ensures that the update rule remains deterministic. However, these additional rules apply only in very rare cases. Note that the new strategy of a player depends on the strategies in his neighborhood, as the payoffs in his neighborhood are involved. Self interactions can be neglected in our case. Hence, the game can be described as a deterministic cellular automaton with update rules. This is in contrast to the usual prisoner’s dilemma, where “only” update rules are necessary Nowak1992 . A modification of the cooperation cost leads to a modification of the update rules, see Appendix A for details. The extension of the usual prisoner’s dilemma to four strategies complicates the application of many tools for spatial games, as pair approximation Szabo1996 ; Szabo1998 ; Szabo2002 , fundamental clusters Killingback1999 ; Hauert2001 , or mapping to Ising models Herz1994 .
III.1 Segregation in the basic system
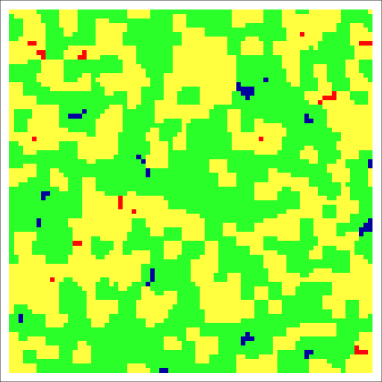
As the tolerant strategies can easily be exploited by intolerant players from the other group, they can only survive with sufficient support from surrounding players, cf. Fig. 1. Hence, the majority of players will be intolerant when the system reaches a static state. A cluster of intolerant agents can always survive, as the player in the center has the highest possible payoff in his neighborhood. In general, a tolerant player not interacting with intolerant players of the other tag can always survive. If he interacts with such players, the cooperation cost determines which kind of clusters are stable.

As expected Sigmund2001 , the system shows a strong segregation. Segregation between different agents in cellular automata has already been observed in the seminal paper of Schelling Schelling1971 . However, in our case segregation is not directly based on observable traits of others, but on mutual support. Most of the players are intolerant. Players that support others across the segregation borders are always exploited, they cannot survive if the cooperation cost is too high. This is consistent with the mean field theory Traulsen2003 , where only fixed points with intolerant players of one tag are stable.
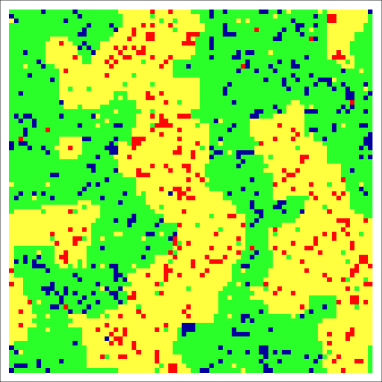
The situation is slightly different if stochastic mutations are included, as the system no longer becomes static. Tolerance mutations increase the fraction of the tolerant agents, as there is no equilibrium between tolerant and intolerant agents. The tolerance mutations lead towards such an equilibrium, while the population dynamics works against this equilibrium. Mutations of the tags can also destabilize clusters, as they introduce new agents into an environment that cannot produce such agents by the population dynamics. This leads to the dissapearance of small clusters, cf. Fig. 2.
The degree of segregation can be quantified utilizing the “spatial dissimilarity index” Duncan1955 defined as
| (7) |
where is the number of red (blue) agents in subregion and is the total number of red (blue) agents. Choosing a neighborhood as subregion we find (, ) indicating a strong degree of segregation, compared to for a random population. decreases less than when is increased ( for and for ).
Another possible measure for the segregation is the correlation length . For simplicity, the correlations have only been computed for one direction. The probability that an agent in the distance of has the same color decays as . For we find a correlation length of . The correlation length decreases slightly with increasing ( for and for ). As discussed above, mutations lead to the elimination of small clusters. Consequently, the correlation length is increased by mutations. After 100 time steps we find (, tags and tolerances are mutated with probability ), which is significantly higher than the correlation length in the system without mutations. The segregation properties are not altered if an asynchronous update is applied instead.
Overall, the segregation properties and correlation length are governed by the length defined by the size of the neighborhood window. They are only marginally influenced by the cooperation cost .
III.2 Emergence of spiral waves from a local conversion mechanism
The well mixed system was analyzed rigorously under the influence of biased conversions towards tolerance Traulsen2003 . These biased conversions show an alternating dominance of both groups in the mixed system.
Let us now introduce a local conversion mechanism that promotes tolerance in a similar way. We assume that an agent in a neighborhood consisting only of players of his own tag becomes tolerant, if he did not switch his strategy in the same time step due to selection. As only intolerant players utilize the ability to distinguish between tags this could be motivated by assuming some costs for this cognition system. These conversions lead to a rock-paper-scissors-like cycle with four strategies: If the neighbors are red, red agents become tolerant. In a red tolerant neighborhood intolerant blue agents have the highest payoff. If these dominate the neighborhood, the blue players should switch to the tolerant strategy. Finally, in such a neighborhood the intolerant red agents gain the highest payoff. This in contrast to Szabo2004a , where cyclic dominance is explicitly included in a system with asynchronous update.
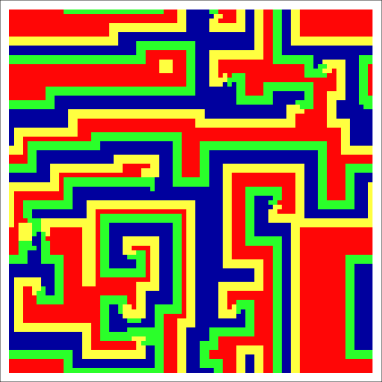
This cycle leads to the emergence of rotating spirals. The arms of these spirals are travelling waves, as in the game of rock-paper-scissors Frean2001 ; Kerr2002 or in public goods games with volunteering Szabo2002 ; Hauert2002b . The front of such a wave consists of intolerant agents, these are followed by tolerant agents of the same tag, cf. Fig. 3. These players can be exploited by intolerant players with different tag, hence a new front with a different tag can invade.
In the case of asynchronous update spirals are replaced by larger structures moving through the system. However, the mechanism for the movement of these structures is the same as for the spiral waves.
To locate the spiral tips quantitatively, the strategies are associated with discrete indices respectively. Interpreting those as four possible angles of a two-dimensional vector field, the curl can be calculated from a counterclockwise Stokes path on a block. For a continuous field of phases the topological charge of a closed path is defined by
| (8) |
In our case, both space and phase are discrete; the phase is measured in units of . Along the Stokes path we compute the phase differences
| (9) |
. In the discrete case a phase difference of two steps, or angle , may occur, and consistently can be interpreted as a zero contribution to the Stokes integral (leading to the possibility of half-valued partial charges as discussed below). Thus the phase differences are mapped on differences according to Table 1.
.
The topological charge is given by . A typical spiral tip consists of two equal topological charges in nearby positions. In the stationary regime, the generic case is a pairing of two spirals with different chiralities, i.e. different topological charges , near each other. For completeness, it should be noted that the resulting curl field is defined on the dual lattice shifted from the original one by a vector .
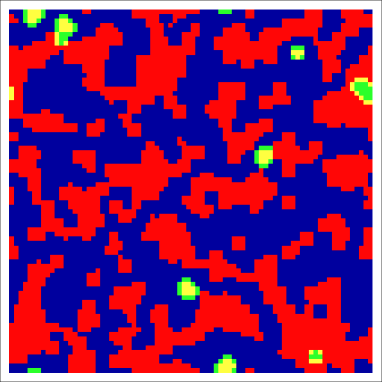
A comparison between the strategy distribution and the corresponding charge distribution is shown in Fig. 4.
For a random initialization we find an topological charge density of , which is consistent with the theoretical average value for independent topological charges . The spatial game dynamics quickly reduces the initial topological charge density. However, topological charges are generated and annihilated in a irregular manner until the system reaches a stationary state, see Fig. 4.
IV Asymmetric spatial system
It seems natural to assume that the two different groups can have two different costs of cooperation. For different costs and in Eq. (5) we find several distinct dynamical regimes, as dominance of red players, spiral waves, etc., cf. Fig. 5 for details.
Three different classes of transitions can be observed in Fig. 5. As in the symmetric game, the update rule is modified if one of the cooperation costs crosses a threshold cost as explained in Appendix A. Such transitions are vertical and horizontal lines in Fig. 5, e.g. the black dotted line in region () at . Note that the transitions shown in Fig. 9 (curve L) can be observed on the diagonal in Fig. 5. A second kind of threshold is determined by . These thresholds govern the dynamical behavior and divide the phase plane in Fig. 5 into the seven distinct regions. For red agents dominate the population, for stationary clusters of intolerant blue agents can survive. At travelling waves can appear which suppress stationary clusters of intolerant blue agents at . However, if the cooperation costs are sufficiently high one group can take over the whole population after a transient period (region () in Fig.5). For the roles of red and blue are exchanged. Finally, we have a third class of transitions which is given by linear equations . Here, the transition threshold is given by a certain slope as for the second kind of transitions. However, now one of the costs has to exceed a certain threshold as for the first kind of transitions, e.g. the white dotted line in region () of Fig. 5 is given by .
V Forecast rule
Here, we return to a system where both cooperation costs are the same. Let us assume that the local conversion rule towards tolerance is based on the new strategies of the neighbors and applies also for players that switched their strategies due to selection. Hence, now the update depends on the strategies in a neighborhood. Such a mechanism can be viewed as a primitive forecast. Players become tolerant if they expect their neighborhood to cooperate with them in the next generation. Even in this setting the local conversion rule leads to the emergence of spiral waves.
It is straightforward to add an equivalent mechanism that increases the fraction of intolerant agents. Tolerant agents can become intolerant in order to protect themselves against exploiters that refuse to cooperate. Therefore, we decrease the tolerance of an agent if at least two neighbors will probably exploit him in the next time step.
V.1 Cooperative fixed point
For we observe cooperation across the segregation borders for synchronous update. For asynchronous updates this fixed point does not become stable. The forecast rule leads to a stable coexistence of red and blue tolerant agents that provide help for everybody in their neighborhood, cf. Fig. 7. As a discrimination between different agents is no longer necessary, this can be seen as a primitive mechanism to overcome segregation. However, although the behavior of all agents is independent of the tags, the different tags are still segregated in space. The typical correlation lengths are larger than in the system without conversion mechanisms. For we find . The spatial dissimilarity index is only slightly higher, we observe .
Surprisingly the mechanism that enables agents to become intolerant increases the total fraction of tolerant agents, as it helps to stabilize tolerant domains. It is interesting that a mechanism that increases intolerance helps to eliminate intolerance. However, the mechanism bears some resemblance to the “tit-for-tat” strategy in the iterated prisoner’s dilemma Axelrod1984 , which punishes others for not cooperating, but can also forgive defectors reestablishing cooperation. One can even observe different stationary structures that change periodically in which intolerant agents survive, these resemble the “blinkers” in the “game of life” Gardner1970 . For the system reaches a stationary state only in very rare cases. However, parts of the system are still dominated by tolerant agents. In the case of this is not longer the case, here intolerant agents are found in the whole system.
Note that such a forecast rule cannot stabilize the cooperative fixed point in the spatial prisoner’s dilemma Nowak1992 , as defectors have always a higher payoff than neighboring cooperators.
V.2 Feedback Stabilization
For cooperation costs the tolerant fixed point is unstable. However, we can enforce cooperative behavior by global feedback on the cooperation costs. In social systems this corresponds to adapting taxes with respect to the state of the society. Specifying a desired fraction of tolerant agents we update the cost depending on the current fraction of tolerant agents as
| (10) |
This mechanism can stabilize points with even for . For each the cost fluctuates around a threshold that is determined by a change of the update rule, cf. Appendix A.
For the mean field theory we have a fixed point for Traulsen2003 , which is only stable for very low cooperation costs. However, this fixed point cannot be stabilized with the linear feedback from Eq. (10).
VI Conclusions
We have investigated spatial segregation, pattern formation, and control in a spatial version of a public goods game with cooperation based on the similarity between players. This type of model may establish a useful approach for a large variety of economical and social systems, where agents may act not only upon economical considerations, but also based on similarity or group membership. Generalizations to more detailed agents can be performed in a straightforward manner, yet our four state model already is capable of showing different phase states from stationary segregation to complex spatiotemporal behavior.
Particularly, it is interesting to note that a simple forecast rule can help to overcome segregation and lead to a stable pattern of cooperating agents, as regions with limited cooperation at the borders between groups are eliminated.However, the different groups are still segregated in space.
Appendix A Influence of the cost of cooperation
Due to the discrete nature of the total payoff, sharp steps appear when the cost of cooperation varies. As examples, we consider the dependence of the fraction of tolerant agents and the donationrate, i.e. the fraction of cooperative interactions, on the cost of cooperation, see Fig. 9. Due to the symmetry between tags, the fraction of red and blue tolerant agents can be computed from the fraction of tolerant agents , on average. In the same manner the fraction of intolerant agents of each group can be computed as . The donation rate includes additional information on the spatial distribution of the agents.
The steps that are observed in the order measures correspond to modifications of the update rule, as described in Nowak1992 . The steps occur at the same positions for all order measures. However, the step size is different for the fraction of tolerant agents and the donationrate, see Fig. 9.
Consider a player with a payoff and a second player with the payoff and a different strategy. If a third player with a payoff in the neighborhood of these two players searches for the best strategy, his update rule changes at if the sign of changes at . The corresponding values for are given by
| (11) |
where is the number of agents that support and is the number of agents that are supported by . For the situation shown in Fig. 10 we find for the center player , for his left neighbor and for his right neighbor . Hence, we find a modification of the update rule for
| (12) |
For the center player will switch tolerance and group membership. Other transitions can be found in the same way, although the method of fundamental clusters Hauert2001 is more complicated due to the high number of possible configurations.
Acknowledgements.
We thank H.G. Schuster for raising attention to this topic and stimulating discussions. A.T. acknowledges support by the Studienstiftung des deutschen Volkes (German National Academic Foundation).References
- (1) J. v. Neumann and O. Morgenstern, Theory of Games and Economic Behavior (Princeton University Press, Princeton, 1953).
- (2) J. M. Smith, Evolution and the Theory of Games (Cambridge University Press, Cambridge, England, 1982).
- (3) H. Gintis, Game Theory Evolving (Princeton Univ. Press, Princeton, 2000).
- (4) J. Hofbauer and K. Sigmund, Evolutionary Games and Population Dynamics (Cambridge Univiversity Press, Cambridge, England, 1998).
- (5) M. A. Nowak and K. Sigmund, Science 303, 793 (2004).
- (6) M. A. Nowak, A. Sasaki, C. Taylor and D. Fudenberg, Nature (London) 428, 646 (2004).
- (7) R. Axelrod, The Evolution of Cooperation (Basic Books, New York, 1984).
- (8) M. A. Nowak and K. Sigmund, Nature (London) 393, 573 (1998).
- (9) M. A. Nowak and K. Sigmund, J. Theor. Biol. 194, 561(1998).
- (10) M. A. Nowak and R. M. May, Nature (London) 359, 826 (1992).
- (11) K. Lindgren and M. Nordahl, Physica D 75, 292 (1994).
- (12) A. V. M. Herz, J. Theor. Biol. 169, 65 (1994).
- (13) G. Szabó and C. Töke, Phys. Rev. E 58, 69 (1998).
- (14) G. Szabó and C. Hauert, Phys. Rev. Lett. 89, 118101 (2002).
- (15) G. Abramson and M. Kuperman, Phys. Rev. E 63, 030901 (2001).
- (16) H. Ebel and S. Bornholdt, Phys. Rev. E. 66, 056118 (2002).
- (17) P. Holme, A. Trusina, B. J. Kim, and P. Minnhagen, Phys. Rev. E 68, 030901 (2003).
- (18) G. Szabó and J. Vukov, Phys. Rev. E 69, 036107 (2004).
- (19) C. Hauert and M. Doebeli, Nature (London) 428, 643 (2004).
- (20) W. D. Hamilton, Am. Nat. 97, 354 (1963).
- (21) P. E. Turner and L. Chao, Nature (London) 398, 441 (1999).
- (22) M. E. Taga and B. L. Bassler, Proc. Nat. Acad. Sc. 100, 14549 (2003).
- (23) R. L. Riolo, M. D. Cohen, and R. Axelrod Nature (London) 414, 441 (2001).
- (24) G. Roberts and T. N. Sherratt, Nature 499, 499 (2002).
- (25) C. Hauert (private communication).
- (26) K. Sigmund and M. A. Nowak, Nature 414, 403 (2001).
- (27) R. Axelrod and R. A. Hammond, The Evolution of Ethnocentric Behavior, in: Proceedings of the Midwest Political Science Convention, Chicago, Il, (2003).
- (28) G. Hardin, Science 162, 1243 (1968).
- (29) A. Traulsen and H. G. Schuster, Phys. Rev. E 68, 046129 (2003).
- (30) C. Hauert, Int. J. Bifurcation and Chaos 12, 1531 (2002).
- (31) G. Szabó and A. Szolnoki, Phys. Rev. E 53, 2196 (1996).
- (32) T. Killingback, M. Doebeli, and N. Knowlton, Proc. R. Soc. B 266, 1723 (1999).
- (33) C. Hauert, Proc. R. Soc. B 268, 761 (2001).
- (34) T. C. Schelling, J. of Math. Sociology 1, 143 (1971).
- (35) O. B. Duncan and B. Duncan, Am. Sociol. Rev. 20, 210 (1955).
- (36) G. Szabó and G. A. Sznaider, Phys. Rev. E. 69, 031911 (2004).
- (37) M. Frean and E. R. Abraham, Proc. R. Soc. Lond. B 268, 1323 (2001).
- (38) B. Kerr, M. A. Riley, M. W. Feldman, and B. J. M. Bohannan, Nature (London) 418, 171 (2002).
- (39) C. Hauert, S. De Monte, J. Hofbauer, and K. Sigmund, Science 296, 1129 (2002).
- (40) M. Gardner, Sci. Am. 223, 120 (1970).