Permanent address: ]Department of Physics (FEI), Slovak University of Technology, Ilkovičova 3, 812 19 Bratislava, Slovakia
Polyamorphism of ice at low temperatures from constant-pressure simulations
Abstract
We report results of MD simulations of amorphous ice in the pressure range 0 – 22.5 kbar. The high-density amorphous ice (HDA) prepared by compression of Ih ice at K is annealed to K at intermediate pressures in order to generate relaxed states. We confirm the existence of recently observed phenomena, the very high-density amorphous ice and a continuum of HDA forms. We suggest that both phenomena have their origin in the evolution of the network topology of the annealed HDA phase with decreasing volume, resulting at low temperatures in the metastability of a range of densities.
pacs:
64.70.Kb, 61.43.Er, 02.70.Ns, 07.05.TpIce at low temperatures exhibits complex behavior. Besides many crystalline forms two amorphous ones have been known for a long time. High-density amorphous ice (HDA) is prepared by compression of ordinary Ih ice to 12 kbar mishima1 and when recovered at ambient pressure it has a density of 1.17 g/cm3. Upon isobaric heating to 117 K, the density drops considerably and a second distinct form is found, called low-density amorphous icemishima1 (LDA) with a density 0.95 g/cm3. The transition between LDA and HDA can also be induced by pressure mishima2 ; mishima3 . The existence of two different amorphous forms of ice is crucial for the hypothesis of two kinds of supercooled watertwoliquid where LDA and HDA represent a continuation of the two distinct liquid phases below the freezing pointpooletal ; in this context the apparent sharpness of the transition between HDA and LDAmishima2 ; mishima3 is of special importance. Recently several new experimental resultsloerting ; klotz ; finney_vhda ; tulk ; guthrie ; mishima4 raised new questions about the polyamorphism of ice.
A new amorphous form of ice has been reported loerting , prepared by heating HDA under pressure of 11 kbar to K and cooling it back to K; when recovered at ambient pressure it has a density of 1.25 g/cm3. It has been called very high-density amorphous ice (VHDA) and characterized experimentally using neutron diffraction finney_vhda . Moreover, experimentstulk ; guthrie show that by heating HDA to temperatures intermediate between 80 K and 110 K the sample can be trapped in an apparent continuum of metastable structures between HDA and LDA. This suggests that there might be no sharp transition between the two forms. On the other hand, Ref.mishima4 , while also finding a continuum of HDA states, observed a propagation of the LDA-HDA interface, thus still favoring a sharp transition between the two forms. Possible implications of the new experiments have been discussedklug ; soper .
Here we suggest that both new phenomena, the VHDA and the continuum of HDA densities, originate from a relation between the density and the topology of the hydrogen-bonded network of the HDA phase. Our tool is constant-pressure molecular dynamics (MD) simulationft8 , using the classical TIP4P modeltip4p . This was found to reproduce well the transitions Ih – HDA and LDA – HDA, both qualitatively and quantitativelyklein ; pooletal ; okabe . Our system contained 360 H2O molecules and the total accumulated simulation time is more than 5 sft1 .
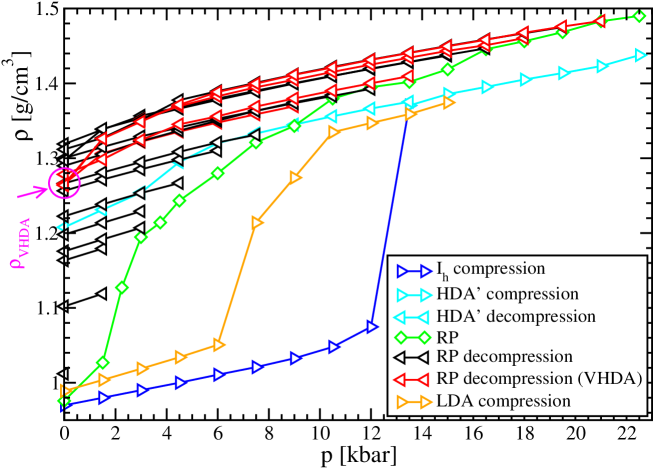
We first compressed the Ih ice at K, increasing the pressure in steps of 1.5 kbar. At 13.5 kbar a sharp transition occurs and the density increases by almost 30 % to 1.37 g/cm3 (Fig.1). The sample was then further compressed at K to 22.5 kbar and from 15 kbar decompressed to ; we call this as-prepared HDA phase HDA’. During decompression the HDA’ density gradually decreased and at reached the value of 1.21 g/cm3, close to the HDA experimental value of 1.17 g/cm3mishima1 . The radial distribution function (RDF) of HDA’ at is shown in Fig.2; it has a broad second peak between 3.3 and 4.6 Å, very similar to that of HDA at klotz . Inspired by the experimentsloerting that led to the discovery of the VHDA we decided to anneal the HDA’ phase at each intermediate pressure between 22.5 kbar and zeroft4 in order to search for possible new structures. Annealing was performed by heating up to K and subsequent cooling down to 80 K; the temperature was always changed in steps of 10 K. The phase obtained in this way will be called relaxed phase (RP). While in experiment an HDA’ sample heated at an arbitrary pressure might recrystallizepooletal ; klug ; klotz_recryst , in the time scale of a simulation this is not likely to happen. We are therefore restricted to exploring the (metastable) disordered structures. The RP phase prepared at each pressure was afterwards decompressed at K down to , decreasing the pressure in steps of kbar.
The O-O RDF’s of RP at different pressures are shown in Fig.2. We also calculated the O-H RDF (not shown) for RP at and kbar. Integrating between 1.5 and 2.25 Å we found at all pressures a coordination number of 2, indicating a fully hydrogen-bonded network. In order to characterize the evolution of the network topology we calculated the ring statistics rings for RP at all pressures. This is able to reveal information on medium-range order, which might not be easily extracted from the RDFtrachenko ; davila . We now discuss the rather remarkable behavior of the RP at increasing pressure in terms of density, RDF and network ring statistics (Fig.3) and show that there are 3 distinct regimes.
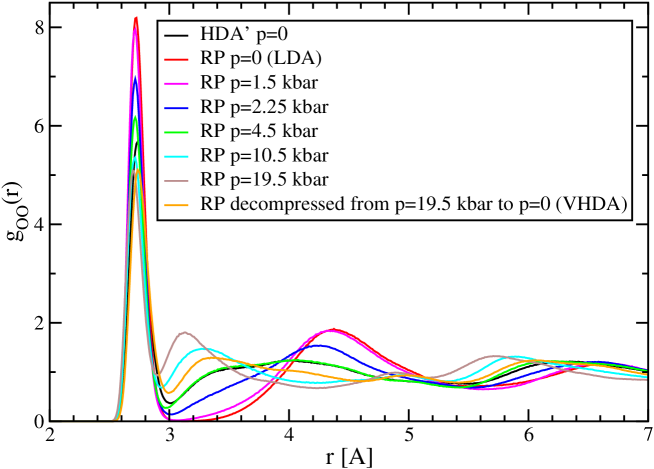
At the density after annealing reaches a value of 0.98 g/cm3. This agrees well with the experimental LDA value of 0.95 g/cm3. The RDF of this phase (Fig.2) exhibits at Å a very deep minimum between the first and second shell and a well-defined second shell peak at Å, very similar to that found experimentally for LDA in Ref.finney_hlda . The RP at thus coincides with the LDA as expected. At 1.5 kbar the density increases to 1.03 g/cm3 while the RDF remains very similar to that of LDA at , with the very deep minimum between the first and second shell; at both pressures the network is dominated by 6-membered rings. A substantial number of 7-membered rings is also present and upon change of pressure from 0 to 1.5 kbar this increases and approaches the number of 6-membered rings, while a smaller number of 5, 8 and 9-membered rings stays almost constant. The LDA phase from 1.5 kbar relaxes at to g/cm3, close to that of LDA prepared at .
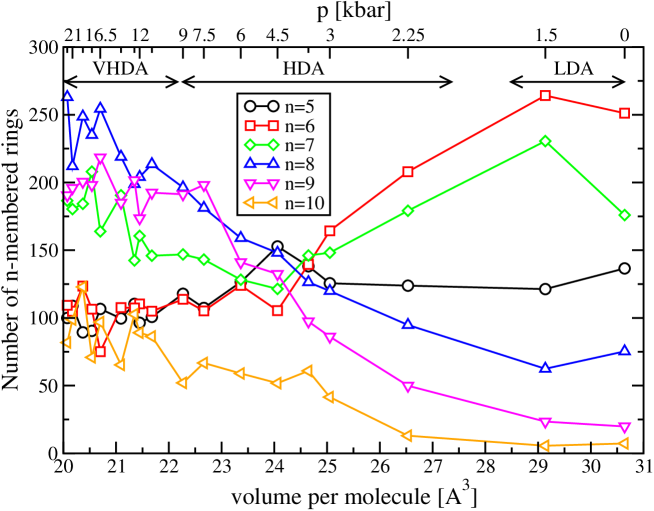
The properties of the RP at kbar are rather different. The density increases much faster and reaches a value of 1.13 g/cm3. The second shell peak of RDF drops and shifts to lower and at the same time RDF grows substantially in the region around Å, revealing the presence of interstitial moleculesklotz . A dramatic change is seen in the ring statistics: the number of 6 and 7-membered rings now drops fast and at the same time the number of 8 and 9-membered rings grows fast. This behavior is compatible with a transition from LDA to HDA occurring between 1.5 and 2.25 kbar; our resolution does not allow us to determine whether there is a discontinuous jump in the density of RP between 1.5 and 2.25 kbar. Around kbar the density growth slows down and RDF develops a broad second peak between 3.2 and 4.4 Å, quite similar to that of HDA’ at (Fig.2). Approaching kbar the ring statistics are definitely dominated by 8 and 9-membered rings; the network has thus undergone a substantial reconstructionsilica . When decompressed to , the structures from kbar relax to densities between 1.10 and 1.26 g/cm3; the decompression curves (black curves in Fig.1) are roughly parallel (also to the Ih and LDA compression curves below the respective transition pressures) and change slowly with pressure, indicating in all cases a similar compressibility, much lower than that of the RP.
For kbar, the number of 6 and 9-membered rings stabilizes, indicating that the network reconstruction has been partially completed; only the number of 7 and 8-membered rings continues to grownetworks . At the same time the density growth slows down further and the RDF develops a pronounced second peak at Å (Fig.2) while the original second shell peak at Å disappears completely. Upon decompression from pressures between 9 and 22.5 kbar the density of the RP converges to somewhat higher values ranging from 1.26 g/cm3 to 1.31 g/cm3. Several of these decompression curves, including the one from the highest pressure 22.5 kbar, however, upon decreasing pressure bend down more than others (red curves in Fig.1) and reach at practically the same density of about 1.26 – 1.28 g/cm3. It is then plausible to assume that the curves which stay at slightly higher density do so just because of our short observation time and upon a longer simulation they would all reach the same point. We note that in Ref.loerting the samples annealed at 11 and 19 kbar reached the same density upon decompression. The clear similarity of the RDF of RP decompressed from 19.5 kbar to that of VHDA recovered at in experimentfinney_vhda manifested in the distinct peak at Å, very close to the first shell peak, allows us to identify this form as VHDA. Our results are thus compatible with the existence at of a well-defined LDA state and a continuum of metastable HDA states with density below that of VHDAmishima4 .
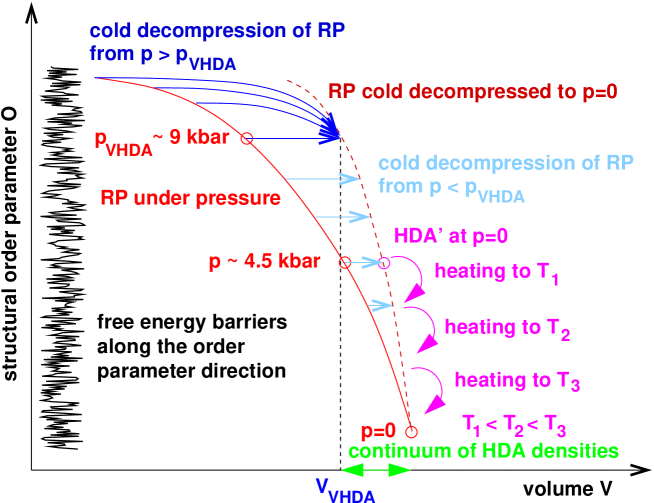
In order to interpret the observed behavior we represent all HDA structures in the – plane (Fig.4), where is the volume and is a structural order parameter related to network topology (e.g., the number of 6 and 8-membered rings). As discussed above (Fig.3), changes more slowly at small values of and faster at large values of ; this is represented by the downward curvature of the RP curve in Fig.4. The location of the point of RP represents the global minimum of the free energy of the HDA branch. RP is able to change its density with pressure in a substantial way due to the accompanying network reconstruction. This must involve breaking and remaking of bonds, which at any volume requires crossing a free energy barrier. Along the vertical direction of the free energy surface is therefore very rough, with a manifold of local minima. We now analyze how RP prepared at a certain pressure relaxes when decompressed at cold conditions ( K) to . An elastic relaxation of the compressed network, without reconstruction, corresponds to horizontal transition at constant . All such metastable minima fall at the dashed red curve in Fig.4. At small and large , a further increase of volume would require a large change of , resulting in a higher barrier. At the same time the gain of free energy is small since approaching its minimum the curve becomes increasingly flat; vertical relaxation of is therefore impossible and the system at cold conditions remains trapped in a continuum of metastable minima. This is the case for the black curves in Fig.1. We note that HDA’ as prepared under strongly non-equilibrium conditions by low-temperature pressure-induced amorphization of Ih ice is likely to be located away from the RP curve. Upon decompression to , however, it should also approach some point on the dashed red curve. In fact, the density as well as the RDF of our RP decompressed from 4.5 kbar (not shown) is very similar to that of HDA’ at . A relaxation of then becomes possible upon progressive increase of the temperaturetulk ; guthrie ; mishima4 ; the system approaches the global minimum of and at a certain point undergoes a transition to a more stable LDA form. As observed by X-ray scattering in Ref.tulk ; guthrie , with increasing annealing temperature the interstitial region around 3.5 Å is depleted and the second shell peak around 4.4 Å grows. The same qualitative trend is observed in our RDF’s of RP decompressed from kbar (not shown) upon decreasing . It is thus plausible to assume that by annealing HDA’ under pressure and subsequent cold decompression of the RP in simulation we have reached the region of states which experimentally can be accessed by progressive annealing of HDA’ at .
The above mechanism for stabilizing decompressed metastable states ceases to be operative at higher and low . Here an increase of volume is associated with just a small change of resulting in a smaller barrier; the possible gain in free energy is larger because the curve is steep. The probability of crossing the barrier is thus enhanced and a change of can occur even at K. This suggests the existence of a pressure such that for the RP upon decompression can relax with a change of and reach a certain lowest metastable volume . This corresponds to the behavior of the red curves in Fig.1, indicating kbar and equivalent to density 1.27 g/cm3. The origin of the VHDA might thus be kinetic rather than thermodynamic.
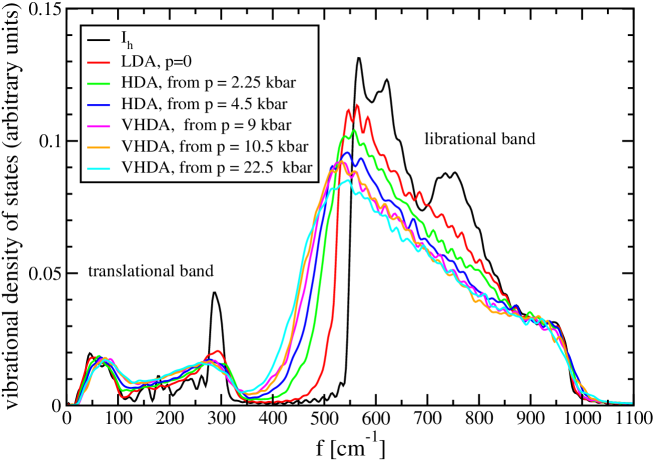
We calculated the vibrational density of states (VDOS) for hydrogen atoms (Fig. 5) in the RP decompressed from various pressures. The main trend is the pronounced shift of the band edge of the librational band to lower frequencies upon increasing density. This could be checked experimentally on the annealed samples with continuously varying densitytulk . It might also be possible to identify in vibration spectra direct fingerprints of network rings with specific size, as done for amorphous silicapasquarello .
In conclusion, in this paper we reproduced the new experimental facts, the VHDA and the continuum of HDA states at . Both phenomena appear to originate from the continuous evolution of the network topology of the HDA branch of the RP phase under pressure, resulting in a metastability of a range of HDA densities at and K. As revealed by the network ring statistics, HDA between 2.25 and 9 kbar represents a gradual evolution of LDA into VHDA; however, the derivatives of the number of rings with respect to volume change abruptly between LDA and HDA. This indicates that while the density difference between LDA and HDA might be smaller than previously thought there is a clear topological difference between the two phases. Therefore the existence of HDA and LDA is still compatible with the hypothesis of the two distinct liquid phases of water.
Our results suggest novel experiments. For instance the compressibility of HDA should be very different depending on whether or not one anneals the system after changing the pressure. The RP phase can be considered as the real equation of state of the amorphous water (as suggested in Ref.finney_vhda for the VHDA at kbar). Exploring the RP curve is a challenge for experimentalists due to the instability towards crystallization. Just as at a continuum of structures could be unveiled by cautious handling, it is quite possible that a similar feat can be accomplished at and the full RP line investigated, or at least a large portion of it.
We should like to acknowledge stimulating discussions with M. Bernasconi, V. Buch, M. Krack and M. L. Klein.
References
- (1) O. Mishima, L. D. Calvert and E. Whalley, Nature (London) 310, 393 (1984).
- (2) O. Mishima, L. D. Calvert and E. Whalley, Nature (London) 314, 76 (1985).
- (3) O. Mishima, J. Chem. Phys. 100, 5910 (1994).
- (4) Peter H. Poole et al., Nature (London) 360, 324 (1992).
- (5) Peter H. Poole et al., Phys. Rev. E 48, 4605 (1993). See also P. G. Debenedetti and H. E. Stanley, Physics Today, June 2003, p.40.
- (6) Thomas Loerting et al., Phys. Chem. Chem. Phys. 3, 5355 (2001).
- (7) S. Klotz et al., Phys. Rev. Lett. 89, 285502 (2002).
- (8) J. L. Finney et al., Phys. Rev. Lett. 89, 205503 (2002).
- (9) C. A. Tulk et al., Science 297, 1320 (2002).
- (10) Malcolm Guthrie et al., Phys. Rev. B 68, 184110 (2003).
- (11) O. Mishima, Y. Suzuki, Nature 419, 599 (2002).
- (12) Dennis D. Klug, Nature 420, 749 (2002).
- (13) Alan K. Soper, Science 297, 1288 (2002).
- (14) We used the Parrinello-Rahman MD methodpr , the Berendsen thermostat and a time step of 2 fs. Electrostatic interactions were treated by the particle-mesh Ewald method. The initial configuration was proton-disordered Ih ice with zero dipole moment.
- (15) W. L. Jorgensen et al., J. Chem. Phys. 79, 926 (1983).
- (16) John S. Tse and Michael L. Klein, Phys. Rev. Lett. 58, 1672 (1987).
- (17) I. Okabe, H. Tanaka, K. Nakanishi, Phys. Rev. E 53, 2638 (1996).
- (18) M. Parrinello, A. Rahman, Phys. Rev. Lett. 45, 1196 (1980).
- (19) All points in Fig.1 were equilibrated for 5 ns and averaged over 0.5 ns. Additional equilibration for 25 – 100 ns was performed during annealing at K and also at K after decompression from 1.5 – 6 kbar to .
- (20) Similar treatment was applied in Ref.loerting at and 19 kbar.
- (21) S. Klotz et al., Z. Kristallogr. 218, 117 (2003).
- (22) X. Yuan, A. N. Cormack, Comp. Mat. Sci. 24, 343 (2002).
- (23) Kostya Trachenko and Martin T. Dove, Phys. Rev. B 67, 064107 (2003).
- (24) L. P. Dávila et al., Phys. Rev. Lett. 91, 205501 (2003).
- (25) J. L. Finney et al., Phys. Rev. Lett. 88, 225503 (2002).
- (26) A similar change of ring statistics occurs in amorphous silica under pressure, see Ref.trachenko .
- (27) One of several crystalline phases found upon annealing HDA’ to Kklotz_recryst is ice XII which also has 7 and 8-membered rings. We do not find any indication of interpenetrating networks in our RP up to 22.5 kbar.
- (28) P. Umari, X. Gonze, A. Pasquarello, Phys. Rev. Lett. 90, 027401 (2003).