Rupture of a liposomal vesicle
Abstract
We discuss pore dynamics in osmotically stressed vesicles. A set of equations which govern the liposomal size, internal solute concentration, and pore diameter is solved numerically. We find that dependent on the internal solute concentration and vesicle size, liposomes can stay pore-free, nucleate a short lived pore, or nucleate a long-lived pore. The phase diagram of pore stability is constructed, and the different scaling regimes are deduced analytically.
I Introduction
Liposomal vesicle consists of a lipid bilayer separating the interior volume, containing an aqueous solution, from an exterior suspension. The vesicle membrane allows for a free exchange of water between the interior and the exterior of the liposome, with the flux determined by the membrane composition. On the other hand, lipidic membrane strongly inhibits passage of large molecules, in particular, if they contain ionized groups.
Liposomes are of great theoretical interest as the simplest model of a biological cell. They are also of great practical importance as vehicles for drug delivery. In the latter case liposomes are designed to contain a specific drug or a gene needed to fight the decease. The liposomal affinity for infected tissue can be increased by varying the membrane composition or including ligands which bind to specific receptors.
If a vesicle containing high internal solute concentration is placed inside a dilute solution, the osmotic influx of solvent into the interior of a vesicle can lead to its rupture. Whether, the rupture occurs depends on the membrane elasticity and on the internal solute concentration of the liposome. Rupture of the liposomal membrane results in formation of pores TaDvSa75 . This releases the membrane stress, but comes at a price of exposing the hydrophobic membrane interior (lipidic tails) to water. Once a pore is formed, the internal content of the vesicle begins to leak out, resulting in a decrease of membrane tension and eventual pore closure. We find that depending on the vesicle size and internal concentration of solute, pores can be either short or long lived. For long lived pores a scaling relation between the life-time of a pore and the size of the vesicle is found. The full phase diagram of pore stability in the concentration - vesicle size plane is constructed, and the different scaling regimes are deduced analytically.
The paper is organized as follows: In section II we review, the previously derived equations governing the nucleation and growth of a pore in an osmotically stressed vesicle LeId03 . In section III numerical solution of dynamical equations is presented. In section IV the phase diagram for different dynamical regimes is derived. In section V the rate of solute leak-out is determined and analytical estimates of the pore life-time are provided. Finally, in section VI the conclusions are presented.
II The model
As was already stressed in the introduction, the liposomal membrane allows for a free exchange of water between the exterior and the interior of a vesicle. The rate of this exchange is determined by the permeability of membrane, . On the other hand, lipidic membrane strongly inhibits exchange of solute molecules between the inside and the outside of a liposome. When a vesicle of high internal solute concentration is placed inside a solute-depleted medium, an osmotic pressure difference causes an influx of water into the vesicle. A vesicle then swells until the internal Laplace pressure is able to compensate the the osmotic pressure. The influx of water result in a build up of membrane stress which energetically favors membrane rupture and formation of pores. Pores are nucleated in the membrane through thermal fluctuations. Here we consider the opening of a single pore. The underlying assumption is that, once a pore is formed, stress is quickly released and the creation of a second pore becomes highly unlikely. This situation is quite different from what is encountered in electroporation. In that case opening of a pore does not fully release the membrane stress, which is induced by the transmembrane potential, and one finds a coexistence of pores with different sizesPaChAr79; WeCh96 .
The single pore assumption allow us to write simple equations governing the internal vesicle dynamics. Designating the difference between the internal and the external molar concentrations of solute as – and considering, for mathematical simplicity, a spherical vesicle of radius , and a circular pore of radius — the mass conservation leads to
| (1) |
where is the density of water, the osmotic current and is the leak-out velocity.
The osmotic current is determined by the permeability of the liposomal membrane and the difference between the target osmotic pressure
| (2) |
and the Laplace pressure,
| (3) |
inside and outside the vesicle. In the above expressions is the Boltzmann constant, is temperature, is the Avogadro number, and is the membrane surface tension. A simple phenomenological expression for the osmotic current of water into the vesicle is,
| (4) |
where the conversion factor accounts for the use of molar concentration of solute .
If is not too large, the membrane integrity will not be compromised, and a stationary state with will be achieved. Under these conditions the osmotic pressure is completely compensated by the Laplace pressure, resulting in a zero net flux of solvent. For sufficiently large internal concentration of solute, a stationary state will not be achieved before membrane ruptures. The leak-out velocity HaBr86 ; ZhNe93 ; SaMoBr99 ; BrGeSa00 of the internal content of a liposome is determined by the balance between the shear stress, proportional to , and the Laplace pressure inside the vesicle . For low Reynolds numbers HaBr86
| (5) |
where is the solvent viscosity.
The growth of a pore is controlled by the rate at which the membrane elastic energy is dissipated. Since the viscosity of membrane is five orders of magnitude larger than that of water, most of the energy dissipation is confined to the membrane interior DeMaBr95 ,
| (6) |
where is the membrane width and is the membrane viscosity. A lipid bilayer has low permeability to solute particles, in particular if they are charged, so that the internal solute concentration is modified only through the osmotic influx of solvent or the efflux of solute through an open pore, after the membrane has ruptured. The continuity equation expressing this is
| (7) |
where we have assumed that solute is uniformly distributed inside the vesicle. In the absence of a pore, efflux is zero, and the second term on the right hand side of Eqs. (1) and (7) disappears.
II.1 The membrane energy
The membrane energy consists of two terms. The elastic term , measuring the cost of increasing the membrane area beyond its equilibrium unstretched size , and the pore contribution resulting from the partial exposure of the hydrophobic lipidic tales to the aqueous environment.
For large osmotic pressures, which are of interest to us, the membrane thermal undulations can be ignored and the membrane elastic energy takes a Hooke-like form
| (8) |
where is the equilibrium surface area of an unstretched vesicle, is the total membrane area, and is the membrane elastic modulus HeSe84 ; EvRa90 ; SeIs02 . The membrane surface tension is
| (9) |
and the pore energy is
| (10) |
where is the pore line tension.
The typical values for the physical constants involved in the model are given in the Table 1.
II.2 The rupture condition
The total energy of a membrane containing a pore is . A cost of opening a pore of radius is then,
| (11) |
In Fig. 1 we plot as a function of for various ratios of . For , the membrane is relaxed and is the only minimum of . For bigger than the critical radius , the energy cost function develops a barrier located at
| (12) |
and a new minimum at
| (13) |
where
| (14) |
The critical vesicle size for appearance of a new minimum is determined by the condition or
| (15) |
Substituting the solution of Eq. (15) into Eq. (9) the critical surface tension for appearance of the second minimum is
| (16) |
¿From Eq. (4) we see that a minimum solute concentration
| (17) |
is necessary to develop the second minimum in at . However, concentration does not guarantee opening of a pore. Even if , the energy barrier to pore nucleation can be many high. Therefore, pores with radius less than will quickly re-seal, without having a chance to grow.

The probability of occurrence of a sufficiently large thermal fluctuation necessary to open a pore with is
| (18) |
The waiting time for opening a pore of radius is, therefore, very long unless
| (19) |
This equation, then, determines the size of a swollen vesicle
| (20) |
which is able to nucleate a growing pore. The membrane tension of such a liposome is approximately,
| (21) |
and the critical pore size is . The minimum concentration of solute necessary to reach this tension is
| (22) |
III Pore dynamics
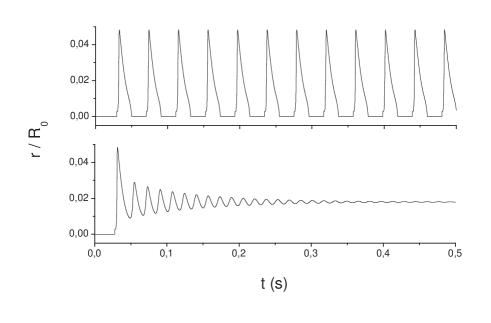
The rupture dynamics of an osmotically stressed vesicle proceeds as follows. At the vesicle starts swelling, its size and internal concentration controlled by Eqs. (1) and (7). As it swells, the membrane surface tension increase until and the energy function develops a new minimum. If the barrier height is less then , a pore of size is nucleated. From this moment the dynamics of the vesicle evolution is controlled by the set of Eqs. (1), (6) and (7) . On the other hand, if , the swelling continues without a pore nucleation until Eq. (19) is satisfied and a pore of radius opens. After a pore is nucleated, the internal content of the vesicle begins to leak-out, decreasing the membrane tension and leading to an eventual re-sealment of the pore. The cycle will be repeated until the internal concentration of solute drops bellow and a steady state with is established. In Fig. 2 we show the pore radius as a function of time for vesicles of three different sizes and initial concentration of solute .

We see that small vesicles are characterized by rapid opening and closing of pores, resulting in a periodic flickering with a characteristic time . On the other hand, larger vesicles are capable of nucleating a long-lived pore.
IV Phase diagram
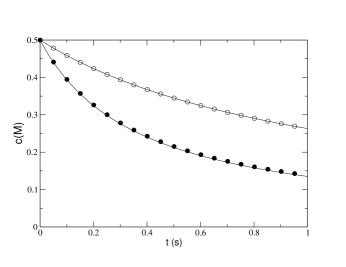
To better understand the details of the vesicle evolution, it is convenient to separate the membrane dynamics from the concentration dynamics. Since the internal solute concentration changes very slowly compared to the , see Fig. 4, as a first approximation we can take it to be constant.
In this case the vesicle evolution is controlled by Eqs. (1) and (6), which can be written as
| (24) |
| (25) |
where
| (26) |
and
| (27) |
The vesicle dynamics is governed by the fixed point (,), determined from and . The stability of the fixed point is controlled by the eigenvalues and of the Jacobian matrix
| (28) |
It is important to keep in mind that the coefficients of the Jacobian matrix are real and, therefore, the eigenvalues are either real or complex conjugates, . For all the parameters that we have investigated the eigenvalues are complex conjugates, and the stability is governed by . If , the fixed point is stable and a stationary state with a pore of size and vesicle of size will be established. On the other hand if the fixed point is unstable, and the pore will eventually close, see Figs. 5 and 6. A new pore will open when the membrane tension again reaches the value . This process will repeat indefinitely with the characteristic time .

The phase boundary, in the concentration-size plane , between the two dynamical regimes is determined by the condition or equivalently
| (29) |
which reduces to
| (30) |
Combining Eqs. (3) and (5), the leak-out velocity is
| (31) |
Differentiating with respect to the vesicle size
| (32) |
The change of surface tension with the pore size is given by
| (33) |
For large concentrations, and , the osmotic current can be approximated by
| (34) |
so that
| (35) |
At fixed point ,
| (36) |
where we have approximated and . Eq. (30) then reduces to a quartic equation for
| (37) |
Combining Eqs. (34) and (36), the phase boundary separating the regime of short-lived pores (region II) from the long-lived (infinite life-time) pores (region I) is
| (38) |
see, Fig.7.
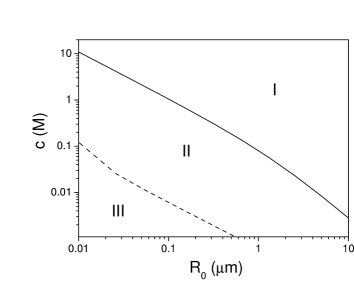
For small concentrations, the surface tension does not build sufficiently high to cause the membrane rupture (region III). The phase boundary between regions II and III is denoted by a dashed curve in Fig.7. The discontinuity in slope results from the nucleation barrier passing the threshold . Thus the right hand side of the II-III phase boundary is given by , while the left hand side
The role of the concentration dynamics is to make the system traverse through the different regions of the phase diagram, controlling the time of permanence in each regime.
V Dynamics of solute leak-out
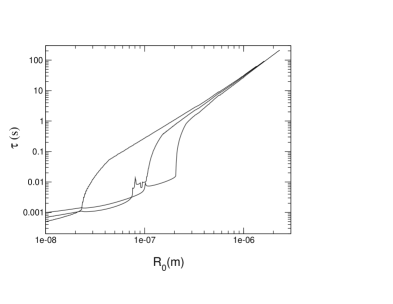
The critical size of a liposome , necessary for nucleating a long-lived pore, depends on the initial solute concentration. The larger is the solute concentration , the smaller will be the size of a vesicle which supports a long-lived pore. The long life-span of these pores is the result of a “wash-out” effect in which the osmotic flux is almost completely compensated by the leak-out rate of solute through the pore. When solute concentration inside the vesicle drops below the critical value, , the long-lived pore closes. This value is insensitive to the initial solute concentration , but depends strongly on the vesicle size .
Eq. (40) provides an almost perfect fit of the time dependence of the internal solute concentration, see Fig.4. The life span of a long lived pore can be approximated by the time it takes for the solute to go from the initial concentration to the critical concentration , below which the pore is no longer stable,
| (41) |
It is possible to derivate two limits for the critical concentration , see Appendix. Writing
| (42) |
for vesicles of radius
| (43) |
and for
| (44) |
and therefore the life-span of long-lived pores scales as
| (47) |
For the parameters used in this paper , so that Eq. (44) is consistent with the numerical findings, see Fig. 3.
The flickering time is approximately the time it takes for a vesicle to swell to size , needed to induce a liposomal rupture. During the swelling, internal concentration of solute changes very little, since , so that can be kept constant. Furthermore, for large initial solute concentrations, the osmotic current is , and Eq. (1) is easily integrated yielding,
| (48) |
On the other hand
| (49) |
Substituting Eq. (49) into Eq. (48) we obtain the expression for the flickering time,
| (50) |
where is given by Eq. (21).
VI Conclusions
We have presented a theory for nucleation and growth of pores in osmotically stressed liposomal vesicles. The model predicts that depending on the internal solute concentration and the liposome size, pores can be either short-lived — opening and closing with a characteristic time — or long-lived, with their life-time scaling with the size of the vesicle.
Long lived pores have been observed in red blood cell ghosts St70 ; StKa74 . No theory, up to date, was able to account for these long-lived pores. Holes were predicted to either grow indefinitely, which would result in ghost vesiculation, or to close completely BeBr99 . Our model provides a dynamical mechanism for pore stabilization, consistent with the experimental observations. However, for the specific case of red blood cell ghosts the ratio of must be adjusted to obtain the pore size observed in experiments. This is not surprising since the real biological cells, unlike liposomes, have a complicated internal cytoskeleton, which strongly affects the membrane elasticity.
In aqueous solutions the phospholipid membranes acquire a net negative charge. At physiological concentrations, of , the Debye length, however, is quite short, less then and the electrostatic interactions are strongly screened Le02 . We, therefore, do not expect that electrostatics will significantly modify the basic conclusions of our theory, beyond the renormalization of membrane line BeBr99 and surface tension. However, further, investigations in this direction are necessary and will be the subject of future work.
Finally, up to now we have not taken into account a diffusive efflux of solute through an open pore. The characteristic time for effusion can be estimated as LeIdAr03
| (51) |
where is the diffusion constant. Using , appropriate for small organic molecules such as sucrose, and , we see that for liposomes with , the time for effusion is s. This is comparable to the flicker time . Therefore, for small vesicles effusion is an important mechanism for loss of solute. On the other hand, for large liposomes with and above, effusion is only marginally relevant.
This work was supported in part by the Brazilian agencies CNPq and FAPERGS.
VII Appendix
Here we present a derivation of the limiting form of the phase boundary, Eqs. (42)-(44), separating the region I and II of the phase diagram, Fig. 7. Writing
| (52) |
Eq. (37) reduces to
| (53) |
with
| (54) | |||||
| (55) |
where
The solutions of a quartic equation like (53) can be written as
where y is the real root of the resolvent
Since the surface tension is non-negative, the physically relevant solution for x depends on the sign of and we can write
| (56) |
For an equation of the form there is a single real root if
and this real root is
| (57) |
This is precisely our case since and, therefore, . It is convenient to rewrite Eq.57 as
where
and
The psi function has the following asymptotic behaviors
| (61) |
Putting everything together we have
| (65) |
In the first case we obtain
| (66) |
and in the second case
| (67) |
Using the expressions for and , we obtain the equations (42)-(44).
References
- (1) C. Taupin, M. Dvolaitzky, and C. Sauterey, Biochemistry 14, 4771 (1975).
- (2) Y. Levin and M. A. Idiart, Physica A 331, 571 (2003).
- (3) J. Happel and H. Brenner, Low Reynold number hydrodynamics (Martinus Nijhoff, Dordrecht, 1986).
- (4) D. V. Zhelev and D. Needham, Biochim. Biophis. Acta 1147, 89 (1993).
- (5) O. Sandre, L. Moreaux, and F. Brochard-Wyart, Proc. Natl. Acad. Sci. USA 96, 10591 (1999).
- (6) F. Brochard-Wyart, P. G. de Gennes, and O. Sandre, Physica A 278, 32 (2000).
- (7) G. Debregeas, P. Martin, and F. Brochard-Wyart, Phys. Rev. Lett. 75, 3826 (1995).
- (8) W. Helfrich and R. Servus, Nuovo Cimento Soc. Ital. Fis. 3D, 1 (1984).
- (9) E. Evans and W. Rawicz, Phys. Rev. Lett. 64, 2094 (1990).
- (10) P. Sens and H. Isambert, Phys. Rev. Lett. 88, 128102 (2001).
- (11) H. T. Tien, Bilayer Lipid Membranes (Marcel Dekker, New York, 1974).
- (12) J. C. Weaver and Y. A. Chizmadzhev, Biolectrochem. Bioenerg. 41, 135 (1996).
- (13) T. Steck and et al, Science 168, 255 (1970).
- (14) T. Steck and J. Kant, Meth. Enzym. 31, 172 (1974).
- (15) M. D. Betterton and M. P. Brenner, Phys. Rev. Lett. 82, 1598 (1999).
- (16) Y. Levin, Rep. Prog. Phys. 65, 1577 (2002).