Field-induced avalanche to the ferromagnetic state in the phase-separated ground state of manganites
Abstract
Perovskite manganite compounds such as Pr1-x(Ca1-ySry)xMnO3 can be tuned to exhibit a metastable ground state where two magnetic/crystallographic phases coexist in zero magnetic field. Field-dependent neutron diffraction measurements on both poly- and single-crystal samples with a range of Pr, Ca, and Sr dopings(0.3x0.35 and y0.30) reveal that the charge-ordered, antiferromagnetic phase of the ground state suddenly and irreversibly jumps to the ferromagnetic state. The transition occurs spontaneously at some time after the field is set above a threshold field, indicating that once the transition is initiated an avalanche occurs that drives it to completion.
pacs:
75.47.Lx 75.30.Ds 75.30.Kz 77.80.DjManganese oxide perovskites display a variety of complex and interesting behavior resulting from the coupling of electronic, magnetic, and structural degrees of freedom. Goodenough (1955); Dagotto et al. (2001) One such phenomenon is the inhomogeneous coexistence of a charge and orbitally (CO) ordered antiferromagnetic (AFM) state with a structurally distinct ferromagnetic metallic phase (FMM) in a phase separated ground state. Experimental evidenceRaveau et al. (1995); Deac et al. (2001); Blake et al. (2002); Yaicle et al. (2003) and computational resultsBurgy et al. (2003) indicate the phases are arranged as FM domains embedded in a CO/AFM matrix. The delicate energy balance that exists between these phases is easily tipped by external perturbations such as magnetic fieldFernandez-Baca et al. (2002); Yoshizawa et al. (1995); Yaicle et al. (2003), electric fieldStankiewicz et al. (2000), electronHervieu et al. (1999) or x-ray irradiationCox et al. (1998), which destroy the CO/AFM phase and drive the system irreversibly into the FMM state.
A model system for such phase-separated behavior is the hole-doped Pr1-x CaxMnO3 (PCMO) system in the range x=0.3-0.45Jirak et al. (1985); Raveau et al. (1997); Martin et al. (1999), which can be fine-tuned by additional substitutions such as Sr for Ca, Co for Mn, or Ga for MnYaicle et al. (2003). An applied field gradually converts the AFM phase to the FMM phase as expected, but recent low temperature isothermal magnetization M(H) data for these PCMO compounds reveal novel jumps in the magnetization that occur at discrete threshold fieldsMahendiran et al. (2002); Hbert et al. (2002); Hardy et al. (2003a, b). The rapid onset of these jumps at low temperatures and their appearance in polycrystalline samples rule out the usual phenomena such as spin-flop or metamagnetic transitions; such transitions are only sharp for a narrow range of field directions with respect to atomic spin directions in the crystal, and they do not exhibit a sudden onset at low T (well below the magnetic ordering temperature)Carlin and van Duyneveldt (1977). To investigate the microscopic origin of these jumps in the magnetization, we have carried out field-dependent neutron diffraction and inelastic measurements on both polycrystalline and single crystal samples. We find that at low T both the charge and antiferromagnetic order parameters suddenly and irreversibly collapse above a threshold field, with a concomitant jump in the ferromagnetic order parameter. Our results indicate that there are two important factors leading to this unique behavior. One is the remarkable isotropy of the ferromagnetic system, which makes the internal magnetic energy, to a very good approximation, independent of crystallographic direction. The second factor concerns the lattice strainRadaelli et al. (2001); Hardy et al. (2003c) that develops at the boundaries between the FM and CO/AFM phases. This strain inhibits the smooth growth of FM domains, resulting in a stick-slip growth of domains. When one of the distorted CO/AFM domains does transform to the FMM phase, the net magnetization in the vicinity of this new FMM domain subsequently jumps, causing other CO/AFM regions to convert in an avalanchePaczuski et al. (1996); Hbert et al. (2002) into a new phase fraction of CO-AFM/FMM domains. The process is strongly time-dependent in that once the transformation is initiated, all (or a large fraction) of the sample transforms spontaneously. Once the FMM state is established, returning the field to zero leaves the system in the FMM phase, as there is no driving force to restore the CO/AFM state. The transformation then is completely irreversible, with the CO/AFM state only being restored by warming above the ferromagnetic Curie temperature ().
The samples investigated here were prepared by the floating zone technique and have three compositions of varying Sr doping; a 2.7 g Pr0.65(Ca0.75Sr0.25)0.35MnO3 (PCSMO75) single crystal, a 3.6 g textured polycrystalline sample and 5 g powder sample (for profile refinements) of Pr0.65(Ca0.70Sr0.30)0.35 MnO3 (PCSMO70), and a 1.4 g Pr0.7Ca0.3MnO3 (PCMO) single crystal. Zero field neutron data were collected at the NIST Center for Neutron Research on the BT7 triple axis spectrometer, and field dependent data on the BT2 and BT9 triple axis spectrometers in a vertical field superconducting magnet with a dilution insert. Diffraction data were taken with a pyrolytic graphite (PG) monochromator set to 14.7 meV, no analyzer, and coarse collimation (nominally 40′ ). Inelastic measurements on the PCSMO75 single crystal were taken on BT9 using either a PG(002) or Ge(311) monochromator, and a PG(002) analyzer. In all cases, we employed a PG filter to suppress higher-order wavelength contaminations. Complete powder diffraction data were collected at the Hahn-Meitner Institute at a series of fields (T = 1.5 K) with a vertical field magnet on the E9 spectrometer and a Ge (311) monochromator. Small angle neutron scattering data were collected as a function of temperature and time on NG7 SANS for the single crystal sample of Pr0.65(Ca0.75Sr0.25)0.35MnO3. A wavelength of = 10 Å and a = 0.22 were employed for the measurements. The sample was mounted in a closed cycle refrigerator equipped with Si windows. Transport measurements were made using a four probe AC technique and magnetization data were collected using a commercial SQUID magnetometer.
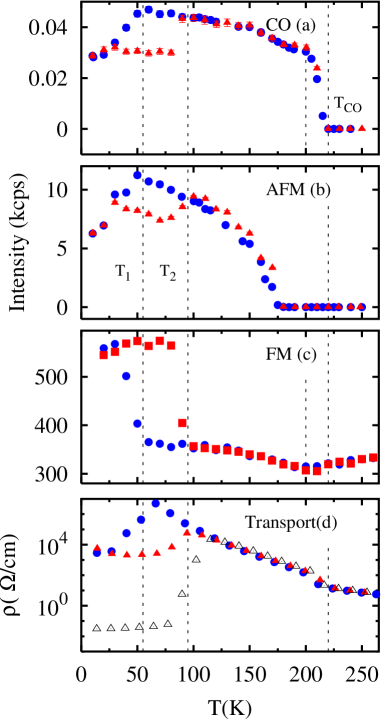
The competition between the CO/AFM and FM phases of PCSMO75 is evident in the zero-field order parameters shown in Fig. 1. Charge ordering, which occurs below TCO = 220 K, results in a structural distortion producing new peaks at positions such as (2 1 0) (Fig. 1(a)).not The distorted CO phase then orders antiferromagnetically at TN = 170 K (Fig. 1(b)). Integrated intensity data at the (1 0 0) Bragg peak as a function of temperature reveal the onset of FM order at Tc = 200 K, reflected in the CO data as a slight change in slope. Growth of the FM intensity, initially suppressed by the CO/AFM matrixBlake et al. (2002), begins to increase rapidly at lower temperatures, exhibiting the strong hysteresis seen in Fig. 1(c), with T1= 55 K on cooling and T2 = 95 K on warming. Changes in CO and AFM intensity are coincident with changes in the FM intensity at T1 and T2, demonstrating that the FM phase forms at the expense of the CO/AFM phase.
Changes in transport data, collected on a polycrystalline sample of PCSMO75, shown in the semi-log plot of resistance as a function of temperature (Fig. 1(d)), mirror the neutron results in Fig. 1(a)-(c). The CO transition is evident in the transport data as a slight increase in the resistance at 210 K, for both warming and cooling measurements. The resistance reaches a maximum upon cooling at 65 K, just before the temperature where the neutron data indicate a maximum in the CO phase. The rapid increase of ferromagnetism at 55 K results in a decrease of the CO phase concomitant with the decrease in resistance. The fall in resistance is attributed to a larger portion of the sample entering the conducting FM phase. Upon warming, the resistivity does not change until the FM phase falls below detectable levels in the neutron data, around 95 K. Zero field resistance data, collected in a field induced (5 T) FMM state, represented as in Fig. 1(d), indicate that the FMM state is eliminated at 110 K, just above the temperature where the FM signal disappears in the zero field data.
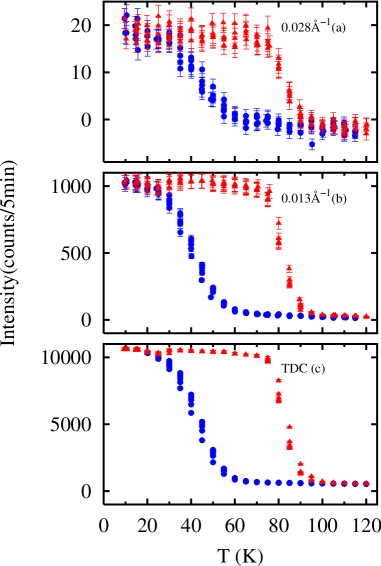
The SANS data as a function of temperature sampled at two q values are shown in Fig. 2(a), q= 0.0278 Å-1 and 2(b) q=0.0127 Å-1. These data have been processed by subtracting a high temperature background, T= 320 K, as well as correcting for detector and instrumental configurations. For a ferromagnet typically there are two contributions in a SANS measurement. The small Q intensity originates from domains and domain walls and tracks a power of the magnetization, while the intensity at the larger Q originates from (dynamic) spin correlationsLynn et al. (1998). Fig. 2(c) shows intensity integrated over the entire area of the detector (total detector counts) as a function of temperature. The maximum changes in intensity occur for the temperatures T= 50 K upon cooling and T= 90 K upon warming, consistent with the hysteresis in the zero field order parameters. The irreversibility demonstrates that the phase fraction population is metastable. The time dependence of the intensity was also checked by making five consecutive measurements at the same temperature. Over this 25 minute time span (five data sets at five minutes per point) the intensity drifts by a few percent, slowly increasing upon cooling and decreasing upon warming, indicating that the system has a long equilibration time. This drift is most apparent in Fig. 2(a). At higher q values (greater than 0.03 Å-1) one typically expects to see critical scattering for a second order ferromagnetic transition, but here the data only show the same sharp onset in intensity and hysteresis, indicating that ferromagnetism is already established in this temperature range.
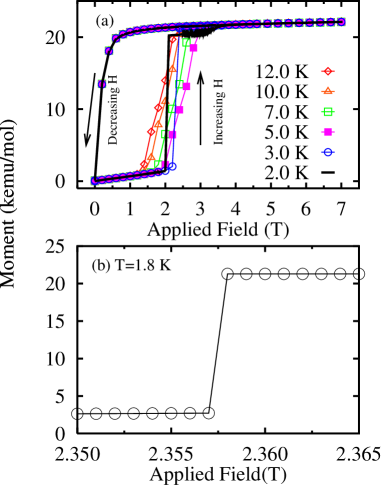
Isothermal magnetization, M(H), curves for a zero field cooled polycrystalline sample of PCSMO75 are plotted in Fig. 3(a) for several temperatures. Between successive measurements, the sample was warmed to 200 K, above the FM transition as observed in Fig 1(c)-(d), to avoid thermal hysteresis effects in M(H). Below 2 K, a sharp step in M(H) is visible in Fig 3(a) at 1.8 T. A second, smaller stepped transition is observed at H = 3.5 T in M(H) and both transitions are clearly present in the field dependent neutron data for PCSMO75, Fig 4. A comparison of M(H) curves in Fig. 3(a) shows the temperature dependence of the magnetic transition. As the temperature is elevated, the once sharp transition ( for T2 ) shows a weak temperature dependence, becoming rounded and moving to somewhat smaller magnetic fields. The data in Fig. 3(b) show the low temperature transition to be quite sharp, less than 10 Oe. The difference between the transition field between Fig. 3a and Fig. 3b is due to the size of the step used in approaching the transition.
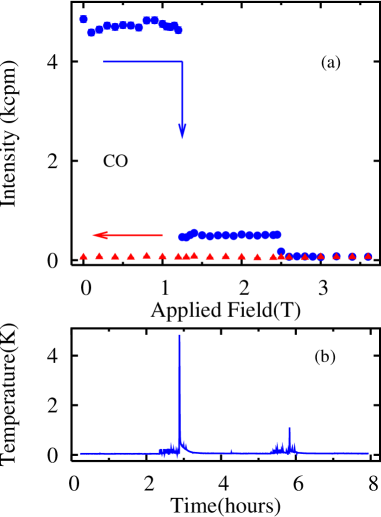
Fig. 1 shows that at low temperatures the CO/AFM and FM phases coexist in the ground state. An applied magnetic field will change the relative energetics of these two phases, and this behavior is clearly shown in Fig. 4(a) for the intensity of the CO peak. These data were obtained by zero-field cooling the sample to T = 80 mK. The CO intensity is observed to change abruptly twice, first falling by an order of magnitude at 1.25 T, then vanishing at 2.5 T. Both the field position and the size of these steps are in good agreement with the magnetization data for this sample as shown in Fig. 3. The results clearly demonstrate that the step increase in magnetization originates from a change in the phase fraction of CO/AFM to FM phases, rather than a jump in the size of the (atomic) ordered moment of the ferromagnet. For this particular sample, we observe two steps where the system is driven through a metastable FM/CO phase fraction to the homogeneous FMM ground state by the applied field. The difference in critical fields between the neutron data, collected at 0.08 K and the magnetization data, collected at 1.8 K, is a result of the weak temperature dependence for the transition, previously reported by Mahendiran et alMahendiran et al. (2002) in the isothermal magnetization data.
One of the interesting aspects of these steps is that there is a large release of energy when the transition occurs, as shown Fig. 4 (b). Here we plot the time dependence of the thermometer attached to the sample stage of the dilution refrigerator. At the first step there is a large spike in the temperature when the sample transforms, from 0.08 K to 5.0 K, which subsequently returns to 0.08 K over a period of about ten minutes. Similar behavior was observed at the second smaller step at 2.50 T, where the temperature reaches 1.4 K. We estimate the magnetic energy gained, E = B, by increasing the ferromagnetic phase fraction for the 1.25 T transition (assuming roughly half the sample converts as suggested by the powder diffraction fits for the PCSMO70 sample) is only 20% of that needed to raise the temperature by T = 4.9 K. It is therefore clear that substantial additional heat, associated with the collapse of the CO phase, must be released at this structural/magnetic transition. This observation is consistent with a very recent report of the magnetocaloric effect in manganite samples.Ghivelder et al. (2003)
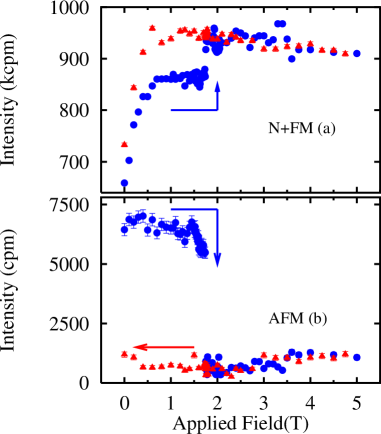
Reducing the Sr doping by 5%, from PCSMO75 to PCSMO70, results in a compound exhibiting only one low temperature step transition in the magnetization at 1.75 T. High resolution powder diffraction data show that initially 65 % of the sample is in the ferromagnetic phase, and this phase fraction jumps to 100% between 1.1 and 1.9 T. A detailed field dependence from the polycrystalline sample is shown in Fig. 5. We see (Fig. 5(a)) that the FM intensity increases smoothly with field as the domains reorient, and reaches a plateau around 0.75 T. At Hc = 1.75 T an 8% jump is observed in the FM intensity. The small size of this jump is attributed to the strong extinction for this peak, which has both a structural and ferromagnetic component. At the identical field the AFM intensity (Fig. 5 (b)) abruptly vanishes. The abrupt disappearance of the AFM intensity, combined with the sudden decrease of the CO intensity, demonstrates that the transition originates from a change in phase fraction rather than spin canting. The absence of an AFM signal in Fig. 5 (b) when the field is returned to zero indicates the system is locked into the FMM state.

The integrated intensity data shown in Fig. 5 were obtained by rocking the sample through the Bragg reflection. These data reveal the process by which the sudden collapse of the CO/AFM phase occurs. Fig. 6 shows three separate rocking curves for PCSMO70 collected at the AFM peak (T = 2.0 K) for three values of applied magnetic field. The data at 1.74 T show a normal rocking curve. The field was then increased to 1.75 T and another scan was initiated. The rocking curve is essentially identical to the data at 1.74 T until the sixth point, when the intensity suddenly vanishes. The collapse thus occurs spontaneously at some time after the field is set above the threshold, indicating that once the transition is initiated an avalanche occurs driving the transformation to completion. The transition appears instantaneous on the time scale of seconds needed to collect the data and explains the apparent perfect sharpness of the steps.
To compare the mixed-phase FM state with the field-induced FMM state we measured the ferromagnetic spin waves with inelastic neutron scattering. In both cases the spin waves are well described by a gapless, isotropic FM model; E where is the spin stiffness constantLynn et al. (1996). For the initial zero field-cooled FM state we obtained = 126(6) meV-Å2 , while we measured = 134(5) meV-Å2 for the FMM state. These values are consistent with other observations of D in the induced metallic stateFernandez-Baca et al. (2002), in contrast to the ferromagnetic insulating state where D is about of these valuesDai et al. (2001); Adams et al. (2003). The statistically insignificant difference in spin stiffness between states indicates that the zero-field phase-separated FM state is metallic and identical to the FMM state.
In the zero field phase-separated model of PCSMO, FM domains nucleate in a CO/AFM matrixBlake et al. (2002). Strain develops at the interface between the P21/m, CO/AFM phase, and the Pnma, FM phase, suppressing the growth of FM domains. An applied field aligns the randomly oriented FM clusters and lowers the energy of the ferromagnetic state. The spin wave data show the ferromagnet to be isotropic, so the energy of the FM state does not exhibit a significant dependence on the crystallographic direction of the applied field, explaining the rather remarkable result that identical behavior is observed for polycrystalline and single crystal samples. We believe the underlying cause of the discontinuous behavior to be a result of the lattice strain that develops at the interface between the CO/AFM and FM phases, which blocks the simple percolative growth of the FM domains that cause the CO/AFM state to become metastable at low temperatures. Indeed, simulations adjusted to model strain at the interface between the two phases successfully predict discontinuous steps in resistivity as a function of temperature, and such simulations may be used to model the stick-slip growth of the FM domains in these materials as a function of field.Burgy et al. (2003) Removing the thermal fluctuations at low temperatures sharpens the magnetic interfaces, making it more difficult for the distorted CO/AFM phase to be converted to the FMM phase. When the magnetic field overcomes this energy the CO/AFM domain can suddenly convert to the FMM phase. The net local magnetization increase combined with the release of strain held in the lattice distortions causes a sudden change in phase fraction. Collapse of the CO/AFM phase can be arrested at intermediate CO/AFM:FM phase fractions, resulting in multiple steps in the magnetism. This behavior also explains the effect of field cooling on the magnetization steps. Cooling the sample in an applied field increases the initial size of the FM domains, removing the lower energy (lower field) transitions. These FM domains have a larger surface area requiring greater fields to overcome the barrier to growth, increasing the transition field.
The collapse of the CO/AFM phase can be described quantitatively with avalanche theory if the collapse of the system is characterized by power law behavior in one or more parameters.Paczuski et al. (1996) In the present case the time scales are much too fast to measure with scattering techniques, but may be accessible by measuring the magnetic (Barkhausen) noise spectrum. The amplitude and frequency of the magnetic noise should be directly related to the rate of the collapse of CO/AFM domains into the FMM state, and if the collapse is an avalanche process then the noise frequency spectrum could be examined for power law behavior. It will be particularly interesting to determine whether the phase separated PCMO systems, with appropriately tuned compositions, can be connected to other complex systems such as vortex flowField et al. (1995) or sandpilesPaczuski et al. (1996) which display avalanching behavior.
This research was performed while F. M. Woodward held a National Research Council Research Associateship Award at the NIST Center for Neutron Research. This work was supported in part by the U.S. Department of Energy, Office of Science, under Contract No. W-31-109-ENG-38. Work at Penn State was funded by NSF grant DMR-01-01318.
References
- Goodenough (1955) J. B. Goodenough, Phys. Rev. 100, 564 (1955).
- Dagotto et al. (2001) E. Dagotto, T. Hotta, and A. Moreo, Phys. Rep. 344, 1 (2001).
- Raveau et al. (1995) B. Raveau, A. Maignan, and C. Caignaert, J. Solid State Chem. 117, 424 (1995).
- Deac et al. (2001) I. G. Deac, J. F. Mitchell, and P. Schiffer, Phys. Rev. B 63, 172408 (2001).
- Blake et al. (2002) G. R. Blake, L. Chapon, P. G. Radaelli, D. N. Argyriou, M. J. Gutmann, and J. F. Mitchell, Phys. Rev. B 66, 144412 (2002).
- Yaicle et al. (2003) C. Yaicle, C. Martin, Z. Jirak, F. Fauth, G. Andre, E. Suard, A. Maignan, V. Hardy, R. Retoux, M. Hervieu, et al., Phys. Rev. B 68, 224412 (2003).
- Burgy et al. (2003) J. Burgy, E. Dagotto, and M. Mayr, Phys. Rev. B. 67, 014410 (2003).
- Fernandez-Baca et al. (2002) J. A. Fernandez-Baca, P. Dai, H. Kawano-Furukawa, H. Yoshizawa, E. W. PLummer, S. Katano, Y. Tomioka, and Y. Tokura, Phys. Rev. B 66, 1 (2002).
- Yoshizawa et al. (1995) H. Yoshizawa, H. Kawano, Y. Tomioka, and K. Tokura, Phys. Rev. B 52, R13145 (1995).
- Stankiewicz et al. (2000) J. Stankiewicz, J. Ses, J. Garca, J. Blasco, and C. Rillo, Phys. Rev. B 61, 11236 (2000).
- Hervieu et al. (1999) M. Hervieu, A. Barnab, C. Martin, A. Maignan, and B. Raveau, Phys. Rev. B 60, R726 (1999).
- Cox et al. (1998) D. E. Cox, P. G. Radaelli, M. Marezio, and S.-W. Cheong, Phys. Rev. B 57, 3305 (1998).
- Jirak et al. (1985) Z. Jirak, S. Krupicka, Z. Simsa, M. Dlouha, and S. Vratislav, J. Magn. Magn. Mater 53, 153 (1985).
- Raveau et al. (1997) B. Raveau, A. Maignan, and C. Martin, J. Solid State Chem. 130, 162 (1997).
- Martin et al. (1999) C. Martin, A. Maignan, M. Hervieu, and B. Raveau, Phys. Rev. B 60, 12191 (1999).
- Mahendiran et al. (2002) R. Mahendiran, A. Maignan, S. Hebert, C. Martin, M. Hervieu, B. Raveau, J. F. Mitchell, and P. Schiffer, Phys. Rev. Lett 89, 286602 (2002).
- Hbert et al. (2002) S. Hbert, A. Maignan, V. Hardy, C. Martin, and M. Hervieu, Solid State Comm. 122, 335 (2002).
- Hardy et al. (2003a) V. Hardy, A. Maignan, S. Hebert, C. Yaicle, C. Martin, M. Hervieu, M. Lees, G. Rowlands, D. M. K. Paul, and B. Raveau, Phys. Rev. B 68, 220402(R) (2003a).
- Hardy et al. (2003b) V. Hardy, A. Maignan, S. Hebert, and C. Martin, Phys. Rev. B 67, 024401 (2003b).
- Carlin and van Duyneveldt (1977) R. L. Carlin and A. J. van Duyneveldt, Magnetic Properties of Transition Metal Compounds (Springer-Verlag, 1977).
- Radaelli et al. (2001) P. G. Radaelli, R. M. Ibberson, D. N. Argyriou, H. Casalta, K. H. Anderson, S.-W. Cheong, and J. F. Mitchell, Phys. Rev. B 63, 172419 (2001).
- Hardy et al. (2003c) V. Hardy, A. Maignan, C. Martin, and B. Raveau, Journal of Magnetism and Magnetic Materials 264, 183 (2003c).
- Paczuski et al. (1996) M. Paczuski, S. Maslov, and P. Bak, Phys. Rev. E 53, 414 (1996).
- (24) Here we use cubic (Pmm) notation for simplicity, where . In proper orthorhombic (Pnma) notation CO occurs at ( 0 4), AFM at ( 0 ) and FM at (1 0 1) with .
- Lynn et al. (1998) J. W. Lynn, L. Vasiliu-Doloc, and M. Subramanian, Phys. Rev. Let. 80, 4582 (1998).
- Ghivelder et al. (2003) L. Ghivelder, R. S. Freitas, M. G. das Virgens, H. Martinho, L. Granja, G. Leyva, P. Levy, and F. Parisi, arXiv:cond-mat 0308141, 5 (2003).
- Lynn et al. (1996) J. W. Lynn, R. W. Erwin, J. A. Borchers, Q. Huang, A. Santoro, J.-L. Peng, and Z. Y. LI, Phys. Rev. Let. 76, 4046 (1996).
- Dai et al. (2001) P. Dai, J. Fernandez-Baca, E. Plummer, Y. Tomioka, and Y. Tokura, Phys. Rev. B 64 (2001).
- Adams et al. (2003) C. Adams, J. Lynn, N. V. Smolyaninova, A. Biswas, R. Greene, W. R. II, S.-W. Cheong, Y. Mukovskii, and D. Shulyatev, arXiv:cond-mat 0304031, 13 (2003).
- Field et al. (1995) S. Field, J. Will, F. Nori, and X. Ling, Phys. Rev. Lett. 75, 1206 (1995).