Relation between driving energy, crack shape and speed in brittle dynamic fracture
Abstract
We report results on the interrelation between driving force, roughness exponent, branching and crack speed in a finite element model. We show that for low applied loadings the crack speed reaches the values measured in the experiments, and the crack surface roughness is compatible with logarithmic scaling. At higher loadings, the crack speed increases, and the crack roughness exponent approaches the value measured at short length scales in experiments. In the case of high anisotropy, the crack speed is fully compatible with the values measured in experiments on anisotropic materials, and we are able to interpret explicitly the results in terms of the efficiency function introduced by us in our previous work [A. Parisi and R. C. Ball, Phys. Rev. B 66(16) 165432 (2002)]. The mechanism which leads to the decrease of crack speed and the appearence of the logarithmic scaling is attempted branching, whilst power law roughness develops when branches succeed in growing to macroscopic size.
pacs:
62.20.Mk, 83.60.Uv, 46.50.+aI Introduction
There are two questions in the field of fracture mechanics to which intense research has been devoted in recent years. The first concerns the terminal speed predicted by the continuum theory F-90 which does not match the maximum speed measured in experiments.KOS-74 ; FGMS-91 ; FGMS-92 Terminal crack speeds are usually found to vary in a range between about of the Rayleigh speed in anisotropic materials,F-71 ; HB-66 ; WK-94 down to values as low as for more isotropic materials.KOS-74 ; FGMS-91 ; GFMMS-93 The Rayleigh surface wave speed is the terminal crack speed expected in the continuum theory;F-90 ; FM-99 beyond it the continuum solutions show compressive sign to what should be the crack opening stress component ahead of the crack tip.111 This is displayed explicitly for Yoffe’s crack solutionsY-51 in Ref. F-90, and can also be inferred from the results for climbing edge dislocations in Ref. WW-80, . The experimental maximum speed is usually accompanied by tip branching which is also not well explained. What controls the instability which leads to branching? What sets the terminal crack speed? Both the continuum theory and computer investigations have suggested that the answer to these questions lies in the mechanism through which energy is dissipated at the crack tip.FM-99
The second question involves the roughness exponent governing the self-affine scaling of height fluctuations of fracture surfaces. Recent measurements DNBC-97 have shown how this quantity has a universal behaviour in that it takes a value of at “short length scales” (in experiments this usually corresponds to nanometer scales) and a value of at “large scales”, the two regimes being separated by a material dependent crossover length. In addition, a logarithmic scaling of fracture surfaces has been theoreticallyBL-95 ; REF-97 and experimentallyLB-95 found in the limit of quasi-static crack advance in brittle materials. Despite numerous attempts to describe the universal character of such behaviour, the question of what controls the value of the roughness exponent and why fractures tend to grow rough surfaces is still open.
The two problems have repeatedly appeared to be connected. Experiments performed on polymethilmethacrylate (PMMA) have shown that beyond a critical crack speed, the crack tip starts to oscillate leading to the formation of structures on the crack surface and to a departure of the crack speed from that expected from the continuum theory.FGMS-91 ; FGMS-92 The same phenomenology was observed in simulations, where departure from steady state propagation for cracks exceeding a threshold speed was observed, with zig-zag motion and formation of microstructures.ABRR-94 Molecular dynamics simulations of crystalline silicon showed that cracks can dissipate large amounts of energy, up to seven times the energy needed to create a smooth surface as estimated in the framework of the continuum theory, the suggestion being that this energy goes into lattice oscillations.HM-98b
The idea that the energy available does not all go into fracture work is not new. Analytical studies of planar crack advance in a lattice by Slepyan had already shown that the presence of the lattice leads to an important excess of energy being radiated from a crack at both low and high speeds,S-81 and that crack propagation at low speeds is unstableS-83 . More recently, Marder and Liu ML-93 have studied a lattice model for fractures, concluding that it is lattice oscillations which limit the range of possible crack speeds.ML-93 ; M-99
In a recent paperPB-02 we have shown how such energy radiation at the crack tip due to phonon emission is the crucial mechanism for crack propagation. The intensity of the radiated energy is a function of the crack speed, ruling out stable crack growth at low speeds. The dependence of the crack speed is in agreement with the analytical results of Slepyan.S-81 ; S-83 The instability at low crack speeds also corresponds to what suggested in Ref. S-83, and to the results obtained by Marder and Liu.ML-93 ; M-99 Our results suggest a way to relate the intensity of the radiated energy directly to the phonon band structure. The relation between this approach and the results of Marder et al.M-99 ; HM-99 ; FM-99 is discussed in Ref. PB-02, . The mechanism proposed has been investigated in the limiting case of planar cracks, but the analysis becomes more difficult in presence of branching. However there is clear simulation evidence in two dimensions that crack branching is sensitive to the lengthscale at which the continuum description breaks down.FNR-01
The mechanism that leads to branching has not yet been fully unravelled. The first hint to the understanding of such phenomenon came from YoffeY-51 who showed that beyond a critical crack speed, the hoop stress has a maximum at a definite angle with respect to the direction of crack propagation. This has attracted considerable discussion as experiments have shown branching at crack speeds which differ from the prediction of Yoffe.CK-84 ; FGMS-92 ; GFMMS-93 Simulations and experiments however seem to agree that the mechanism of branching could be connected to the terminal crack speed.FGMS-92 ; XN-94 ; MERZ-00
In this work we will show that in our simulations the main mechanism that limits the crack speed for a free running crack is attemped branching. Cracks constrained on a plane reach high speeds compatible with the speeds measured in highly anisotropic materials, which we are able to explain in terms of the efficiency function introduced in our previous work.PB-02 We will also show that branching is responsible for the roughness exponent of the fracture surfaces: attempted branching roughens the crack surface with a logarithmic scaling first and, when macroscopic branches develop, with a roughness exponent close to the value measured at short length scales. At the same time, the crack speed is drastically reduced due to the attempted branching mechanism to values comparable with those measured in experiments, and gradually rejoins the efficiency description for high loadings.
The model used for these simulations has been extensively described in our previous work,PB-02 and its distinctive features are reviewed in section II. In section III we discuss the origins and effect of both disorder and anisotropy, and show how to implement disorder in the model and control the driving energy. Results on the crack speed for both planar and non-planar cracks are described in section IV, whilst the scaling of crack surface roughness for different driving regimes is discussed in section V. An attempt to simulate disconnected fractures is reported in section VI and finally we draw conclusions in section VII.

II The model
The model used in these simulations is an application of the finite element scheme and has been fully described in Ref. PB-02, . The elastodynamic description is obtained by discretizing space on an fcc lattice and connecting neighbouring lattice points with (non-filling) tetrahedral elements. We then solve the Euler-Lagrange equations obtained by using the discretized form of the Lagrangian of continuum elasticity:
where is the displacement field at site and is the stress tensor at element , the index spanning all lattice points and the index spanning all tetrahedral elements. The stress tensor is related to the displacement field by the standard tensorial relation of continuum elasticity and is a volume element related to the discretization scheme used. No mechanism of dissipation is active, but due to the discreteness introduced waves are radiated from the crack tip with an intensity which is non linear in the crack speed, revealing a selection rule for the crack speed itself.
Rupture is simulated by irreversibly setting the elastic constants and to zero in any tetrahedral element where the elastic energy stored within becomes greater than a pre-determined fracture energy. This is not the only possibility for a rupture criterion: quite recently, Heizler, Kessler and LevineHKL-02 ; KL-01 have studied the consequence of having a set of continuous force laws as opposed to the usual piecewise discontinuous force laws we use. Their results suggest that the nature of the force law could change the stability limit for high speed crack motion and, at least in mode-I fractures, for low crack motion. Using finite elements, a continuous force law was used by JohnsonJ-92 to study the extension of the process region for moving cracks. Needleman implemented crack rupture in a finite element model using surface decohesion.N-87 The model was used both in the study of crack growth in brittle solidsXN-94 and in the study of interfacial crack growth.XN-95a ; XN-95b It was found that a crack constrained to a plane can approach the Rayleigh speed, whilst when unconstrained, crack branching and reduction of the terminal crack speed were found. A similar behaviour is found in our simulations.
Our model has been used in our previous work in the simplified case of two dimensions, to simulate planar cracks running at fixed speed. In the present article, we present results of full three-dimensional simulations, in which both the condition of fixed crack speed and planarity are released, and the crack advance is only controlled by a Griffith criterion. In the continuum description, the Griffith criterion states that a crack will advance only if the macroscopic energy delivered to the crack tip exceeds the fracture work necessary to create new surface:
If , the excess of energy is usually considered the source of kinetic energy for crack advance, so if the loading is just sufficient to have the crack propagate, the crack should advance quasi-statically. Both simulations and experiments show that this is not the case: cracks do accelerate rapidly towards a limiting crack speed which depends on the material.AH-76 ; SDPM-88 ; FGMS-92
The solution of the puzzle is the presence of an alternative mechanism of energy dissipation due to the discreteness of matter at the microscopic level, a mechanism which is not included in the continuum elastodynamic description. Due to the discreteness, the macroscopic energy release rate can be equated to the sum of two microscopic contributions:
where and are respectively the breakage energy release rate, which is the portion of the available energy going into fracture work, and the phonon energy release rate which is the portion of the available energy radiated as phonons. The breakage energy release rate can be expressed as:
| (1) |
by introducing the efficiency . In the case of a strip geometry with fixed displacements at the top and bottom boundaries, the macroscopic energy release rate is a constant independent of the crack speed:F-90 . Hence, for this special case the efficiency becomes the sole source of velocity dependence, thus separating the effect of local discreteness from the effect of the macroscopic external loading. Moreover, the efficiency has been shown to depend only on the lattice geometry and crack speed, being local to the crack tip and independent of the macroscopic dynamical history.PB-02
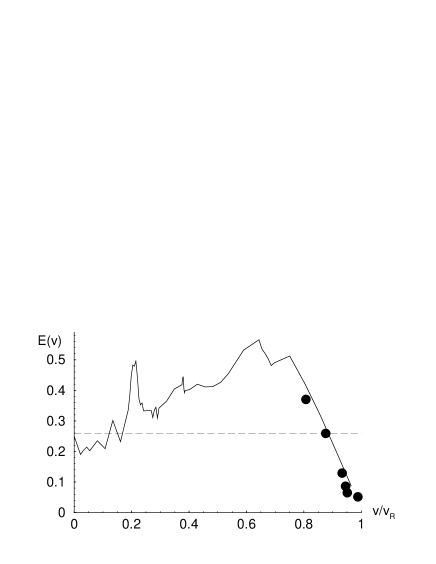
The speed dependence of the efficiency for our fcc lattice model is shown in fig. 1. Although the overall increase of with the crack speed still remains to be quantitatively understood, the drop of the efficiency at the Rayleigh speed as well as the fine structure are well understood and correspond to resonant emission, when emitted waves have a group velocity matching the crack speed itself. In particular, we expect the drop at the Rayleigh speed to be a feature common to all materials, as that resonance arises in the continuum limit. The efficiency for energy transfer into bond breakage is well below unity even for zero speed, as can clearly be seen in figure 1. This is because when a lattice element (tetrahedron) breaks at the crack tip, others around recoil dynamically and that recoil energy is ultimately radiated as sound waves.
A crack will only advance if the energy available at the crack tip is sufficient to create new surface. This translates the Griffith criterion in presence of discreteness into a condition of steady crack growth given by:
| (2) |
the difference from the macroscopic energy release rate being converted into phonons. In the case of a strip geometry with fixed displacements at the top and bottom boundaries, the threshold to initiate crack advance is given by and therefore if the loading is maintained only cracks with speed such that can propagate, leading to from the data of figure 1. We have further argued in Ref. PB-02, that only the more limited regions where should be sustainable.
One can of course load a sample above the quasistatic threshold, with
where . In this case the condition for sustained crack propagation becomes
| (3) |
and by reference to fig. 1 we see that the higher loading can sustain higher crack speeds, as might be expected.
III The role of disorder and anisotropy
Discretization naturally introduces preferred directions in space and therefore simulations are characterized by some level of anisotropy. In the absence of disorder, a square (cubic) lattice acts as a planar guide for the advancing crack. This phenomenon, known as lattice trapping, was predicted by Thomson, Hsieh and RamaTHR-71 and described by Holland and MarderHM-98a who observed it in molecular dynamics simulations of silica samples. Experiments also show that it is possible to obtain atomically flat fracture surfaces in real crystalline materials by using sufficiently small and homogeneous loadings.HHMS-99
The majority of the experiments on cracks produce non-planar, rough and branched cracks. The departure from the planar geometry forced by the lattice trapping is due to two different contributions. First, the magnitude of the applied loading which influences the energy delivered to the crack tip: the higher the value, the larger the possibility for the crack to open out of plane branches due to the increasing transversal stresses. Second, disorder in the material (equivalently disorder in the breakage rule) can drive the crack on non-planar paths.
Disorder is naturally present in all materials and comes from a variety of different sources. Atomic vacancies, inclusions, dislocations and grain boundaries are all sources of disorder able to influence the macroscopic response. Disorder strongly reduces the effects of anisotropy by increasing the probability of deviations from planarity. This is the main reason why a high level of disorder was included in the simulations presented in this article. The easiest way to introduce it (and the way followed by us) is to introduce a locally variable fracture energy which varies according to some well defined distribution: although very simple, the uniform distribution accomplishes this task extremely well. If is the fracture energy in the absence of disorder, local fracture energies can be extracted by a uniform distribution centered on and ranging between and ; this ensures that the mean fracture energy corresponds to the fracture energy in the absence of disorder.
In the presence of disorder even a static planar test crack has different tetrahedra along the crack tip becoming breakable at different loadings, whereas without disorder they all became breakable at the same loading . With disorder we defined the reference loading (corresponding to ) to be the value of at which 50% of crack tip tetrahedra in a planar static test crack are not breakable.
In practice modestly lower loadings (e.g. ) can still lead to crack propagation, as breakage of vulnerable tetrahedra along the crack edge leads to stress concentration at and around more resistant tetrahedra. Higher values of lead to more heavily damaged samples.
IV Free-running fracture simulations in three dimensions
We now focus on cracks when the constraints of fixed crack speed and shape are released. A fixed displacement is applied to both top and bottom faces, and a starting notch is prepared on the front face. The starting notch is long enough to start the simulations in the long crack limit. Periodic boundary conditions are applied to the side faces. The front and back faces are left stress free.
Each tetrahedron in the sample was given a pre-assigned fracture energy drawn from a broad uniform distribution centered on as described in the previous section. At each timestep the energy of each tetrahedron is evaluated, and those in which this exceeds their fracture energy are broken by setting the two elastic constants . The presence of disorder leads to breakage of isolated tetrahedra as soon as the simulation starts. A condition of connected fracture is imposed by allowing only neighbours of already broken tetrahedra to break. This simplifies the track of the crack tip in order to measure its speed. The condition of connected fracture prevents the formation of precracks in front of the crack tip. In practice, if this condition is released there is essentially no difference in the results for moderated loadings. We will see in section VI that for high loadings this can lead to a different morphology for the averall fracture process.
| (a) Planar cracks with disorder | ||
|---|---|---|
| Histogram meas. | Average tip meas. | |
| (b) Non-planar cracks: | ||
| Histogram meas. | Average tip meas. | |
| (c) Non-planar cracks: | ||
| Histogram meas. | Average tip meas. | |

Each simulation starts from the sample relaxed to its configuration of minimum energy, and continues until the sample is broken into two halves. We wait until the number of broken tetrahedra per timestep is reduced to a negligible fraction of its peak and then the sample is divided into two halves according to the sign of the vertical displacement of the sites. In some cases the sample remains connected by a few isolated tetrahedra, but as these will be in a state of anomalously high strain, the displacement of their sites will reflect the displacement of the portion of sample to which they are attached.
That the surface found corresponds to the fracture surface has been checked using a different method based on percolation. The sample can be described as a collection of boxes (the tetrahedra) connected on a cubic lattice. If we choose one tetrahedron on the bottom face we can imagine injecting it with some coloured liquid: the liquid will spread within the sample and reach the top face. Broken tetrahedra can act as blocking boxes for the liquid, so that the liquid will reach the top face unless a complete fracture surface dividing the sample into two halves is retrieved. Complete failure was assured by slowly increasing the applied displacement until percolation between top and bottom was lost, requiring significant extra simulation time. Comparing the two methods for a set of simulations a difference of less then for the set of broken bonds with respect to the whole sample was found, and similarly a difference in the final detected surface of less than .
IV.1 Measurement and selection of Crack Speed
A first series of simulations was built using samples with sides tetrahedra, with a starting notch tetrahedra long. In these simulations, the condition of fixed crack speed was released and the Griffith criterion was used, but the condition of planarity was maintained so that comparison could be made with the efficiency description. A sample of three simulations were performed for each value of : above a threshold value of , all simulations led to a completely broken sample. Below this value, we found that cracks did not reach the end of the sample.
The constraint of planarity was lifted in the second and third series of simulations. The second had parameters matched to those of the first, except that larger samples of 10 simulations were used to counter the greater variability in results. The third series had larger size simulations of tetrahedra and due to computational cost was limited to samples of three simulations.
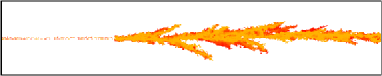
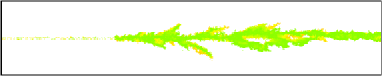
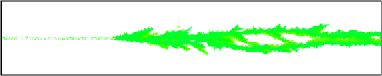
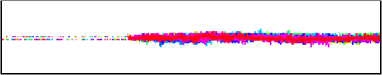
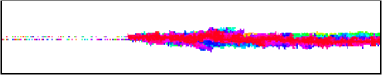
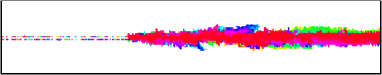
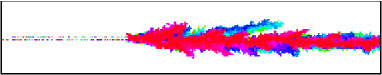
Crack speeds were measured with two different methods. In the histograms method a set of histograms was build, reporting the number of broken tetrahedra at each distance from the crack notch (see figure 2). Then, the intercepts with about of the average value of broken tetrahedra per unit of crack advance (dashed line in figure) were taken as a measure of the crack front position. The value of was chosen because that is where the histograms are typically steepest. Plotting the position against time, the crack speed was retrieved.
In the average crack tip position method, the average position of the newly-broken tetrahedra in each time interval considered was retrieved as a function of time, and the crack speed was measured from its slope.
In the first set of simulations, corresponding to planar cracks, the values of the crack speed found from both methods are fully compatible with the results found in our previous workPB-02 as shown from table 1(a) and figure 3. The results found are interesting not only for their agreement with the results from the efficiency description, but also because the measured values of are compatible with the crack speeds measured in anisotropic materials,F-71 ; HB-66 ; WK-94 in particular with the value of measured for the sample of polymethilmetacrylate prepared with a weak interface.WK-94 That value was supposed to be the best proof that the limiting crack speed for cracks is the Rayleigh speed. The microscopic structure of polymethilmetacrylate is completely different from that of our model, however due to the fact that the drop of the efficiency at high speeds is dominated by the resonance at the Rayleigh speed (which we expect it to be a common feature to all materials), we suggest that the limiting crack speed for a non-branching crack is the Rayleigh speed only in the limit of infinite loading, or . For finite loadings, the value of the crack speed measured corresponds to that given from the efficiency description.
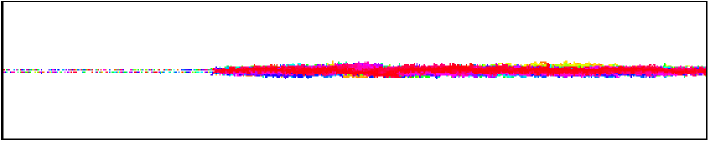
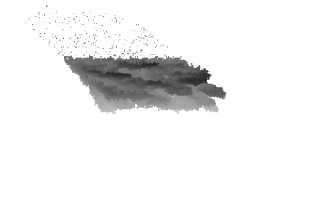
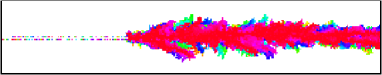
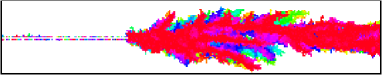
The picture is notably different when the condition of planarity is released in the second and third series of simulations. The disorder dominates over the lattice anisotropy, with particularly resistant (or particularly weak) tetrahedra prompting the crack to deflect out of plane. For low driving forces, the resulting cracks are “fat” (figure 4) and the crack speed is considerably lower than expected from the efficiency description. Crack speeds measured by both methods are reported in table 1(b). Low values of give a crack speed which is lower than expected from the efficiency description, but compatible with some of the measurements obtained both in simulations and in experiments as explained in section I. For higher values of , the results of the two types of measurements for the crack speed diverge, which we attribute to the influence of crack branching. The average of the crack tip position is an average of the new broken tetrahedra, which includes tetrahedra which break along branches behind the crack front. As a result, the average is affected by a systematic error which lowers the value from that of the crack front. Where the speed measurements differ significantly, we take the histogram method to give the true speed of the crack front and the divergence of the methods to be an indicator of crack branching.
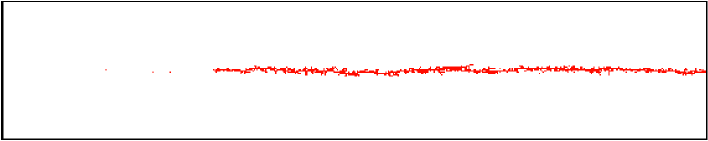
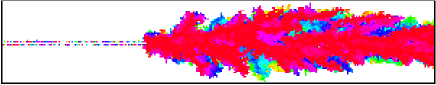
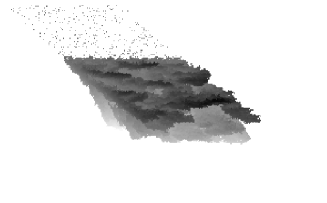
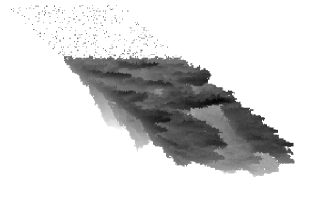
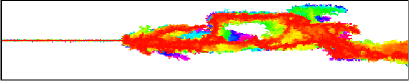
For the highest values of in the set of smaller simulations, the histogram method gives a value of the crack speed above that predicted from the efficiency function and, for , above the Rayleigh speed. This unexpected result is a consequence of the high level of damage of the sample due to the high level of the driving force. Direct inspection (see fig. 5) shows that the sample is broken, with branches reaching the sample’s top and bottom boundaries. The anomaly disappears upon increasing the size of the sample. Simulations for samples tetrahedra wide show, for low values of , results compatible with those of the smaller samples and, for all values of , crack speeds lower than the values given by the efficiency function (see table 1(c)). Direct inspection (see fig. 5) shows that although the damage is still heavy, in this case branches no longer reach the sample boundaries.
How do these results compare with those of other simulations and experiments? Experiments are usually performed with carefully controlled loading. The load is slowly increased and put just above the level beyond which the macroscopic fracture develops. This corresponds to a low level of . This can help explain the compatibility of these values of the crack speed with those measured in experiments. With respect to the results of the planar case however, crack speeds are lower. Although no major branches develop as testified by the agreement in the values of the crack speed for the two type of measurement, such drop in crack speed with respect to the efficiency prediction must be connected with the mechanism of attempted branching which is responsible for the “fat” appearence of these cracks. For , the average width of a crack is tetrahedra, indicating that more energy is needed for the crack to advance than expected from the case of a the fully planar crack.
Higher values of do not correspond to the experimental set up for the measurement of crack speeds. For such values, the crack speed approaches the values given by the efficiency description. The growth of the crack speed for increasing loading is similar to that measured in other simulations PGLGS-00 ; FPGGL-02 . The high driving force regimes are those which give rise to a non-zero roughness exponent as we will see below.
IV.2 The shape of advancing cracks
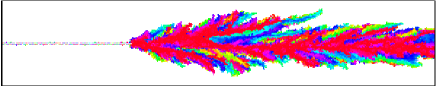
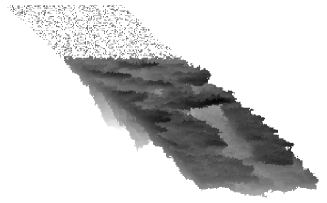
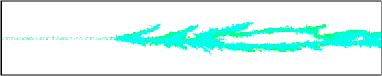
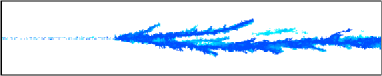
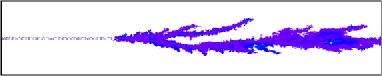
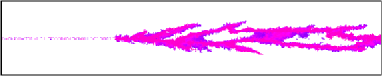
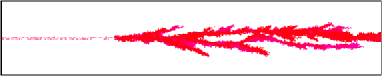
Figure 6 shows a sequence of frames of an advancing crack for , up to its final state, when the sample is fully broken. Due to the magnitude of , a considerable level of branching is visible. Straight cracks are obtained for values of (see later fig. 14).
At first sight, a reasonable description for the phenomenon is that of a main crack from which minor branches develop during the dynamics. This is not a complete picture. Side views of the same final fracture (see fig. 7) reveal that the crack is made by a set of connected branches. The crack tip splits into two or more branches which try to avoid each other, and force the crack to advance in a non linear fashion. The particular fracture shown is also characterized by two main branches running along much of the sample, and comparing the different panels of figure 7 it can be seen that both of these are part of the final fracture surface. Most branches die out as they head towards the sample’s boundaries. Those branches that mantain their distance from the sample’s boundaries manage to travel through the sample building up its backbone. The development of branches and then of the backbone, is clearly controlled by the sample’s boundaries which act as a guide to the branching process and lead the whole crack in the forward direction.
V Roughness of fracture surfaces
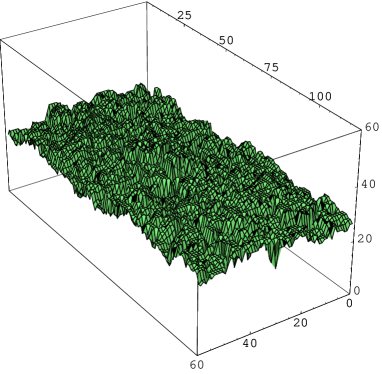
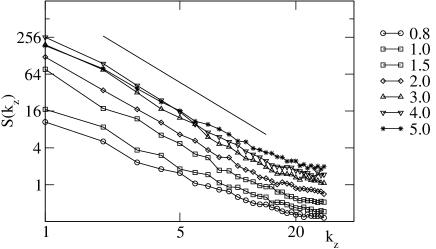
An example of a final fracture surface is shown in figure 8. The surface does not appear flat, and its roughness can be quantified through the roughness exponent. For two points separated along the direction of (global) crack proagation we have
and similarly we define for the scaling of height fluctuations along the direction of the (global) crack edge. These scaling laws can equivalently be probed by spatial power spectra, so that for a cut along the -direction we expect
The scaling is expected to apply from local lengthscales up to of order the (smallest) dimension of the sample.

We find the measured roughness exponent varies systematically with the strength of crack driving , whilst there is relatively little difference between measurements of the exponent in different directions or by different methods. To limit the influence of the boundaries and of the starting notch, we analysed a region limited to the central tetrahedra for the samples, and tetrahedra for the samples, equidistant between the final boundary and the end of the starting notch.
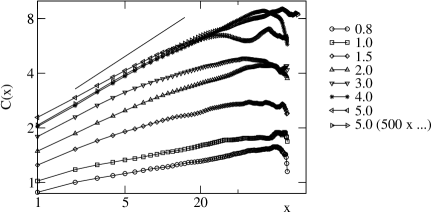
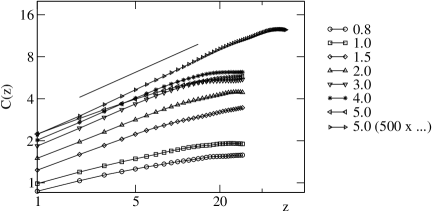
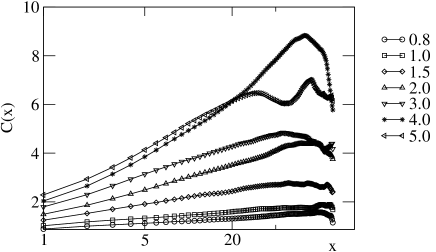
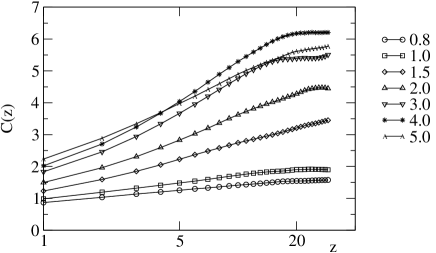
Correlation functions for the samples, shown in figure 9, appear ordered in for their slope. For increasing values of the driving energy, a region of constant slope close to the origin develops in the corresponding correlation function. The extension of this region is larger, the higher the value of . From its slope we have measured the roughness exponent corresponding to each value of the driving force. The roughness of the surface grows up to a limiting value, as shown by the common slope of the highest curves in both figures. The loss of slope of the highest curve corresponding to can be explained due to the approach of branches to the sample’s boundaries as described in the previous section.
Figure 10 shows the power spectra of the same cuts on the surface. Although the common roughness exponent is retrieved, the characteristics of how this common slope builds up are less clear, and data are more scattered.
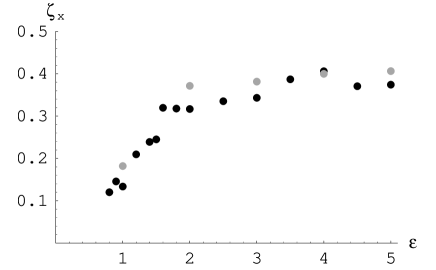
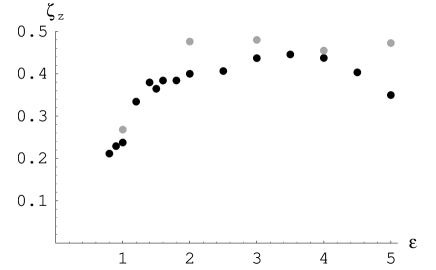
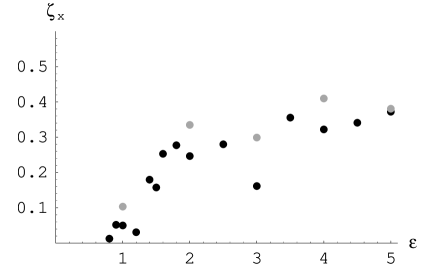
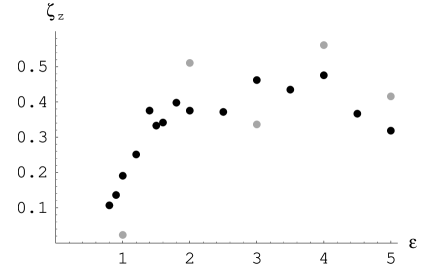
Results for the roughness exponent for both sets of samples are reported in figures 11 and 12. Results from the power spectra are compatible with the real space ones, although again more scattered. These results show that the roughness exponent increases quite sharply from a value close to zero, which we will see below can be connected with a logarithmic scaling, up to a value between and for both the and directions. Comparison between the values of the roughness exponent along the two space directions shows a slight difference which might be attributable to boundary effects, although data are insufficient to draw a definite conclusion.
For the lowest values of at which we could propagate cracks, our roughness data are better described by a logarithmic roughness law as shown by figure 13. This is interesting because it matches calculations by Ball and LarraldeBL-95 and subsequent calculations by Ramanathan, Ertaş and FisherREF-97 based on continuum elastic fracture mechanics for cracks at the threshold of propagation, as well as supporting experiments reported in Ref. LB-95, . In continuum elastic fracture mechanics these cracks are quasi-static, which we know from the efficiency description is not the case for a structured material, whilst in the supporting experimentsLB-95 the overall propagation was kept slow but locally crack acceleration could (and did) occur. Thus it appears that the logarithmic law may apply rather generally to cracks propagating marginally in three dimensions, without restriction to zero speed.
The increase in the fracture roughness can be visually connected to the branching process by comparing these results to the sequence of figure 14. The sequence shows that cracks are flat for low values of within the limits of what disorder allows. Macroscopic branches appear at a value of around which corresponds to the increase of the roughness exponent towards its limit value. The result should be compared with what observed by Sharon, Gross and FinebergSGF-95 in their experiment on the branching instability. The shape of branches appeared to be compatible with a power law shape with an exponent of about . Our results suggest that the appearence of branching increases the roughness to a value which in our case is between and , which corresponds to the one measured at short length scales.

VI Simulation of disconnected fractures
| Height-height correlation function | Power spectrum | |||
|---|---|---|---|---|
The limit value for the roughness exponent at about corresponds to the one measured in molecular dynamics simulations by Nakano, Kalia and VashishtaNKV-95 in microcrack advance, where they suggest microcrack coalescence as the mechanism leading to higher values .NKV-95 As all our simulations above have been performed imposing the connection of the advancing crack, which prevents the formation of multiple cracks within the sample, we could expect to have the same coexistence of the two values for the roughness exponent if we release this additional condition. Its removal allows the creation of diffuse damage (commonly referred to as “dust”), composed of isolate broken tetrahedra scattered throughout the sample. The level of such dust increases with , as the number of breakable tetrahedra increases with . In fig. 15 the case for is shown. The outcome has been cleaned of the dust which, due to the extreme high value of , sums up to a number of broken bonds equivalent to those shown, but scattered through the whole sample. The final fracture is characterized by large jumps due to microcracks which have connected during the dynamics, suggesting a similar interpretation to that of Nakano et al. Measurements of the corresponding roughness exponent for the samples however, reported in table 2, do not show any relevant difference from those of connected fractures. This may just reflect the length scale at which microcrack coalescence develops in our simulations being larger than the length scale over which our roughness measurements are performed. To check any increase in the roughness exponent associated with the lengthscale of crack coalescence evident in fig. 15 an increase in the system size would certainly be necessary.
VII Conclusions
The release of the condition of fixed crack speed has been the first test for the efficiency description of the selection of the crack speed. The efficiency description shows, in contrast to the theoretical description of the continuum theory, that the Rayleigh speed is the ultimate crack speed only in presence of an infinite loading. For finite loading applied, the crack speed selected follows the efficiency description in presence of consistent anisotropy or lattice trapping. That the terminal crack speed would be the Rayleigh speed only for an infinite loading had already been suggested by Xu and Needleman.XN-94 However, here this result comes out naturally from the shape of the efficiency, due to the Griffith criterion (2).
When the fracture geometry is released from planar, the terminal crack speed in our simulatiosn is much lower than expected from the efficiency description, and corresponds to the range of crack speed measured in experiments. The analysis of the crack shape has shown that even at the lowest loadings, cracks attempt to branch and this tends to thicken the crack. Hence, the amount of energy which is delivered into fracture work per unit of crack advance has to increase, and the energy radiated has to decrease. This inevitably leads to a change in the maximum speed achieved. Although the basic idea is clear, more work is required to relate the effective amount of energy radiated with the branching mechanism and hence with a criterion of speed selection for non-planar cracks.
When the energy is sufficient, branching becomes a macroscopic phenomenon and appears to be the basic mechanism through which the roughness exponent of a crack surface builds up. The dynamics of the macroscopic branches determine the final fracture shape: branches build the backbone of the whole crack. During the crack advance branches try to avoid each other whilst the boundaries of the sample lead them into the forward direction, creating a preferential direction for their advance. All the branches that greatly deviate from this direction die out and do not belong to the final fracture surface.
When the driving energy is low, the self-affine properties of the crack surface are also compatible with the scenario of logarithmic roughness suggested in Ref. LB-95, ; BL-95, and REF-97, . The condition of quasi-static cracking is explicit in the latter in terms of the fracture energy supplied to the crack being barely in excess of the fracture toughness. This however does not correspond simply to having a crack with little kinetic energy. On the contrary, because of the efficiency description, low values of correspond to cracks which barely have energy to advance, but which travel at high speed. This could clarify how a logarithmic roughness predicted for a quasi-static crack can be found in some of our simulations of dynamic cracks.
The roughness exponent grows rapidly with the driving energy , towards a maximum of corresponding to that measured in experiments on short length scales. Recent experimentsLS-98 ; MSLV-98 have shown that fracture surfaces could be affected by anomalous scaling. This in turn has been interpretedMBSV-02 as the mark of the anisotropy of the roughness exponent measured at large lenght scales. Our simulations show a slight anisotropy of the final fracture surface, which might be an indication of similar behaviour on short length scales, and calls for further attention in both simulations and experiments.
We have not been able to corroborate the suggestion of Ref. NKV-95, that the higher roughness exponent for large scales results from microcrack coalescence, but this may be due to the limited range of lengthscales we have been able to access in these simulations. We estimate we would require to gain one to two orders of magnitude in distance range to resolve this issue with the present model.
Acknowledgements.
We acknowledge financial support of EU contract No. ERBFMRXCT980183.References
- (1) L. B. Freund, Dynamic Fracture Mechanics (Cambridge University Press, 1990).
- (2) A. Kobayashi, N. Ohtani, and T. Sato, J. Appl. Polym. Sci. 18, 1625 (1974).
- (3) J. Fineberg, S. P. Gross, M. Marder, and H. L. Swinney, Phys. Rev. Lett. 67, 457 (1991).
- (4) J. Fineberg, S. P. Gross, M. Marder, and H. L. Swinney, Phys. Rev. B 45, 5146 (1992).
- (5) J. E. Field, Contemp. Phys. 12, 1 (1971).
- (6) D. Hull and P. Beardmore, Int. J. Fract. Mech. 2, 468 (1966).
- (7) P. D. Washabaugh and W. G. Knauss, Int. J. Fracture 65 (1994).
- (8) S. P. Gross, J. Fineberg, M. Marder, W. D. McCormick, H. L. Swinney, Phys. Rev. Lett. 71, 3162 (1993)
- (9) J. Fineberg and M. Marder, Phys. Rep. 313, 1 (1999).
- (10) J. Weertman, J. R. Weertman, Moving dislocations, in Dislocations in Solids, Vol. 3, F. R. N. Nabarro ed. (North-Holland Publishing Company, Amsterdam, 1980)
- (11) P. Daguier, B. Nghiem, E. Bouchaud, and F. Creuzet, Phys. Rev. Lett. 78, 1062 (1997).
- (12) R. C. Ball and H. Larralde, Int. J. Fracture 71, 365 (1995).
- (13) S. Ramanathan, D. Ertaş, and D. S. Fisher, Phys. Rev. Lett. 79, 873 (1997).
- (14) H. Larralde and R. C. Ball, Europhys. Lett. 30, 87 (1995).
- (15) F. F. Abraham, D. Brodbeck, R. A. Rafey and W. E. Rudge, Phys. Rev. Lett. 73, 272 (1994).
- (16) D. Holland and M. Marder, Phys. Rev. Lett. 81, 4029 (1998).
- (17) L. I. Slepyan, Sov. Phys. Dokl. 26, 538 (1981).
- (18) L. I. Slepyan, Mech. of Solids 3, 102 (1983).
- (19) M. Marder and X. Liu, Phys. Rev. Lett. 71, 2417 (1993).
- (20) M. Marder, Computing in Science & Engineering 1, 48 (1999).
- (21) A. Parisi and R. C. Ball, Phys. Rev. B 66, 165432 (2002).
- (22) D. Holland and M. Marder, Adv. Mater. 11, 793 (1999).
- (23) M. L. Falk, A. Needleman, J. R. Rice, J. de Physique IV,11, 43-50 (2001).
- (24) E. H. Yoffe, Phil. Mag. 41, 739 (1951)
- (25) K. R. Chandar, W. G. Knauss, Int. J. Fracture 26, 141 (1984)
- (26) X. -P. Xu and A. Needleman, J. Mech. Phys. Solids 42, 1397 (1994)
- (27) T. Martín, P. Español, M. A. Rubio and I. Zúñiga, Phys. Rev. E 61, 6120 (2000)
- (28) S. I. Heizler, D. A. Kessler and H. Levine, Phys. Rev. E 66, 016126 (2002).
- (29) D. A. Kessler and H. Levine, Phys. Rev. E 63, 016118 (2001).
- (30) E. Johnson, Int. J. Fracture 55, 47 (1992).
- (31) A. Needleman, J. Appl. Mech. 54, 525 (1987)
- (32) X. -P. Xu and A. Needleman, Int. J. Fracture 74, 253 (1995)
- (33) X. -P. Xu and A. Needleman, Int. J. Fracture 75, 289 (1995)
- (34) W. T. Ashurst and W. G. Hoover, Phys. Rev. B 14, 1465 (1976).
- (35) K. Sieradzki, G. J. Dienes, A. Paskin, and B. Massoumzadeh, Acta Metall. 36, 651 (1988).
- (36) R. Thomson, C. Hsieh, and V. Rama, J. Appl. Phys. 42 (1971).
- (37) D. Holland and M. Marder, Phys. Rev. Lett. 80, 746 (1998).
- (38) J. A. Hauch, D. Holland, M. Marder, and H. L. Swinney, Phys. Rev. Lett. 82, 3823 (1999).
- (39) O. Pla, F. Guinea, E. Louis, S. V. Ghaisas, and L. M. Sander, Phys. Rev. B 61, 11472 (2000).
- (40) S. Fratini, O. Pla, P. Gonz’alez, F. Guinea, and E. Louis, Phys. Rev. B 66, 104104 (2002).
- (41) E. Sharon, S. P. Gross, and J. Fineberg, Phys. Rev. Lett. 74, 5096 (1995).
- (42) A. Nakano, R. K. Kalia, and P. Vashishta, Phys. Rev. Lett. 75, 3138 (1995).
- (43) J. M. López and J. Schmittbuhl, Phys. Rev. E 57, 6405 (1998).
- (44) S. Morel, J. Schmittbuhl, J. M. López, and G. Valentin, Phys. Rev. E 58, 6999 (1998).
- (45) S. Morel, E. Bouchaud, J. Schmittbuhl, and G. Valentin, Int. J. Fracture 114, 307 (2002).