Complex Networks, Simple Vision
Abstract
This paper proposes and illustrates a general framework to integrate the areas of vision research and complex networks. Each image pixel is associated to a network node and the Euclidean distance between the visual properties (e.g. gray-level intensity, color or texture) at each possible pair of pixels is assigned as the respective edge weight. In addition to investigating the therefore obtained weight and adjacency matrices in terms of node degree densities, it is shown that the combination of the concepts of network hub and 2-expansion of the adjacency matrix provides an effective means to separate the image elements, a challenging task in computer vision known as segmentation.
pacs:
89.75.Fb, 89.75.Hc, 85.57.-s, 85.58.MjI Introduction
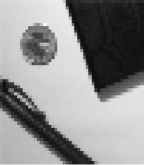
While effortless to humans and animals, the visual interpretation of scenes – i.e. the process of vision Marr (1982)– represents one of the greatest challenges to science. Indeed, no automated vision system da F. Costa and Jr (2001) has so far been obtained whose performance can be compared even to those of the simplest animals. At the same time, relatively little is known about how biological vision operates. Great part of the difficulty in understanding and implementing vision derives from the lack of general concepts and approaches to represent, characterize and model the intricate data and processes underlying visual processing. One particularly relevant aspect is the fact that 2D images are normally obtained by projecting 3D scenes onto some planar surface, implying substantial loss of information and degeneration. One immediate effect of such projections is the fact that the spatial adjacency relations are abruptly changed, in the sense that two spatially separated objects in the 3D scene may become adjacent in the 2D projection. At the same time, the superposition of objects (i.e. occlusion) may break the image background (or another object) into two or more disconnected portions. For instance, the pen in Figure 3(a) separates the white background into two parts. Another interesting aspect is the fact that, because of image resolution constraints implied by the size of the photoreceptors, stereo vision becomes useless for objects further away than about 100 meters. Even so, the fact that humans are still fully able to interpret such scenes and print pictures clearly indicates that there are effective solutions to the problem of understanding 2D images. One of the hardest problems in vision is the process of partitioning the image into meaningful connected components, which is known as segmentation da F. Costa and Jr (2001); Jain et al. (1999). Despite continuing attention from the scientific community, the problem of finding a segmentation approach capable of producing suitable results for general images remains a considerable challenge, as a consequence of the degenerations implied by 2D imaging allied to other problems such as reflexes and shades. While fully general and automated image segmentation will ultimately depend on the incorporation of high-level information about image formation and the objects to be expected in image (i.e. good models of the visual world), it is argued here that reasonable segmentations can be obtained by considering the full range of spatial interactions between the image elements.
The interesting problems implied by vision have motivated approaches based on areas ranging from partial differential equations (e.g. Sethian (1999)) to wavelets (e.g. Starck et al. (1998)). Several physics-based approaches to vision Wolff et al. (1992) have been reported in the literature, including the use of the Potts model for image segmentation (e.g. Peng et al. (2003)), deformable contours (e.g. Blake and Isard (1998), random fields (e.g. Li (1995)) and fractals (e.g. Gharavi-Alkhansari and Huang (1996)). While the projection of 2D scenes can be modeled as random scalar fields, digital images are normally represented in terms of matrices, where each element corresponds to a pixel, which provides a poor representation of the original visual information in the sense that it does not incorporate any information about spatial interactions and correlations along several spatial ranges between the pixels. Several graph-theoretical approaches to image analysis and computer vision, interesting graph-based approach to visual representation and analysis A and Dickinson (2002) involve the use of graphs where each pixel is associated to a node and the difference between the visual properties of adjacent pixels are used to define the respective edge weights. One particularly interesting graph-based method called image foresting transform – IFT – has been described (e.g. Lotufo and Falcao (1999)) where minimal paths are identified between pixels considering some spatial adjacency, yielding a forest 111A forest is an acyclic graph. of minimum paths connecting the image pixels. Several useful image properties can be derived from such graph representations, including the segmented image regions Lotufo and Falcao (1999) and multiscale skeletons Falcao et al. (2002).
The current work proposes a complex network Albert and Barabási (2002); Dorogovtsev and Mendes (2002); Newman (2003) approach to vision research where each pixel is represented as a node and the distance between the visual properties (e.g. gray-level, color or texture) of every pair of pixels in the image is adopted as the respective edge weight. The distance between the pixels can also be considered into the edge weight. The resulting fully-connected graph is subsequently thresholded at a specific value in order to obtain the respective adjacency matrix A da F. Costa (2003a). It is argued here that, by incorporating all ranges of spatial interactions between the image elements, such representations present good potential for integrating the relevant visual properties from the lowest to the highest levels of abstraction, leading to more effective visual processing. Moreover, it is also suggested that the use of the concepts and tools underlying complex network research (e.g. node degree, clustering coefficient, shortest path, L-expansions and critical phenomena) can provide relevant information to be used for image and object characterization. Such a potential is illustrated in this paper with respect to image characterization in terms of node degree densities and the use of L-expansions of the graph in order to obtain enhanced image segmentation.
II Image Representation as a Complex Network
The original gray-level image is assumed to have pixels, each of which can take gray-level values ranging from to , which is proportionally normalized into the interval . Therefore, the network representing the image contains pixels and weighted edges, which are represented by the weight matrix . Equations 1- 3 define a possible mapping between each node of the network and the image pixels , where and the function stands for the remainder of divided by .
| (1) | |||
| (2) | |||
| (3) |
Several types of interactions between two pixels can be defined respectively to each possible visual attribute, such as light intensity, color components, local shape, texture, motion, and disparity (stereo), as well as the pixels position and spatial adjacency da F. Costa (2003b) between pairs of pixels. The scalar values derived from such properties can be organized into a feature vector in , in such a way that each network node becomes associated to a feature vector describing the local visual properties around the respective image pixel. The weight of the edge connecting two nodes and is therefore defined as , where denotes the Euclidean norm. As such, the edge weight reflects the visual dissimilarity between the respective pair of pixels. In case the visual features take into account a small neighborhood around each pixel, such as is the case with texture or motion, the edge weights will quantify the dissimilarity between local properties around the pairs of pixels. Let be the operator acting over the matrix in such a way that the value one is assigned whenever the respective element of has absolute value larger or equal than the specified threshold ; e.g., . Thus, the adjacency matrix underlying the weighted complex network for a specific threshold value can be obtained as . The average node degree of is henceforth represented as .
The concept of L-expansion of a network, introduced in da F. Costa (2003c) provides an interesting possibility for identifying L-paths along the represented network. The L-expansion of a network da F. Costa (2003c) consists of the network containing the same number of nodes as where an edge is incorporated between nodes and whenever a path of length is found to exist between those nodes in the original network . Because of the high computational cost implied for the calculation of such expansions for large values of , the current work is limited to , in which case the adjacency matrix of the 2-expanded network can be immediately obtained from the squared adjacency matrix while ignoring the elements in the resulting main diagonal, i.e.
| (4) |
(a)
(b)
(c)
(d)
(e)
(f)
III Image Characterization in Terms of Topological Measurements
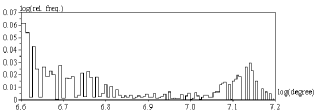
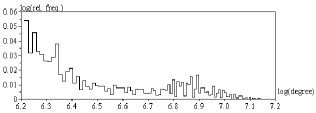
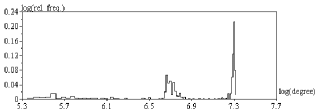
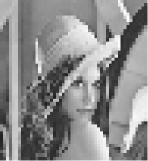
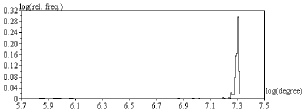
The possibility of using complex network concepts for image characterization is illustrated in the following with respect to the images in Figures 3(a) and 4(a). Figures 1(a) and (b) presents the dilogarithm representation of the node degrees, considering the respective weights, for the network obtained for those two images considering . The degree of a node was obtained by adding the weights of all edges connected to that node. Figures 1(c) and (d) show the node degree densities obtained for the respective adjacency matrices, while the node degrees considering 2-expansions of the original networks are shown in Figures 1(e) and (f). Interestingly, the density obtained for the image in Figure 1(a) presents two peaks, suggesting the existence of two types of interactions (weak and strong) between the image elements in the respective image. The densities obtained for the adjacency matrices indicate a predominance of higher node degrees, indicating that the image elements tend to be connected by many edges. The effect of the 2-expansions in enhancing the connections between pixels can be readily observed by comparing Figures 1(e)-(f) to (c)-(d). It is clear from this example that rather different node degree signatures are obtained for the two considered images, suggesting that such features can be effective for image characterization and classification.
IV Hub-Based Image Segmentation
Now we turn our attention to the important and challenging problem of image segmentation. One of the possible manners to approach such an issue is by considering that each segmented region can be understood as a connected component of the respective network whose nodes are characterized by similar visual properties, such as the gray-level relative uniformity inside the objects in Figure 3(a). Considering that the network hubs are associated to a large number of other nodes, it would be reasonable to expect that those nodes share similar properties between themselves and also with the respective hub. This fact suggests the following algorithm for partitioning the network into connected components:
| Obtain the weight matrix from the image; | ||
| Threshold so as to obtain the adjacency matrix ; | ||
| For | to do | |
| Iden | tify the node with the highest node degree | |
| in (the hub); | ||
| Join all nodes connected to , and also this node, | ||
| into a detected cluster ; | ||
| Remove from the adjacency matrix all edges | ||
| between the nodes in ; |
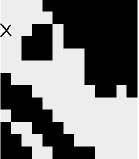
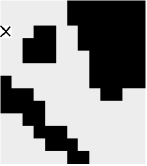
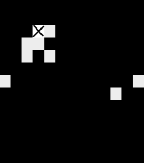
The number of repetitions corresponds to the number of expected clusters. This stop condition can be modified in order to consider the number of nodes obtained in each cluster, terminating the algorithm when all pixels are labeled or when the remaining number of unlabelled pixels is smaller than a threshold value. While the weighted edges in the networks representing images provide an indication about the dissimilarity degree between pairs of pixels, they have been experimentally verified to lead to unsuitable clusters. This is illustrated in Figure 2(b)-(c). The cluster obtained for the first identified hub, marked by the cross in Figure 2(b), was unsuitable in the sense that it missed part of the background (the black region at the bottom right corner of the image). The cluster obtained for the second dominant hub, shown in Figure 2(c) also missed part of the pen (the diagonal black stripe). This tendency to produce incomplete clusters is related to the fact that there are several pixels indirectly connected to the respective hub which, though sharing visual properties, are not included into the cluster. This problem can be addressed by considering the 2-expansions of the network, which will connect all pixels united to the hub by a 2-path. At the same time as the above problem is reduced, pixels directly connected to the hub which are not also connected through at leas one 2-path are ignored by the expansion. This enhanced complex network based segmentation algorithm therefore is given as follows
| Obtain the weight matrix from the image; | ||
| Threshold so as to obtain the adjacency matrix ; | ||
| Obta | in the adjacency matrix for the 2-expanded | |
| network | ||
| For to do | ||
| Iden | tify the node with the highest node degree | |
| in (the hub); | ||
| Join all nodes connected to , and also this node, | ||
| into a detected cluster ; | ||
| Remove from the adjacency matrix all edges | ||
| between the nodes in ; |
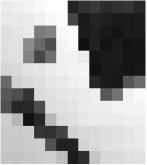
Figure 2 illustrates the potential of the enhanced segmentation algorithm with respect to the initial image (a), which corresponds to a coarse version of the image in Figure 3(a), which is considered here for the sake of illustration. The first three identified hubs (crossed pixel) and respective clusters (light gray-level values) are shown in (d)-(f). The clusters obtained for the two first hubs, shown in Figures 2(d) and (e) resulted considerably superior to those obtained by using the traditional edges (i.e. the clusters in Figures 2(b) and (c)). Interestingly, the first identified hub, which correspond to the image background, implied in a respective segmented region (light gray-level) merging the two portions of the background which were previously separated. Further examples of the potential of the proposed segmentation algorithm are given in Figures 3(b) and 4.
(a) (b)

(c) (d)

(e) (f)

(a) (b)
(a) (b)
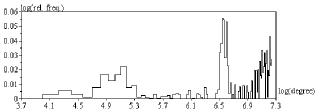
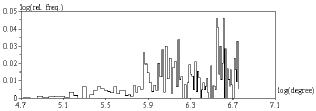
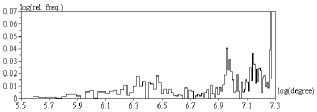
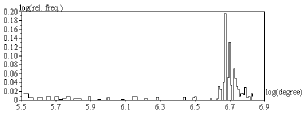
In similar fashion to the characterization of whole images in terms of complex network measurements proposed in Section III, it is possible to apply such an approach to characterize the regions produced by segmentation algorithms such as that described above. This can be immediately accomplished from adjacency matrices defined for each segmented region. Figure 5 illustrates the node degree densities (after 2-expansion) obtained for the segmented regions (light gray-level) in Figures 2(d) and (e). It is clear from this example that rather distinct connecting patterns can be obtained for two different regions of the same image. Such region-oriented topological measurements obtained for the representing network provide valuable subsidies for object recognition and texture characterization.
(a)
(b)
V Concluding Remarks
This paper has illustrated how digital images can be effectively represented, characterized and analyzed in terms of graphs taking into account several ranges of spatial interactions. The potential of such a framework has been illustrated for image characterization in terms of node degree densities and for image segmentation by using a combination of the concepts of hub and 2-expansions of a network. Several future developments have been motivated by such results. First, it would be interesting to investigate how complex network measurements such as the node degree densities, clustering coefficient and minimal length can be used for the characterization of broad classes of images (e.g. landscale scenes, textures, medical images, etc.). Another promising possibility is to use higher L-expansions in order to further enhance the proposed segmentation approach. At the same time, the concept of hub-oriented clustering considered in this work can be immediately extended for general pattern recognition, allowing the identification of prototypes (i.e. the respective hubs) of each identified class. Along similar lines, it would be interesting to investigate how alternative partitioning schemes such as that reported in Gronlund and Holme (2003) behave for image segmentation, with prospects for integrating approaches. Other further developments include the consideration of the segmented regions as spatial networks da F. Costa (2003b) and the topographical integration of networks obtained for distinct image properties da F. Costa (2003d). Finally, it would be particularly interesting to check how the topological connections of the networks representing digital images change with the progressive increase of the threshold , with the possible occurrence of critical phenomena (e.g. percolation).
Acknowledgements.
The author is grateful to FAPESP (proc. 99/12765-2), CNPq (proc. 301422/92-3) and Human Frontier Science Program for financial support.References
- Marr (1982) D. Marr, Vision (W. H. Freeman, 1982).
- da F. Costa and Jr (2001) L. da F. Costa and R. M. C. Jr, Shape Analysis and Classification: Theory and Practice (CRC Press, Boca Raton, 2001).
- Jain et al. (1999) A. K. Jain, M. N. Murty, and P. J. Flynn, ACM Computing Surveys 31, 264 (1999).
- Sethian (1999) J. A. Sethian, Level-Set Methods and Fast Marching Methods (Cambridge University Press, 1999).
- Starck et al. (1998) J. L. Starck, F. Murtagh, and A. Bijaoui, Image Processing and Data Analysis (Cambridge University Press, 1998).
- Wolff et al. (1992) L. B. Wolff, S. A. Shafer, and G. E. Healey, Physics Based Vision: Principles and Practice (A. K. Peters, 1992).
- Peng et al. (2003) S. Peng, B. Urbanc, L. Cruz, B. T. Hyman, and H. E. Stanley, Proc. Nat. Ac. Sci. 100, 3847 (2003).
- Blake and Isard (1998) A. Blake and M. Isard, Active Contours (Springer-Verlag, 1998).
- Li (1995) S. Li, Markov Random Field Modeling in Computer Vision (Springer-Verlag, 1995).
- Gharavi-Alkhansari and Huang (1996) M. Gharavi-Alkhansari and T. S. Huang, in Video Coding : The Second Generation Approach, edited by L. Torres and M. Kunt (Kluwer Academic Publishers, 1996), pp. 265–304.
- A and Dickinson (2002) S. A and S. Dickinson, in Theoretical aspects of computer science, edited by G. B. K. et al. (Springer-Verlag, 2002), vol. LNCS 2292, pp. 148–174.
- Lotufo and Falcao (1999) R. A. Lotufo and A. X. Falcao, in Mathematical morphology and its applications to image and signal processing (Kluwer Academics, Palo Alto, USA, 1999), vol. 18, pp. 341–350.
- Falcao et al. (2002) A. X. Falcao, L. da F. Costa, and B. S. da Cunha, Pattern Recognition 35, 1571 (2002).
- Albert and Barabási (2002) R. Albert and A. L. Barabási, Rev. Mod. Phys. 74, 47 (2002).
- Dorogovtsev and Mendes (2002) S. N. Dorogovtsev and J. F. F. Mendes, Advances in Physics 51, 1079 (2002), cond-mat/0106144.
- Newman (2003) M. E. J. Newman, SIAM Review 45, 167 (2003), cond-mat/0303516.
- da F. Costa (2003a) L. da F. Costa (2003a), cond-mat/0312646.
- da F. Costa (2003b) L. da F. Costa (2003b), cond-mat/0307754.
- da F. Costa (2003c) L. da F. Costa (2003c), cond-mat/0312712.
- Gronlund and Holme (2003) A. Gronlund and P. Holme (2003), cond-mat/0312010.
- da F. Costa (2003d) L. da F. Costa (2003d), cond-mat/0306530.