Water in nanopores. II. Liquid-vapour phase transition near hydrophobic surfaces
Abstract
The liquid-vapour phase transition near a weakly attractive surface is studied by simulations of the coexistence curves of water in hydrophobic pores. There is a pronounced gradual density depletion of the liquid phase near the surface without any trend to the formation of a vapour layer below the bulk critical temperature TC. The temperature dependence of the order parameter in the surface layer follows the power law ( - ) (1 - T/TC) with a value of the exponent close to the critical exponent = 0.82 of the ordinary transition in the Ising model. The order parameter profiles in the subcritical region are consistent with the behaviour of an ordinary transition and their temperature evolution is governed by the bulk correlation length. Density profiles of water at supercritical temperatures are consistent with the behaviour of the normal transition caused by the preferential adsorption of voids. The relation between normal and ordinary transitions in the Ising model and in fluids is discussed.
, ,
1 Introduction
Studies of the water behaviour near hydrophobic surfaces are necessary for the understanding of various phenomena: hydrophobic attraction between extended surfaces, slipping flow of liquid water near a hydrophobic surface, hydrophobic interaction between large solutes in aqueous solutions, etc. In particular, the hydrophobic interaction plays an important role in the processes of protein folding. The ultimate prerequisite of such studies is the knowledge of the phase behaviour of water near the surface, that includes surface critical behaviour and location of the surface phase transitions.
In the case of a weak fluid-wall interaction a drying transition, i.e the formation of a macroscopically thick vapour layer near the surface in the liquid phase, could be expected in general, similarly to the wetting transition in the case of the a strong fluid-wall interaction [1, 2, 3, 4]. For a fluid near a hard wall a drying transition, which is accompanied by the formation of a liquid-vapour interface at some distance from the substrate, is expected [5]. The possible appearance of a vapour layer around hard spheres in liquid water was also discussed [6, 7]. In simulations a drying-like surface phase transition in the liquid phase of water near a substrate with a repulsive step in the interaction potential was found [8]. For a weakly attractive short-range fluid-wall interaction a drying transition, as expected from general theoretical arguments [2, 3], was reported for Lennard-Jones (LJ) fluids [9, 10]. In the case of a long-range fluid-wall interaction (for example, via van der Waals forces) a drying transition takes place at the bulk critical temperature only [11, 12, 13]. This means, that a macroscopic vapour layer between the liquid and the surface probably never occurs in real systems. Indeed, a drying transition was never observed experimentally. The absence of a drying transition also eliminates the possibility to observe predrying transitions in the stable liquid states, which means the formation of a thin vapour layer in states outside the liquid-vapour coexistence region.
The presence of a solid boundary effects the critical behaviour of a fluid. This in turn determines the properties of the fluid not only near the critical point but in a wider range of the thermodynamic conditions. The fluid becomes heterogeneous and the local properties, including the density, depend on the distance to the surface. The behaviour of the local properties near the surface should follow the laws of some surface universality class. The bulk fluid belongs to the universality class of the 3D Ising model, which shows three surface universality classes, depending on the interaction with the surface and the interparticle interaction in the surface layer [14]. In fluids, the average intermolecular interaction energy per particle always diminishes near the surface due to the effect of missing neighbours and, therefore, only two universality classes may be relevant: the so-called ordinary and normal transitions.
In a zero surface field h1 = 0 (free boundary), the effect of missing neighbours results in the ordinary transition universality class behaviour [15, 16]. The order parameter (magnetization in the case of the Ising model) in both coexisting phases significantly decreases towards the surface at temperatures T below the critical temperature TC and its profile becomes flat (m = 0) at TC and in the supercritical region. The temperature dependence of the order parameter in the surface layer m1 follows the scaling law [15]
| (1) |
where = (TC - T)/TC is the reduced temperature, 0.82 [17] is the surface critical exponent, which is essentially higher than the bulk critical exponent 0.326 [18].
A non-zero surface field 0 causes preferential adsorption of one of the components and a behaviour according to the normal transition universality class. In such a case the magnetization profile does not vanish at T TC and the deviation of the magnetization from the bulk value increases toward the surface. In fluids this effect causes the phenomenon of critical adsorption [19]. The surface critical behaviour in the limit is equivalent to the so-called extraordinary transition, which occurs, when the interaction between the spins in the surface layer exceeds some critical value [20]. Although in the case of a normal transition the magnetizations of the coexisting phases are not symmetrical relative to the axis m = 0, the difference of magnetizations approaches a flat profile m (z) = 0, when T TC, similarly to the ordinary transition (and contrary to the extraordinary transition [14]). For the normal and extraordinary transitions the magnetization in the surface layer is predicted to show the following temperature dependence [20]:
| (2) |
where the contribution in parentheses is a regular background, while the leading singular contribution is ( 0.11 [18]), when approaching TC from below (B-) or above (B+). Note, that the singular contribution becomes negligible compared to the linear regular term when T TC.
In the general case the magnetization profile at T = TC shows a maximum at some distance from the surface. This maximum increases and approaches the surface when , while it moves away from the surface and disappears, when 0 [21, 22]. Such behaviour corresponds to the crossover of the critical behaviour from ordinary transition near the surface to normal transition away from it, where the crossover distance approximately coincides with the maximum of the magnetization at T = TC. This means that in a surface layer the critical behaviour corresponding to the normal transition could be observed in the limit of strong adsorption only.
As far as a fluid belongs to the same universality class as the 3D Ising model it is natural to map the surface critical behaviour of fluids to the surface universality classes described above. The symmetry of liquid binary mixtures suggests the same mapping. The interaction of both components with the surface is attractive and the condition = 0 in the Ising model is fulfilled at some nonzero liquid-surface interaction potential, which is unique for any definite binary mixture [23]. So, binary mixtures belong to the universality class of normal transition in the sense, that they show preferential adsorption of one component ( 0). Nevertheless, experimental studies show, that the behaviour of the local order parameter, i.e. the difference between the concentrations of the coexisting phases near the surface at T TC, follows a power law with the critical exponent of an ordinary transition, at least in a case of a weak preferential adsorption [24, 25]. The crossover from ordinary to normal transition, predicted for the Ising model [21], was confirmed experimentally for supercritical binary mixtures [26] and a crossover distance up to dozens of nanometers was obtained for weak preferential adsorption.
The surface critical behaviour in a one-component fluid is essentially less clear in comparison with binary mixtures. Interaction with the surface and the effect of missing neighbours near the surface are physically meaningful for real molecules. The only possible definition of the second component as being represented by the voids introduces a drastic asymmetry of the system, because this ”component” does not show any interaction, effect of missing neighbours, etc. This makes it difficult to define properly the order parameter and to find the strength of the fluid-surface attraction, which provides the condition for the ordinary transition ( = 0). For example, this condition may be attributed to the horizontal density profile of critical fluids [27]. This could be achieved at some definite attractive fluid-wall interaction. Strengthening of fluid-wall interaction causes preferential adsorption of molecules. Note, that in this regime a crossover from ordinary to normal transition with the distance to the wall for LJ fluid was found [27]. To our knowledge, there are no experimental studies of the surface critical exponent of the order parameter in a one-component fluid. The only simulation study was reported for water near hydrophobic surface, where the value of the exponent was found close to Ising value for ordinary transition [28].
Surface transitions as well as the surface critical behaviour are modified in the cases of more than one confining surface and (or) non-planar surfaces (for example: in the case of fluids in pores or large solutes and colloids in fluids). The phase transition of fluid in pore is shifted with respect to the bulk one in -T plane (see brief review in our recent paper [29]). This distorts the surface phase transitions [4, 30] as well as the surface critical behaviour. The local critical behaviour depends strongly on the particular shape of the surface (corners, edges, cones, cubes, parabolic surfaces etc.) both in the cases of ordinary and normal transitions [31, 32, 33, 34]. As a result, the critical surface exponent becomes non-universal, i.e. dependent on the system shape. In some cases, for example for parabolic surfaces, the surface critical behaviour is no longer characterized by the usual power laws but by stretched exponentials [34].
For experimental and computer simulation studies of the surface transition and surface critical behaviour in one-component systems, the fluid density distribution near the surface is the key property. Experimental studies of the liquid density near solid surfaces show oscillations [35, 36] and depletion [13, 36, 37, 38, 39, 40, 41]. Noticeable depletion of the liquid water density near various hydrophobic surfaces was detected by neutron reflectivity [37, 38, 39], X-ray reflectivity [40] and electric conductivity [41] measurements. Liquid water density of about 85 to 90 of the bulk value was found in the interval of 20 to 50 Å from the surface by neutron reflectivity measurements [37, 38, 39]. These experiments did not allow to get water density profiles, but they clearly indicate the absence of a vapour layer at a surface. The density profiles, obtained from X-ray reflectivity measurements of water at a paraffin surface [40], show a water density of about 90 to 93 of the bulk value at distances less then 15 Å from the surface. A much stronger density depletion, which appears as gradual density decay and not as formation of a vapour layer, was observed in the case of n-hexane at a silicon surface [36]. Note also, that adsorption measurements show strong depletion of the liquid neon density near an extremely weakly attractive cesium surface when approaching the neon critical temperature [13], however they do not allow to distinguish between a gradual density decay and the formation of a vapour layer.
The presence of nanobubbles at hydrophobic surfaces in water (see reference [42] for a recent review) may, in principle, indicate the formation of a water vapour layer. However, the amount and size of the nanobubbles decrease essentially in degassed water [38] and increase due to contact with air [43]. Obviously, water + air mixtures rather then the liquid-gas coexistence of pure water should be considered in order to elucidate the origin of the nanobubbles.
The experimentally observed attraction between hydrophobic surfaces in liquid water [44] could be related both to the shift of the phase transition due to the confinement and (or) to the peculiarities of the water density distribution near the hydrophobic surface. In equilibrium with a bulk reservoir, a fluid confined between walls exists as a vapour (capillary evaporation) or as a liquid (capillary condensation), depending on the strength of fluid-wall interaction, bulk state and distance H between the walls [45]. In particular, the phenomenon of capillary evaporation corresponds to the equilibrium between a bulk liquid and confined vapour. Capillary evaporation was obtained in computer simulations of both LJ fluids [46, 47, 48] and water [49, 50, 51]. The phase state of a confined fluid in equilibrium with the bulk liquid under its equilibrium vapour pressure [47, 49] depends on the strength of the fluid-wall interaction only, and, in particular, for weakly attractive walls only the vapour phase is stable for any distances H between the confining (infinite) walls. In the case of an oversaturated bulk the capillary evaporation takes place at some critical distance Hcrit between the walls [46, 48, 51], which depends on the magnitude of the applied bulk pressure. A simple estimation of the oversaturation of water at ambient conditions [7], based on the Kelvin equation, predicts a value Hcrit of about 1000 Å. At H Hcrit the metastable liquid approaches a liquid spinodal with decreasing H, that could produce long-range attractive forces between the walls [46, 52]. Another explanation of the hydrophobic attraction is based solely on the depletion of water density near the hydrophobic surface and this effect was studied for water between hard walls [53].
The above presented hydrophobic attraction is only one of the phenomena, which could be fully understood only based on the knowledge of the surface phase behaviour of fluids. This includes, in particular, the location of phase transitions and knowledge of the density distribution near the surface in various thermodynamic states. In computer simulations surface phase diagrams have to be studied in slitlike pores, as periodic boundary conditions are not applicable to semi infinite system. However, there are a limited number of simulated or experimentally determined coexistence curves of fluids in confinement (see reference [29] for a brief review and some recent studies [54, 55, 56]).
In this paper we present coexistence curves of water in hydrophobic pores of various sizes and shapes. The main goal of the present paper is studying the temperature dependence of the density profiles of a fluid near a weakly attractive surface along the liquid-vapour coexistence curve and in supercritical states of the confined fluid. The obtained results are used for the analysis of the surface critical behaviour and possible surface phase transitions. Dimensional crossover in pores and extrapolation of the observed surface critical behaviour to semi infinite systems are discussed.
2 Method
TIP4P water [57] was simulated in slitlike pores with width H from 6 to 50 Å and in cylindrical pores with radius R from 12 to 35 Å. A spherical cutoff of 12 Å (oxygen-oxygen distance) for both the Coulombic and LJ parts of the water-water interaction potential was used. In accordance with the original parametrization of the TIP4P model, no long-range corrections were included. The interaction between the water molecules and the surface was described by a (9-3) LJ potential:
| (3) |
where r is the distance from the water oxygen to the pore wall. The parameter was fixed at 2.5 Å, the parameter = 1 kcal/mol (producing well-depth U0 of the potential (3) of -0.385 kcal/mol) corresponds to a paraffin-like hydrophobic surface. The average water density in the pore was calculated, assuming that the water occupies a pore volume till the distance /2 = 1.25 Å from the pore wall. Coexistence curves of water in pores in a wide temperature range were obtained by Monte Carlo simulations in the Gibbs ensemble [58]. For the three largest pores (H = 50 Å, R = 30 and 35 Å) the densities of the coexisting phases were obtained only for two temperatures (300 K and 520 K). The number of successful transfers per molecule between the coexisting phases varied from 5 to about 100 in largest and smallest pores, respectively. The number of water molecules in the two simulation cells varied from about 400 in the smallest pores up to 8000 in the largest cylindrical pore with R = 35 Å. The ratio L/H for slitlike pores or ratio L/2R for cylindrical pores, where L is the longitudinal size of the simulation cell, always exceeded 1 and at high temperatures achieved the value 10 in the smallest slitlike pores. The density profiles of the coexisting liquid and vapour phases and in some supercritical states were obtained by subsequent Monte Carlo simulations in the NVT ensemble.
3 Results
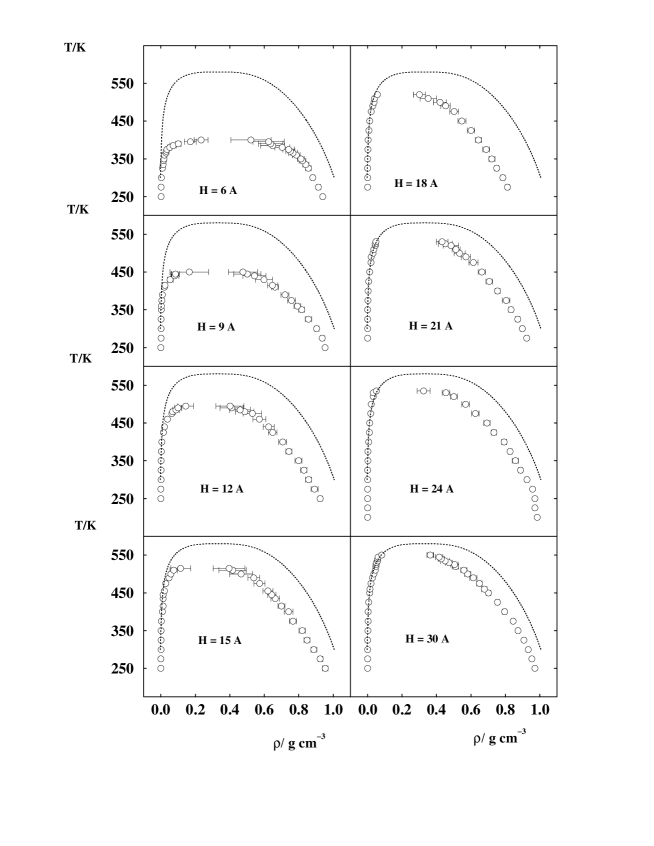
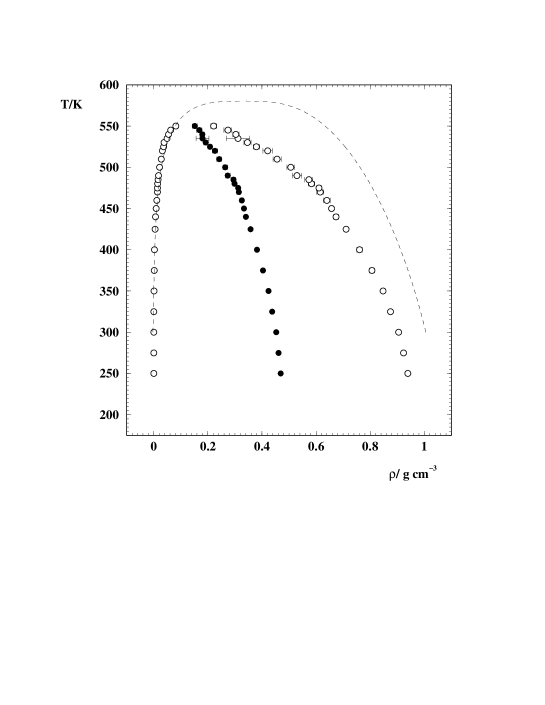
The simulated coexistence curves of water in hydrophobic slitlike pores of various sizes are shown in figure 1. The liquid density of confined water is essentially lower then in the bulk in the whole studied temperature intervals. The lowering of the pore critical temperature and the apparent flattening of the top of the coexistence curves with decreasing pore size (from H = 30 Å to H = 6 Å) is noticeable. A similar decrease of the liquid water density is observed in hydrophobic cylindrical pores with radii R = 12 Å, 15 Å, 20 Å [29] and R = 25 Å (figure 2). Note, that in the case of cylindrical pores at some temperature (about 460 to 470 K for the pore with R = 25 Å) the decrease of the liquid density becomes more pronounced, producing a noticeable change of the slope of the coexistence curve diameter (see figure 2). In total 12 coexistence curves of water in hydrophobic pores - 8 slit-like pores (figure 1) and 4 cylindrical pores (figure 2 and figure 12 of reference [29]) - were used in this paper for the analysis of various properties of the coexisting phases of confined water.
-
Pore width, Å T Cylindrical pores R = 12 535.015.0 0.2200.007 R = 15 535.010.0 0.1720.007 R = 20 540.05.0 0.1560.007 R = 25 555.05.0 0.1500.007 Slitlike pores quasi-2D water 330.07.5 H = 6 402.52.5 0.3580.007 H = 9 452.52.5 0.2940.007 H = 12 497.52.5 0.2620.007 H = 15 520.05.0 0.2460.007 H = 18 525.05.0 0.2350.007 H = 21 535.05.0 0.2410.007 H = 24 540.05.0 0.2290.007 H = 30 555.05.0 0.2270.007 bulk 3D water 580.22.5 0.3300.003
We have estimated the pore critical temperature T of water in various pores as an average of two temperatures: the highest temperature, where two-phase coexistence was obtained, and the lowest temperature, where the two phases become identical in the Gibbs ensemble MC simulations (see [29] for details). The estimated values of T are presented in table 1. The largest uncertainty of T is given for narrow cylindrical pores, because the decrease of the sizes of the liquid and vapour domains with increasing temperature prevents an accurate location of the two-phase region. Additionally, we show in table 1 the critical temperature T3D of bulk TIP4P water and the critical temperature T2D of quasi-two-dimensional TIP4P water with water oxygens located in one plane [29]. The evolution of the pore critical temperature T with pore size is shown in figure 3. The shift of the critical temperature in slitlike pores was fitted to the power law:
| (4) |
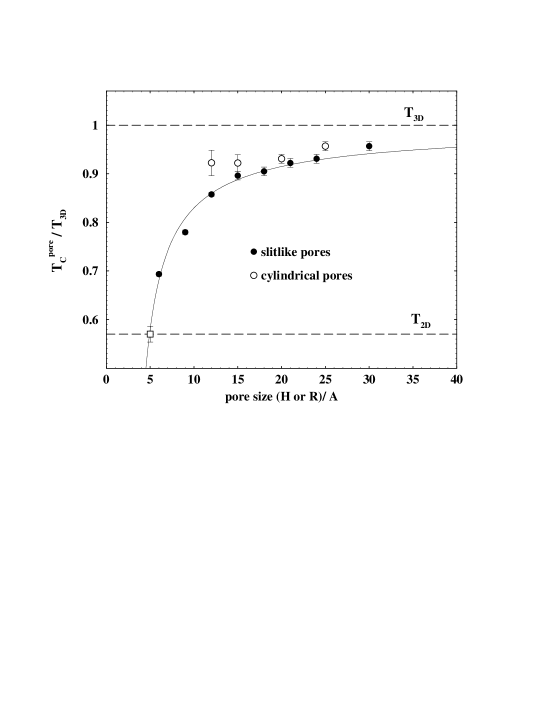
In the limit of a thick fluid film the value of is expected to be equal to = 1/ ( = 0.63 [18]) from finite-size scaling arguments [61]. For thin film the effective value of should be equal to 1 [30, 62]. The thickness of the fluid film H in a slitlike pore is lower than the pore width H by = 2.5 Å, the LJ parameter for the water-substrate interaction. We attributed quasi-two-dimensional water to water in a pore with effective size H = 5 Å, that approximately corresponds to a water monolayer, strongly localized in one plane.
A fit of equation (4) to the the data for slitlike pores (solid line in figure 3) gives the value = 0.82.
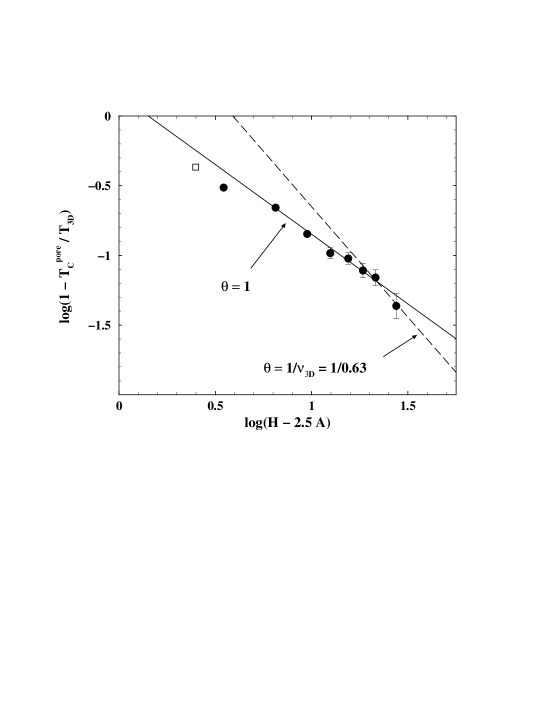
However, a plot of TC vs H in double logarithmic scale (figure 4) shows most of the data points may be well fitted by a linear law ( = 1), whereas the largest pore studied (H = 30 Å) shows a trend toward = 1/0.63. This suggests a crossover between two kinds of behaviour at a pore size H = 24 Å, that corresponds to a film of roughly 8 molecular diameters width. Note, that the data points both for the narrowest pore (H = 6 Å) and quasi-two-dimensional water bend down from the linear dependence (figure 4).
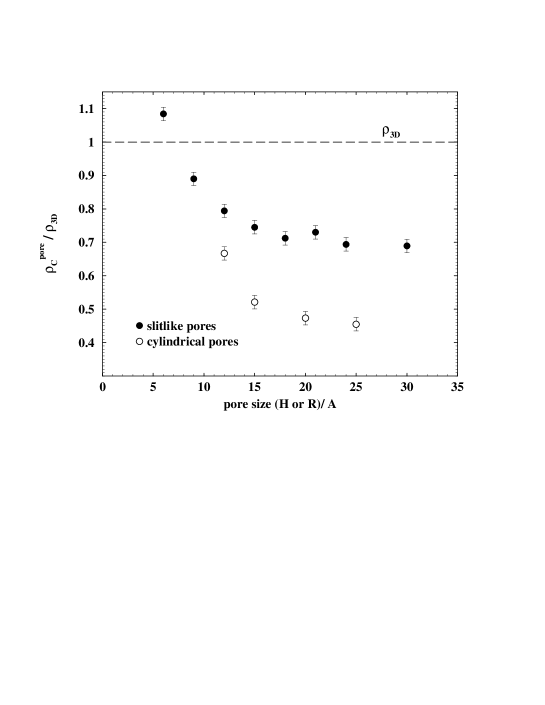
A polynomial extrapolation of the diameter of the coexistence curves = ( + )/2 to the pore critical temperature was used to estimate the pore critical densities , presented in table 1. In all pores, excluding the smallest one, the pore critical density is essentially below the bulk value = 0.330 g/cm3 [29]. Moreover, in the considered range of pore sizes (up to H = 30 Å) decreases with increasing pore size and shows no tendency towards the bulk critical value (figure 5).


In order to understand the observed peculiarities of the coexistence curves and to study the surface critical behaviour of water in hydrophobic pores, we analyzed the density profiles of the coexisting phases and their evolution with temperature. Typical density profiles of water in the liquid and vapour phases are shown in figures 6 and 7, respectively. The density of the liquid phase is strongly depleted towards the pore wall and this depletion progressively intensifies with temperature (figure 6) and pore size. This effect is essentially stronger in cylindrical pores in comparison with slitlike pores. Note, that the depletion of the density is accompanied by an essential increase of diffusivity near the hydrophobic surface [63].
The density profiles in the vapour phase show preferential adsorption of the water molecules at weakly attractive wall at temperatures below 500 K. At higher temperatures the vapour phase shows a depletion of the density towards the pore wall similar to the liquid phase (figure 7). This means that at T 500 K the density profile of the liquid bends downwards, whereas the density profile of the vapour bends upwards when approaching the pore wall. A similar behaviour was observed in lattice gas simulations at temperatures below the wetting transition [64] and in MC simulations of LJ fluids near a weakly attractive substrate, including temperature close to the critical temperature [65].
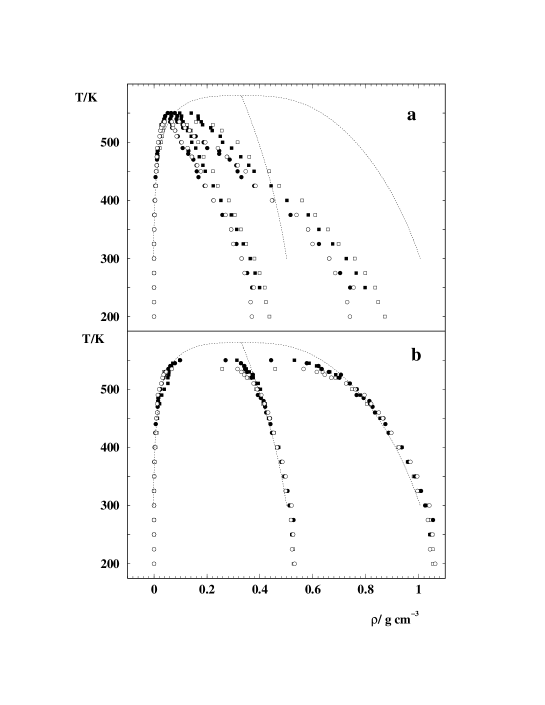
Due to the spatial heterogeneity of fluids in pores the local coexistence curves, i.e. the temperature dependence of the densities of the coexisting phases at various distances from the surface, should be analyzed. Defining layers (and, first of all, the surface layer) in continuous models, which allows a direct comparison with the results for lattice models, is not clear a priori. Far from the surface, where the packing of the fluid molecules at the surface is negligible and the density varies smoothly, the layer thickness could be arbitrarily small. Near the surface, both the packing effect and the details of the fluid-surface interaction, become important. Therefore, it seems reasonable to consider the local densities , averaged over layers of one molecular diameter thickness. The location of the first (surface) layer was chosen between the first minimum in the liquid density distribution at low temperatures (typically about 5 Å from the pore wall) and the van der Waals water-wall contact (/2 = 1.25 Å from the wall). The thickness of the subsequent water layers was set to 3 Å. The average density of the ”inner” water near the pore center was calculated for a layer extending 4 to 8 Å from the pore center. The coexistence curves of water in the surface layer and of water in the pore interior for some cylindrical and slitlike pores are shown in figure 8. While the coexistence curve of ”inner” water (figure 8,b) is close to the bulk one (except for the proximity of the pore critical temperature), the surface water shows a drastically different behaviour (figure 8,a). The density of the liquid phase in the surface layer approaches extremely low values (essentially below ) with increasing temperature and the coexistence curve shows triangularlike shape. Note the highly universal behaviour of the ”inner” water and the rather similar behaviour of the surface water in the pores of various sizes and shapes.
The analysis of the shape of the coexistence curves in fluid systems includes the temperature dependence of the order parameter and diameter. Because of the zero critical magnetization of an Ising system its order parameter is simply the magnetization (bulk or local). In confined fluids (as well as in the bulk) the critical density is non-zero and in the asymptotic limit the order parameter is the deviation of the densities and of the coexisting liquid and vapour phases from . Apart from the critical point the temperature dependence of the diameter = ( + )/2 should be taken into account and so the order parameter is defined as the deviation of the density from the diameter = ( - )/2. We define the local order parameter of a fluid in a similar way: (z)= ((z) - (z))/2, where the densities of liquid and vapour are taken at the same distance z from the surface. The temperature dependence of the bulk order parameter near the critical point in magnets, as well as in fluids, obeys the simple scaling law:
| (5) |
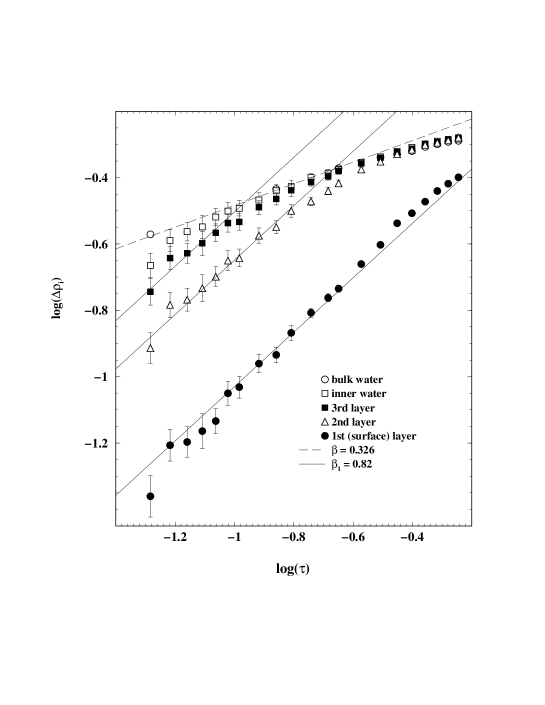
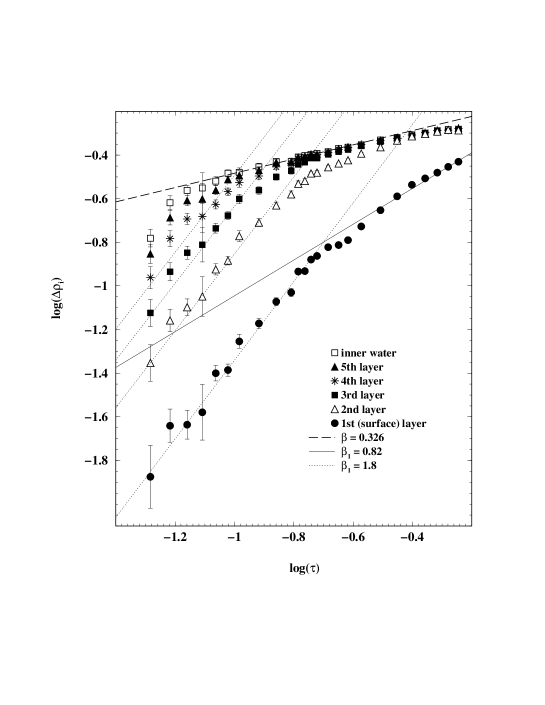
where =( - T)/ is a reduced temperature and = 0.326 [18] is a universal critical exponent of 3D (bulk) systems. The local order parameter (z) should obey the same law, but with another critical exponent, which depends on the surface universality class. The temperature dependence of the local order parameter for surface water, inner water and two intermediate water layers are shown in figure 9 in double logarithmic scale. The slope of these curves is equal to the exponent of the power law, equation (5). The order parameter of ”inner” water follows closely the bulk behaviour up to = 0.08. The order parameter in the surface layer shows an essentially different behaviour: starting from extremely low temperatures = 0.57 (close to freezing temperature = 0.59 of TIP4P bulk water [66]) the order parameter follows the scaling law with value of the exponent close to the value 1 = 0.82 of the ordinary transition in the Ising magnets. The intermediate two layers show a crossover from bulk like behaviour to surface behaviour at = 0.22 and = 0.11, in the second and the third layers, respectively. A higher value of the exponent in the surface layer means, that the densities of the coexisting phases near the surface approach each other much faster with temperature, than in the pore interior.
This disordering effect of the surface may also be illustrated, using an effective exponent , defined as:
| (6) |
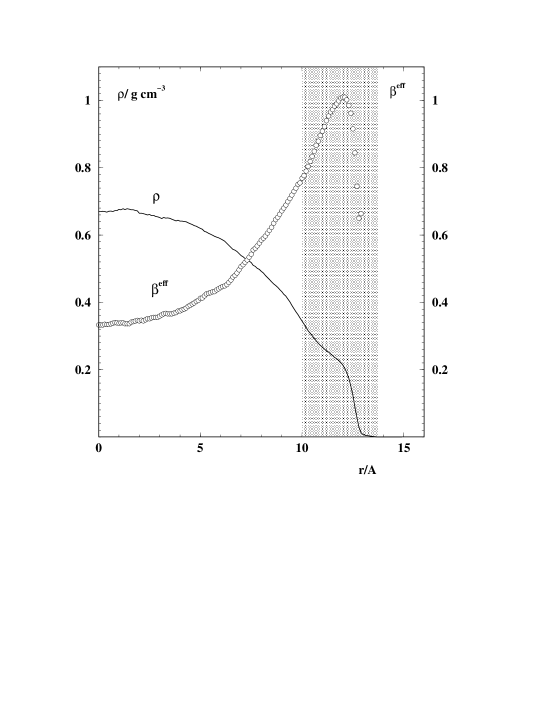
The value of the exponent is close to the value of some true critical exponent in the temperature intervals, which are outside the crossover regions. (z), obtained by applying equation (6) to for the interval 0.31, is shown in figure 10 as a function of the distance to the pore center. In fact, the value is close to the 3D Ising value in the pore interior and varies between 0.8 and 1.0 in the surface layer (hatched area in figure 10). Note, that the maximum of corresponds to the minimum of the LJ water-wall potential, which causes a slight hump of the liquid density profile (see figure 10).
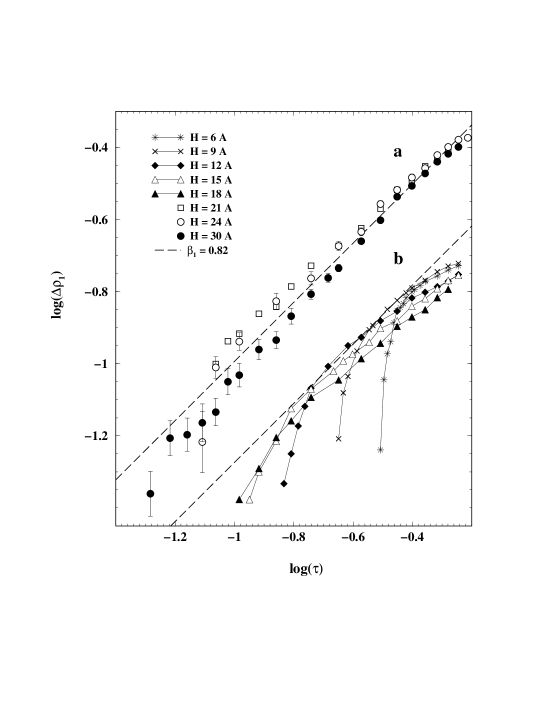
The behaviour of the order parameter in the surface layer is rather universal in the three largest slitlike pores and is close to the simple power law with of about 0.8 (figure 11,a). In the pores with H 21 Å the dependence ln() vs ln() progressively bends down at high temperatures (figure 11,b) preventing the location of a proper temperature interval, where the simple power law is valid.
Whereas the behaviour of water in the surface layer of cylindrical pores in general looks rather similar to that in slitlike pores (figure 8,a), the variation of the local order parameter with reduced temperature shows serious differences (full circles in figure 12). follows roughly the simple power law with 0.8 at 0.20, whereas at higher temperatures a simple power law with another exponent of of about 1.8 is observed (figure 12). In the second and the subsequent layers the behaviour with the exponent 0.8 could not be detected, but an apparent crossover from the bulk-like behaviour ( 0.326) at low temperatures to the behaviour with of about 1.8 could be seen. In the second layer the bulk-like behaviour is observed up to 0.18, whereas the behaviour with of about 1.8 is valid at 0.11. In the subsequent layers this crossover region becomes narrower and shifts to higher temperatures.
4 Discussion
The presented coexistence curves and density profiles give us the possibility to verify theoretical predictions of confinement effects. But they give us also the possibility to study phase transitions near single surfaces by extrapolating the pore results to semi-infinite systems.
The observed evolution of the pore critical temperature with the size of the slitlike pores is in general agreement with theoretical predictions and simulations for the 3D Ising model. In particular, the shift of the critical temperature in the pores, which contain from 2 to 7 molecular layers is inversely proportional to the pore size (see figure 4 and equation (4)), while in the largest pore studied (9 molecular layers) a crossover to a power law dependence with = 1/ is indicated. In Ising films such a crossover begins, when their thickness achieves 4 to 8 layers [67, 68, 69, 70]. The critical temperatures of quasi-two-dimensional water and water in a pore, comprising single water layer (H = 6 Å), deviate from the main dependence TC H-1. This deviation is in agreement with the behaviour of a monolayer Ising film [67, 68, 69, 70]. Obviously, with the decrease of the pore width from 2 to 1 monolayer, the system loses any features of three-dimensionality and becomes essentially two-dimensional.
The dimensional crossover from 3D critical behaviour to 2D behaviour in slitlike pores is expected at temperatures, where the correlation length becomes comparable with the pore size. It appears, particularly as a change of the critical exponent of the order parameter in the power law, equation (5), where = (T - T)/T is used instead of . The average order parameter (i.e., the difference of the densities, which are averaged over the whole pore) should be used here. In the four largest pores a crossover to the 2D behaviour is seen (figure 13, left panel), when the correlation length exceeds about 15 of the pore width (estimates of the correlation length are given below).
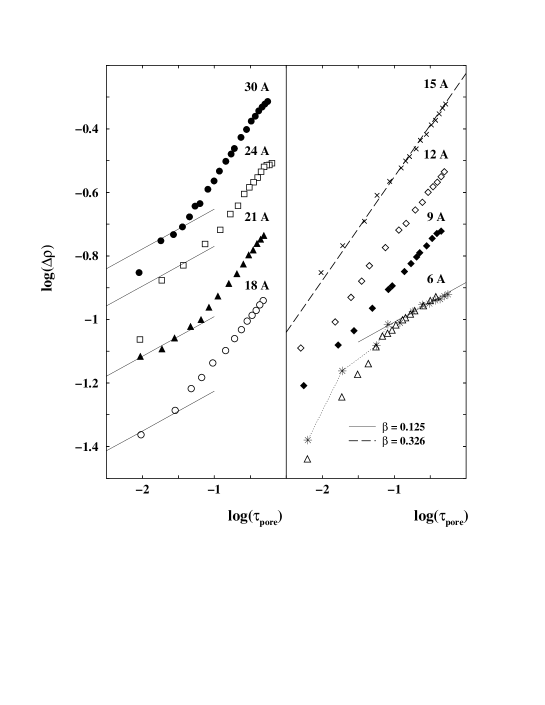
A quite different behaviour of the order parameter is observed for essentially two-dimensional phase transitions, i.e. for the liquid-vapour phase transition of water in the smallest studied hydrophobic slitelike pore (H = 6 Å, monolayer width) and for the layering transition of water at a hydrophilic substrate (slitlike pore with H = 24 Å and = -4.62 kcal/mol, [29]). In both cases the centers of water molecules are located in a layer of about 1 to 2 Å width, the critical temperatures of both transitions are close (400 5 K) and the order parameter follows a power law with the 2D exponent = 0.125 in the low temperature region (figure 13, right panel). When the temperature exceeds about 375 to 385 K ( 0.04 to 0.06) the behaviour of the order parameter in these systems indicates a crossover to a mean-field behaviour with exponent = 0.5. Such a crossover is expected, when the correlation length becomes comparable to the lateral size L of the simulation cell [71, 72]. In these “one-layer systems” the phase transition is essentially two-dimensional and so the 2D correlation length diverges at their critical temperatures. A rough estimate with = 1 and the 3D bulk value of the amplitude [73] shows a crossover to the mean-field behaviour, when the 2D correlation length has grown to about 15 to 20 of L. The lateral system size used for the simulations of a layering transition ([29])is about 50 larger than in the case of the hydrophobic pore with H = 6 Å. This causes a larger finite-size effect in the latter case. Note, that a variation of the critical temperature within the interval estimated from GEMC (see table 1) does not restore the asymptotic 2D behaviour in the hydrophobic pore.
In the pores of intermediate sizes (H = 9, 12 and 15 Å, i.e from 2 to 4 molecular layers width) we can not observe any tendency to the 2D behaviour, contrary to the expectation that the region of 2D behaviour should be essentially wider than in larger pores. This can not be the result of a crossover to a mean-field behaviour due to finite L, as in the case of quasi-two-dimensional systems considered above. In the two largest pores (H = 24 and 30 Å), where the lateral size L is about twice the pore size H, the trend to mean-field behaviour is noticeable for the highest temperature point only. In smaller pores the ratio L/H is larger: from 3 to 10, and therefore, no trend to mean-field behaviour should be expected even at higher temperatures than in the largest pores. The apparent 3D Ising behaviour in a wide temperature interval, observed in pores of 2 to 4 molecular layer width (figure 13, H = 9 to 15 Å), could be the result of a competition between the trend towards 2D criticality and a progressive contribution to the order parameter from the surface layers, which show faster disordering compared to the bulk. Dimensional crossover in small pores certainly needs further studies both for fluid and lattice [70] systems.
The common feature of the coexistence curves of water in all studied 12 hydrophobic pores is a significant decrease of the density at the liquid branch in comparison with the bulk (see figures 1,2 and also figure 12 in [29]). An inspection of the density profiles evidences that this decrease is due to the lowering of the density near the pore wall (figure 6), which appears as gradual decline of the water density towards the surface without any evidence for the formation of a vapour layer. This agrees with the recent experimental studies of water density depletion near hydrophobic surfaces at ambient [37, 38, 39, 40] and elevated [40, 74] temperatures. The absence of a vapour layer near the hydrophobic surface means the absence of drying (or predryring) transitions at T TC. This agrees with expectations from theory, concerning the phase behaviour near a surface with long range fluid-surface interaction [11, 12] and is confirmed by computer simulations of LJ fluids near weakly attractive walls [65]. Our simulations of water near an extremely hydrophobic surface (less attractive than a paraffin-like surface) suggest, that a stable vapour layer could never occur near a real hydrophobic surfaces, which always interacts with water via attractive long-range van der Waals forces. The possible existence of a metastable vapour layer near a hydrophobic surface deserves further investigations.
Due to the absence of a surface transition, a study of the surface critical behaviour of the fluid becomes possible. The obtained density profiles of the coexisting phases at various temperatures allow to study the temperature dependence of the order parameters in various layers. In the large slitlike pores the order parameter in the surface layer () demonstrates a universal temperature dependence, consistent with the exponent = 0.82 of the ordinary transition (figure 11,a). In the second and subsequent layers, () shows a crossover from bulk to surface critical behaviour with increasing temperature (figure 9). The increase of the crossover temperature with the distance to the surface agrees with the expectation, that intrusion of the surface perturbation into the bulk is governed by the bulk correlation length [14]. As a result, the effective critical exponent varies smoothly from the bulk value in the pore interior to the value near the surface (figure 10). A very similar crossover behaviour was observed for the ordinary transition in Ising magnets [75, 76, 77, 78].
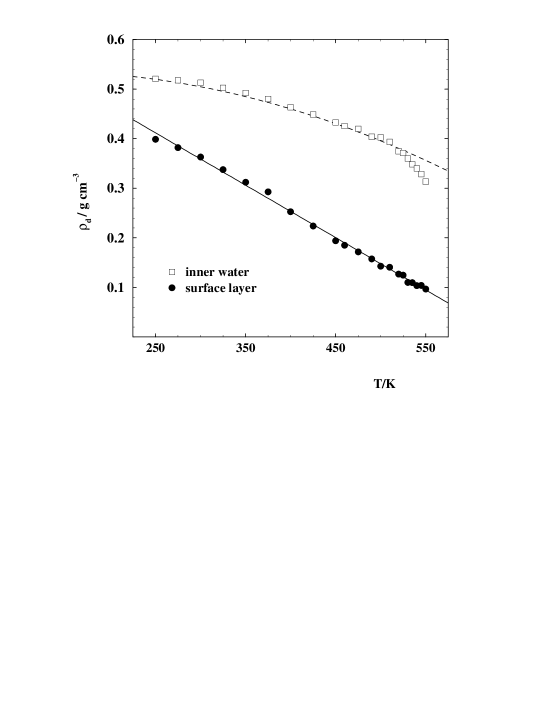
Figure 11 shows that in the three largest slitelike pores a power law with exponent 0.8 is valid for the surface layer in an extremely wide temperature range (about 250 K). This means that the surface behaviour in these pores is close to that in semiinfinite systems and the influence of the opposite wall is negligible up to a few degrees from T. In smaller pores the effective value of shows a rapid increase, when approaching T. This effect is more pronounced and starts at lower temperatures in narrower pores. This evidences the influence of the opposite wall on the surface critical behaviour.
In cylindrical pores the temperature evolution of the oder parameter is in general similar to that in slitlike pores. Namely, the effective critical exponent increases when approaching the surface and achieves values, which are essentially higher than the bulk critical exponent (figure 12, see also figure 5 in [28]). However, contrary to the planar surface, the critical behaviour of the order parameter in the surface layer even in large pores shows a sharp temperature crossover from the exponent 0.8 to a much higher value (figure 12). This effect is so strong, that it can be seen as a pronounced shoulder on the liquid branch and diameter of the coexistence curve of water in the pores with radius R = 25 Å (figure 2), R = 15 and 20 Å (figure 12 in [29]). This shoulder seems to shift to higher temperature with increasing pore radius. The order parameter in the second and subsequent layers do not show a behaviour with an exponent 0.8, rather a crossover directly from the bulklike behaviour to the behaviour with 1.8 occurs (figure 12). This phenomenon is obviously caused by the deviation of the surface from planarity. The critical behaviour of the order parameter near cylindrical surfaces is not yet studied. Our results suggest that a power law critical behaviour could also be valid for such geometries. The obtained value of 1.8 is comparable with the value 1.86 for the corner magnetization of a cube, and to values observed for edges with an opening angle less than /2 [32].
The local order parameter (z,), used in the present paper, was defined similarly as for the bulk fluid (see above). Like in the bulk case, the order parameter is the deviation of the density from the diameter. In the fluid near the surface the diameter depends not only on temperature, but also on the distance from the surface. Such a definition of (z,) provides a vanishing local order parameter at the critical point at any distance from the surface, i.e. the profile of the order parameter is flat ( = 0) 0), exactly as in the case of the ordinary transition of Ising magnets [14]. In large pores the temperature dependence of the diameter of the coexistence curve in the pore interior is close to the bulk behaviour up to the temperature, where the ”inner” water is influenced by the surface (figure 14). In the surface layer the local diameter shows a perfect linear temperature dependence in the whole temperature range (figure 14). The critical density in the surface layer decreases with increasing pore size and achieves an extremely low value (0.06 g cm-3 in slitlike pore with H = 30 Å). This results in a decrease of the average pore critical density with increasing pores size (figure 5) and may indicate a drying transition at the critical point of a semi-infinite system.
The profiles of (z,) could provide additional information concerning the surface critical behaviour of fluids. The profile of magnetization was studied in mean-field approximation both for the ordinary and extraordinary transitions [79]. In the case of a ordinary transition (h1 = 0), the local magnetization is symmetrical in the two phases and therefore serves as order parameter. Near the surface it obeys the following dependence on the distance z to the surface [14, 59]:
| (7) |
where , the value of the bulk order parameter, and , the bulk correlation length (T TC), depend only on temperature, while is connected with the density profile close to the surface and is determined by the surface-fluid interaction (in an Ising system it is directly related to the so-called extrapolation length ). The distance z = 0 was assigned to 1.25 Å from the wall, which corresponds to the boundary of the volume occupied by water (see Methods). In reference [79] another equation was proposed:
| (8) |
which reduces to equation (7) for small .
Depletion of water density near the surface could be also analyzed in the framework of normal transition, assuming the preferential adsorption of voids. As the normal transition in the limit of h is equivalent to the extraordinary transition [20], the preferential adsorption in mean-field approximation could be described as [59, 79]:
| (9) |
| (10) |
which provides an infinite adsorption at the distance z = -2z∗ from the surface. is the bulk correlation length at T TC. At subcritical temperatures we fitted equation (9) to the density profiles of the coexisting phases and of the fluid order parameter . In the latter case = (a1 - a2).
A renormalization group analysis of the magnetization profile at the ordinary transition of an Ising lattice shows, that very close to the surface (z ) the order parameter profiles obey a power law dependence (z) z and at z crosses over to an exponential behaviour [14]. The deviation of the scaling behaviour from the mean-field profile (equations (7) and (8)) is noticeable in the range 0 z 2 and achieves its maximum value of about 4 at z /2 [80]. The presence of pronounced density oscillations of fluids near surfaces even at high temperatures makes it reasonable to neglect these small corrections and to use in our study the mean-field equations (7-10) to fit the order parameter and density profiles.
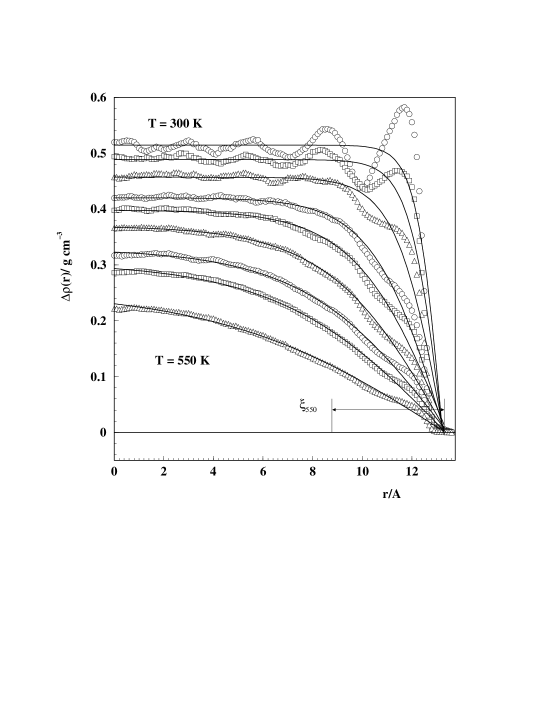
We have fitted the profiles of (z) as well as (z) and (z) separately with equations (7-9) and the supercritical profiles of (z) with equation (10), assuming all parameters to be freely variable. Equation (7) and equation (8) provide equally good descriptions of the order parameter profiles in all studied slitlike pores and in the whole temperature range (see figure 15, where fits using equation (7) are shown). This evidences, that in our system the extrapolation length is negligibly small. Indeed, its value practically does not depend on temperature and varies between 0 and 0.5 Å. The order parameter , obtained from fits using equations (7) and (8) are close to the order parameter in bulk water at all temperatures [29]. Small systematic deviations of the fitting curves from the order parameter in the pore interior, which are noticeable at high temperatures, are caused by deviations of in the pore interior from the bulk value discussed above and shown in figure 9.
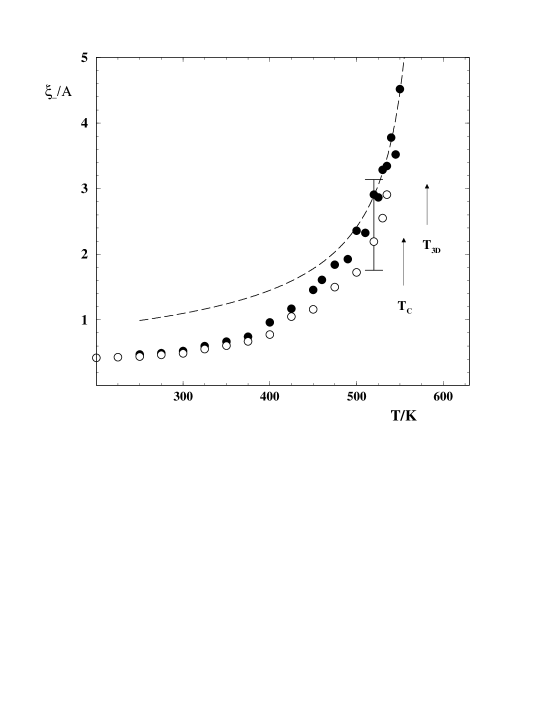
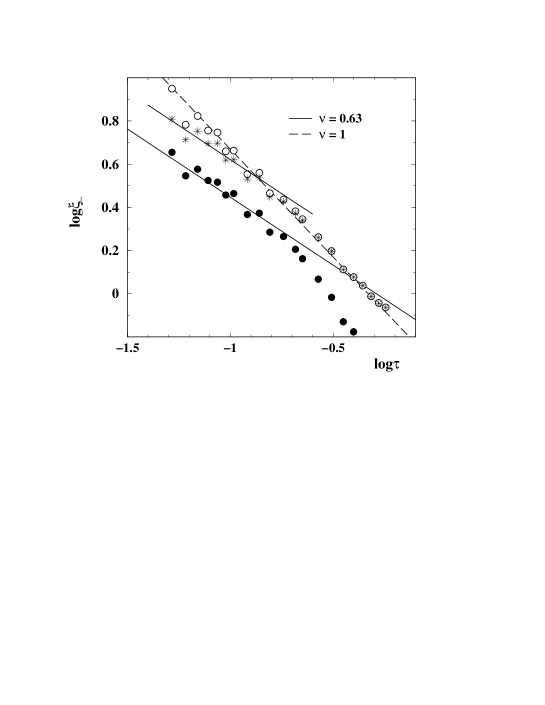
The temperature dependence of , obtained from equations (7) and (8) shows reasonable agreement with the experiment (figure 16). Moreover, at 0.15 the correlation length shows the expected power law behaviour ) with = = 0.63 (figure 17). Note, that the values of were obtained for a slitlike (and not a semi-infinite) geometry and, therefore, the correlation length increases with increasing pore size. For example, at T = 520 K = 1.76 Å in the pore with H = 18 Å, whereas in the pore with H = 50 Å it achieves 3.14 Å, which seems to be close to convergence (see vertical bar in figure 16) to the value in a semi-infinite system (H ) , i.e. to the bulk correlation length. The progressive lowering of the effective with decreasing pore size reflects the shift of the phase transition in the pore away from the bulk phase transition.
Using equations (7) and (8) to describe the order parameter profiles in cylindrical pores, results in increased effective values of the correlation length. As in the case of slitlike pores, progressively lowers with decreasing pore size. However, the absolute value of considerably exceeds the values of in slitlike pores of comparable sizes, especially at high temperatures. Obviously, the order parameter profiles in cylindrical and slitlike geometries should be described by different functions [81] and the critical behaviour of fluids near cylindrical surfaces deserves further study.
The fitting of equation (9) to the order parameter (z) is of lower quality in comparison with the fitting of equations (7) and (8). The obtained correlation lengths follow an unexpected linear temperature dependence in the double logarithmic plot of figure 17. So, the order parameter profiles (z) show a behaviour, which is in accordance with an ordinary transition.
The density profiles in the liquid phase (z) in the whole temperature range could be fitted with the same quality by any of the equations (7-9). The values , obtained from the fits using equations (7) and (8) are about 70 of the values of , obtained from (z). The values of , obtained from the fits using equation (9), at low temperatures are practically equal to the values , obtained from the corresponding fits of (z), but deviate noticeably in the high temperature region, where the temperature dependence becomes consistent with the expected scaling law (figure 17). Values of , obtained from the fit of the vapour density profiles (z) at high temperatures, are several times smaller than the values , obtained from the fits of (z) and (z).
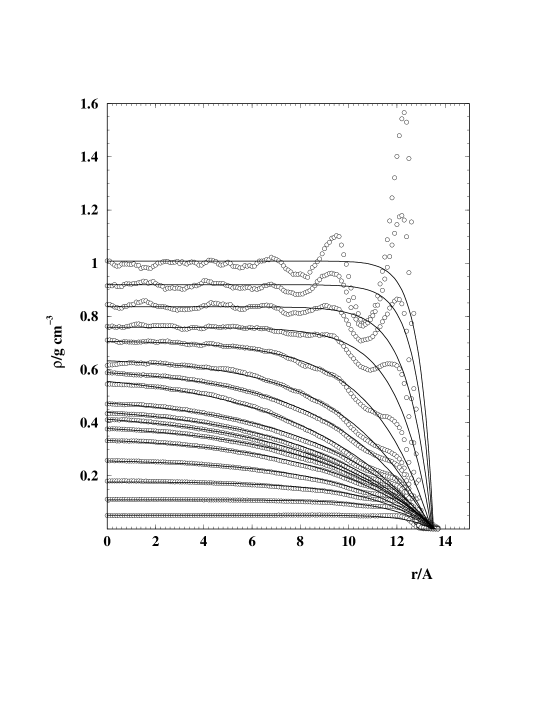
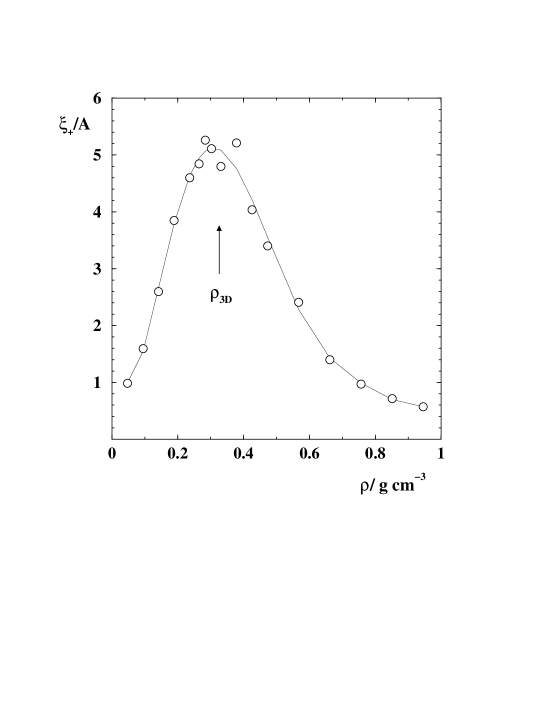
The density profiles of supercritical water (T = 580 K) at several average densities were satisfactorily fitted by using equation (10) (see figure 18), while the quality of the fits with equation (7) was essentially worse. The density dependence of the obtained correlation length shows a pronounced maximum, when the average density is close to the critical density of the bulk TIP4P water 0.330 g cm-3 [29] (figure 19). A similar dependence was observed experimentally for supercritical water [82], however, the absolute values of the correlation length, obtained from simulations, are essentially smaller, as they are obviously suppressed by the finite size of the simulated cells.
Summarizing our studies of the order parameter and density profiles, we conclude: i) at T TC the profiles of the order parameter (z) follows the behaviuor of an ordinary transition; ii) at T TC the density profiles (z) follow the behaviour of a normal transition with preferential adsorption of voids. The studies of the density profiles of the coexisting phases below TC are not conclusive. Note also, that in agreement with the simulation results for LJ fluids [27], we never observed a density minimum in case of a preferential adsorption of voids, which could be expected for small values of the surface field [21].
The definition of the local order parameter as the difference of the local densities of the coexisting phases, introduced in a way adopted for a bulk fluid, provides a vanishing order parameter at T TC and therefore a flat profile (z) = 0 at T = TC. This assumes that the critical behaviour of the order parameter (z) belongs to the universality class of ordinary transition. Indeed, the temperature dependence of the order parameter in the surface layer, its temperature crossover in subsequent layers and the shape of the order parameter profiles follow the behaviour of an ordinary transition.
The densities of the coexisting phases in general case could be written as:
| (11) |
where a symmetrical contribution is presented by the order parameter (z,), while the asymmetric term (z,) is the diameter, which contains regular as well as some singular terms. At the critical point the order parameter vanishes and the density profile reflects a preferential adsorption, which is described solely by the asymmetric term (z,). We assume that equation (2) for the critical behaviour in the surface layer in the case of a normal transition below TC describes the asymmetric contribution to the density profiles. So, the densities of the coexisting phases in the surface layer (z = 0) below TC should behave in general as superposition of equation (1) and (2):
| (12) |
In the case of coexisting bulk liquid and vapour phases (z ) the exponent = 0.82 in equation (12) should be replaced by = 0.326, (z) by the bulk critical density and the exponent (2 - ) by the critical anomaly exponent of the diameter (1 - ) [83]. (Note, that the exponent for the ordinary transition is = - 1 [59], providing 1 - = 2 - ). The validity of the critical anomaly of a diameter in fluids is questionable due to the so called pressure mixing in the scaling fields, which generates a term , that could dominate the term when [84].
To our knowledge, the temperature dependence of the difference between the magnetizations of the coexisting phases near the surface m = (m1 - m2)/2 is not studied for the Ising model, when h1 0. At any non-zero value of a surface field the m near the surface vanishes below TC at the wetting transition temperature [2]. So, the occurrence of the wetting transition in the Ising model with short-range non-zero surface field h1 and in some one-component fluids or fluid mixtures prevents an analysis of the asymptotic behaviour of the order parameter, defined as the difference between magnetizations (densities, concentrations) of the coexisting phases. However, we may assume, that below the temperature of the wetting transition the equation (12) is valid. This agrees with the available experimental studies of the local order parameter in binary mixtures [24, 25]. When the long-range fluid-wall interaction makes a wetting (drying) transition impossible at any T TC (the case studied in the present paper), equation (12) should be valid also asymptotically at 0.
Nevertheless, it is not clear, whether equation (12) is valid for any value of h1 or it is valid in our studies due the small value of h1. The extremely weak fluid-wall interaction (about 10 of fluid-fluid interaction) provides practically the strongest possible value h1 for the preferential adsorption of voids for existing solid substrates. Assuming that the case h1 = 0 is signaled by the flat density profile at the critical point [27], we can expect that equation (12) will be valid for the water-wall interactions with well-depths U0 from -0.39 kcal/mol (present studies) to about -1.0 kcal/mol [29]. Further strengthening of the fluid-wall interaction causes a change of the sign of the surface field h1 in favour of molecules. However, the possibility to increase this field is limited by the formation of dead layers at the wall [29], which are identical in both coexisting phases and, therefore, effectively form a new liquid-like wall. As a result the fluid-wall interaction comes close to the fluid-fluid interaction and is only slightly influenced by the interaction between molecules and solid wall. Note also, that a possible change of h1 with temperature [85] can not be excluded and may complicate the study of the critical adsorption in one-component fluids [86, 87].
So, the presented study of water near a hydrophobic surface in a wide temperature range below TC and in the supercritical region shows, that the behaviour of the order parameter is described by the laws of the ordinary transition, while the behaviour of the asymmetric contribution to the densities of the liquid () and vapour () phases is consistent with the laws of the normal transition. The surface critical behaviour of a one-component fluid for various strengths of fluid-wall interaction and in closer proximity to the bulk critical temperature definitely needs further investigations.
5 References
References
- [1] Cahn J W 1977 J. Chem. Phys. 66 3667
- [2] Nakanishi H and Fisher M E 1982 Phys. Rev. Lett. 49 1565
- [3] Pandit R, Schick M and Wortis M 1982 Phys. Rev. B 26 5112
- [4] Dietrich S 1988 Phase Transitions and Critical Phenomena vol 1 ed C Domb and J L Lebowitz (New York: Academic/New York) p 1
- [5] Henderson J R and van Swol F 1985 Mol. Phys 56 1313
- [6] Stillinger F H 1972 J.Solution Chem. 2 141
- [7] Lum K, Chandler D and Weeks J D 1999 J. Phys. Chem. B 103 4570
- [8] Brovchenko I, Geiger A and Oleinikova A 2002 New Kinds of Phase Transitions: Transformations in Disordered Substances ed by V V Brazhkin, S V Buldyrev, V N Rhyzhov and H E Stanley (Proc. NATO Advanced Research Workshop, Volga River, Kluver, Dordrecht) p 367
- [9] Swol F and Henderson J R 1989 Phys. Rev. A 40 2567
- [10] Nijmeijer M J P, Bruin C Bakker A F and van Leeuwen J M J 1991 Phys. Rev. B 44 834
- [11] Ebner C and Saam W F 1987 Phys. Rev. B 35 1822; 1987 Phys. Rev. Lett. 58 587
- [12] Nightingale M P and Indekeu J O 1985 Phys. Rev. B 32 3364
- [13] Hess G B, Sabatini M J and Chan M H W 1997 Phys. Rev. Lett. 78 1739
- [14] Binder K 1983 Phase Transitions and Critical Phenomena vol 8 ed C Domb and J L Lebowitz (London: Academic Press/London) p 1
- [15] Binder K and Hohenberg P C 1972 Phys. Rev. B 6 3461; 1974 Phys. Rev. B 9 2194
- [16] Landau D P and Binder K 1990 Phys. Rev. B 41 4633
- [17] Diehl H W and Shpot 1994 Phys. Rev. Lett. 73 3431
- [18] Guida R and Zinn-Justin J 1998 J. Phys. A: Math. Gen. 31 8103
- [19] Fisher M E and de Gennes 1978 C. R. Acad. Sci. Paris B 287 207
- [20] Diehl H W 1994 Ber. Bunsenges. Phys. Chem. 98 466; 1994 Phys. Rev. B 49 2846
- [21] Ritschel U and Czerner P 1996 Phys. Rev. Lett. 77 3645; 1997 Physica A 237 240
- [22] Maciolek A, Ciach A and Drzewinski A 1999 Phys. Rev. E 60 2887
- [23] Law B 2001 Prog. Surf. Sci. 66 159
- [24] Sigl L and Fenzl W 1986 Phys. Rev. Lett. 57 2191; Fenzl W 1993 Europhys. Lett. 24 557
- [25] Durian D J and Franck C 1987 Phys. Rev. Lett. 59 555
- [26] Cho J-H J and Law B 2001 Phys. Rev. E 65 011601
- [27] Maciolek A, Evans R and Wilding N B 2003 J. Chem. Phys. 119 8663
- [28] Brovchenko I, Geiger A and Oleinikova A 2001 Phys. Chem. Chem. Phys. 3 1567
- [29] Brovchenko I, Geiger A and Oleinikova A 2004 J. Chem. Phys. 120 1958
- [30] Evans R, Marini Bettolo Marconi U and Tarazona P 1986 J. Chem. Soc. Fraday Trans. 2. 82 1763
- [31] Cardy J L 1983 J. Phys. A: Math. Gen. 16 3617
- [32] Pleimling M and Selke W 1998 Eur. Phys. J. B 5 805
- [33] Hanke A, Krech M, Schlesener F and Dietrich S 1999 Phys. Rev. E 60 5163
- [34] Igloi F, Peschel I and Turban L 1993 Adv. Phys. 42 683
- [35] Yu C-J, Richter A G, Datta A, Durbin M K and Dutta P 1999 Phys. Rev. Lett. 82 2326
- [36] Doerr A K, Tolan M, Seydel T and Press W 1998 Physica B 248 263; Doerr A K, Tolan M, Schlomka J-P and Press W 2000 Europhys. Lett. 52 330
- [37] Thomas R K 2002 5th Liquid Matter Conference
- [38] Steitz R, Gutberlet T, Hauss T, Klosgen B, Krastev R, Schemmel S, Simonsen A C and Findenegg G H 2003 Langmuir 19 2409
- [39] Schwendel D, Hayashi T, Dahint R, Pertsin A, Grunze M, Streitz R and Schreiber F 2003 Langmuir 19 2284
- [40] Jensen T R, Jensen M O, Reitzel N, Balashev K, Peters G H, Kjaer K and Bjornholm T 2003 Phys. Rev, Lett. 90 086101
- [41] Lakshminarayanan V and Sur U K 2003 Pramana - J. Phys. 61 1739
- [42] Attard P 2003 Adv. Coll. Inter. Sci. 104 75
- [43] Yakubov G E, Butt H-J and Vinogradova O I 2000 J. Phys. Chem. 104 3407
- [44] Christenson H K and Claesson P M 2001 Adv. Coll. Inter. Sci. 91 391
- [45] Evans R 1990 J. Phys. Cond. Matt. 2 8989
- [46] Berard D R, Attard P and Pattey G N 1993 J. Chem. Phys. 98 7236; Attard P 1997 J.Chem. Phys. 107 3230
- [47] Dominguez H, Allen M P and Evans R 1999 Mol. Phys. 96 209
- [48] Noworyta J P, Henderson D and Sokolowski S 1999 Mol. Phys. 96 1139
- [49] Brovchenko I, Paschek D and Geiger A 2000 J. Chem. Phys. 113 5026; Brovchenko I and Geiger A 2002 J. Mol. Liq. 96-97 195
- [50] Bratko D, Curtis R A, Blanch H W and Prausnitz J M 2001 J. Chem. Phys. 115 3873
- [51] Hayashi T, Pertsin A J and Grunze M 2002 J. Chem. Phys. 117 6271; Pertsin A J, Hayashi T and Grunze M 2002 J. Phys. Chem. B 106 12274
- [52] Attard P, Ursenbach and Pattey G N 1992 Phys. Rev. A 45 7621
- [53] Forsman J, Jonsson Bo, Woodward C E and Wennerstrom H 1997 J. Phys. Chem. B 101 4253; Forsman J, Woodward C E and Jonsson Bo 1997 J. Coll. Inter. Sci. 195 264
- [54] Brodskaya E N, Zakharov V V and Laaksonen A 2002 Colloid Jornal 64 538
- [55] Rivera J L, McCabe C and Cummings P T 2002 Nano Lett. 2 1427
- [56] Salamacha L, Patrykiejew A, Sokolowski S and Binder K 2004 J. Chem. Phys. 120 1017
- [57] Jorgensen W L, Chandrasekhar J, Madura J D, Impey R W and Klein M L 1983 J. Chem. Phys. 79 926
- [58] Panagiotopoulos A Z 1987 Mol. Phys. 62 701
- [59] Diehl H W 1986 Phase Transitions and Critical Phenomena vol 10 ed C Domb and J L Lebowitz (London: Academic Press/London) p 75
- [60] Binder K, Landau D P and Muller M 2003 J. Stat. Phys. 110 1411
- [61] Fisher M E and Nakanishi H 1981 J. Chem. Phys. 75 5857; Nakanishi H and Fisher M E 1983 J. Chem. Phys. 78 3279
- [62] Evans R, Marconi Marini Bettolo U and Tarazona P 1986 J. Chem. Phys. 84 2376
- [63] Brovchenko I, Geiger A, Oleinikova A and Paschek D 2003 Europ. Phys. J. E 12 69
- [64] Binder K and Landau D P 1992 J Chem. Phys. 96 1444
- [65] Ancilotto F, Curtarolo S, Toigo F and Cole M W 2001 Phys. Rev. Lett. 87 206103
- [66] Gao G T, Zeng X C and Tanaka H 2000 J Chem. Phys. 112 8534
- [67] Fisher M E 1971 Proc. Intern. School of Physics “Enrico Fermi” on Critical Phenomena Course 51 (Academic Press/New York)
- [68] Binder K 1974 Thin Solid Films 20 367
- [69] Schilbe P, Siebentritt S and Rieder K-H 1995 Phys. Lett. A 216 1996
- [70] Dillmann O, Janke W, M ller M and Binder K 2001 J. Chem. Phys. 114 5853
- [71] Mon K K and Binder K 1992 J. Chem. Phys. 96 6989
- [72] Shaoyi J and Gubbins K E 1995 Mol. Phys. 86 599
- [73] Bonetti M, Calmettes P and Bervillier C 2001 J. Chem. Phys. 115 4660
- [74] Reiter G F, Li J C, Mayers J, Abdul-Redah T and Platzman P 2003 cond-mat/0311628v1
- [75] Vendruscolo M,Fasolino A and Rovere M 1993 Nuovo Cimento 15D 541
- [76] Selke W, Syalma F, Lajko P and Igloi F 1997 J. Stat. Phys. 89 1079
- [77] Pleimling M and Selke W 1998 Eur. Phys. J. B 1 385
- [78] Bengrine M, Benyoussef A, Ey-Zahraouy H and Mhirech F 1999 Physica A 268 149
- [79] Kumar P 1974 Phys. Rev. B 10 2928
- [80] Gomper G 1984 Z. Phys. B 56 217
- [81] Binder K, Stauffer D and Wildpaner V 1975 Acta. Met. 23 119
- [82] Morita T, Kusano K, Ochiai H, Saitow K and Nishikawa K 2000 J. Chem. Phys. 112 4203
- [83] Mermin N D 1971 Phys. Rev. Lett. 26 169; Rehr J J and Mermin N D 1973 Phys. Rev. A 8 472
- [84] Kim Y C, Fisher M E and Luijten E 2003 Phys. Rev. Lett. 91 065701
- [85] Kiselev S B, Ely J F and Belyakov M Yu 2000 J. Chem. Phys 112 2370
- [86] Blumel S and Findenegg G H 1985 Phys. Rev. Lett. 54 447
- [87] Garcia R, Scheidemantel S, Knorr K and Chan M H W 2003 Phys. Rev. E 68 056111