Reverse Monte Carlo Simulations and Raman Scattering of an Amorphous GeSe4 Alloy Produced by Mechanical Alloying
Abstract
The short and intermediate range order of an amorphous GeSe4 alloy produced by Mechanical Alloying were studied by Reverse Monte Carlo simulations of its x-ray total structure factor and Raman scattering. The simulations were used to compute the , and partial distribution functions and the , and partial structure factors. We calculated the coordination numbers and interatomic distances for the first and second neighbors and the bond-angle distribution functions . The data obtained indicate that the structure of the alloy has important differences when compared to alloys prepared by other techniques. There are a high number of Se-Se pairs in the first shell, and some of the tetrahedral units formed seemed to be connected by Se-Se bridges.
pacs:
61.10.Eq, 61.43.Bn, 05.10.Ln, 87.64.JeI Introduction
Amorphous semiconductor materials like chalcogenide glasses present a great potential for application in technological devices, such as optical fibers, memory materials and switching devices, but their use is limited due to several factors. One of them is the difficulty in obtaining information about atomic structures, which define the short-range order (SRO) of the alloy. In this context, the structures of amorphous GexSe1-x (a-GexSe1-x) and liquid GexSe1-x (l-GexSe1-x), in particular Ge33Se67 (GeSe2), have been extensively studied by several experimental techniques, like neutron diffraction (ND) Rao et al. (1998); Penfold and Salmon (1991); Salmon and Petri (2003); Petri and Salmon (2002); Petri et al. (2000), x-ray diffraction (XRD) Tani et al. (2001); Machado et al. (2004a), extended x-ray absorption fine structure (EXAFS) Gulbrandsen et al. (1999); Zhou et al. (1991) and Raman spectroscopy (RS) Takeuchi et al. (1998); Sugai (1987); Boolchand et al. (2001). On the theoretical side, molecular dynamics simulations (MD) Vashishta et al. (1989a, b); Massobrio et al. (1998, 2001); Massobrio and Pasquarello (2001); Cobb et al. (1996); Cobb and Drabold (1997); Zhang and Drabold (2000); Haye et al. (1998) and reverse Monte Carlo (RMC) simulations Machado et al. (2004a) have been carried out to understand the SRO in these liquids and glasses in terms of two possible and distinct models. In the first one the distribution of bonds in the structure is purely randomic and determined by the local coordination numbers and composition. In the second one, there is a strong SRO and the structure is formed by well defined structural units, e.g., corner-sharing GeSe4/2 (CS) tetrahedral and edge-sharing Ge2Se8/2 (ES) bitetrahedral units. The distribution of these units gives raise to a medium, or intermediate, range order (IRO), whose signature is the appearance of a first sharp diffraction peak (FSDP) in the neutron Petri et al. (2000); Rao et al. (1998); Salmon and Petri (2003); Petri and Salmon (2002) or x-ray structure factors Tani et al. (2001); Machado et al. (2004a) at many compositions. In particular, ND experiments performed on melt-quenched Petri et al. (2000); Salmon and Petri (2003); Petri and Salmon (2002) (MQ) GeSe2 (MQ-GeSe2) showed a FSDP in the total structure factor which was associated with correlations in the range of 5–6 Å. As described in Ref. Petri et al., 2000, this alloy is formed by CS and ES units with heteropolar bonds but there are homopolar bonds in very small quantities. It should be noted, however, that almost all available data about a-GexSe1-x alloys were determined for MQ samples, and the preparation method can affect the SRO and IRO. We have recently verified this assumption in a study about the structure of a-Ge30Se70 Machado et al. (2004a) produced by Mechanical Alloying (MA) Suryanarayana (2001). In our case, an unexpected large number of Se-Se pairs is found in the first coordination shell, suggesting that the tetrahedral units are linked by Se-Se “bridges”. Takeuchi et al. Takeuchi et al. (1998), by comparing the structures of a-Ge30Se70 produced by MQ and by vacuum evaporation (VE) techniques, and Tani et al. Tani et al. (2001) studying the a-GeSe2 produced by Mechanical Grinding (MG) of its crystalline counterpart have also found some structural differences among alloys produced by different methods. These differences are important because some physicochemical properties can be altered and improved as desired by choosing an appropriate preparation method.
In this paper, we investigated the SRO and IRO of an amorphous GeSe4 alloy produced by MA (MA-a-GeSe4) starting from the elemental powders of Ge and Se using Raman spectroscopy (RS), X-ray diffraction and reverse Monte Carlo (RMC) simulations McGreevy and Pusztai (1988); McGreevy (1995); RMC ; McGreevy (2001) of its XRD . We were interested in studying two main points. First of all we would like to know if the alloy produced by MA contains CS or ES units. Besides that, even if these units are formed the SRO and the IRO of the alloy can be significantly altered by the high quantity of defects and disorder introduced by the MA process when compared to MQ samples, for instance. Therefore, the second point is to determine the local structure of the alloy itself, finding coordination numbers and interatomic distances. At our knowledge, this is the first time that such study is reported concerning an a-GeSe4 alloy produced by MA.
II Theoretical Background
II.1 Structure Factors
II.1.1 Faber and Ziman structure factors
According to Faber and Ziman Faber and Ziman (1965), the total structure factor is obtained from the scattered intensity per atom through
where is the transferred momentum, are the partial structure factors and are given by
and
Here, is the atomic scattering factor and is the concentration of atoms of type . The partial reduced distribution functions are related to through
From the functions the partial radial distribution function can be calculated by
where is the density of the alloy (in atoms/Å3). Interatomic distances are obtained from the maxima of and coordination numbers are calculated by integrating the peaks of .
II.1.2 Bathia and Thornton structure factors
The Bathia-Thornton (BT) structure factors can be related to the FZ ones Bathia and Thornton (1970). For a binary alloy the BT number-number structure factor is given by
| (1) |
where are the FZ partial structure factors and is the concentration of element . The BT number-concentration structure factor is
| (2) |
and the BT concentration-concentration structure factor is found through
| (3) |
II.2 RMC Method
The basic idea and the algorithm of the standard RMC method are described elsewhereMcGreevy and Pusztai (1988); McGreevy (1995); RMC ; McGreevy (2001) and its application to different materials is reported in the literature Rosi-Schwartz and Mitchell (1994); Mellergard and McGreevy (1999); Karlsson et al. (2000); Jóvári and Pusztai (2001); Keen and McGreevy (1990); Bionducci et al. (1999); Wicks and McGreevy (1995); DiCicco et al. (2000); Machado et al. (2002); de Lima et al. (2003); Iparraguirre et al. (1993); Ohkubo et al. (2001); Pusztai and Sváb (1993). In the RMC procedure, a three-dimensional arrangement of atoms with the same density and chemical composition of the alloy is placed into a cell (usually cubic) with periodic boundary conditions and the functions corresponding to it are directly calculated through
where is the number of atoms at a distance between and from the central atom, averaged over all atoms. By allowing the atoms to move (one at each time) inside the cell, the functions can be changed and, as a consequence, and are changed. Thus, is compared to the factor in order to minimize the differences between them. The function to be minimized is
| (4) |
where the sum is over experimental points and is related to the experimental error in . If the movement decreases , it is always accepted. If it increases , it is accepted with a probability given by ; otherwise it is rejected. As this process is iterated decreases until it reaches an equilibrium value. Thus, the atomic configuration corresponding to equilibrium should be consistent with the experimental total structure factor within the experimental error. By using the functions the coordination numbers and interatomic distances can be calculated. In addition, the bond-angle distributions can also be determined.
III Experimental Procedures
The MA-a-GeSe4 alloy was produced by considering a binary mixture of high-purity elemental powders of germanium (Alfa Aesar 99.999% purity, particle size 150 m) and selenium (Alfa Aesar 99.999% purity, particle size 150 m) that was sealed together with several steel balls into a cylindrical steel vial under an argon atmosphere. The ball-to-powder weight ratio was 5:1. A Spex Mixer/Mill model 8000 was used to perform MA at room temperature. The mixture was continuously milled for 50 h. A ventilation system was used to keep the vial temperature close to room temperature. The XRD pattern was recorded in a powder Siemens diffractometer equipped with a graphite monochromator, using the CuKα line ( Å). The total structure factor was computed from the XRD pattern after corrections for polarization, absorption, and inelastic scattering, following the procedure described by Wagner Wagner (1972). The and values were taken from a table compiled by Sasaki Sasaki (1984). Raman measurements were performed with a T64000 Jobin-Yvon triple monochromator coupled to a cooled CCD detector and a conventional photon counting system. The 5145 Å line of an argon ion laser was used as exciting light, always in backscattering geometry. The output power of the laser was kept at about 200 mW to avoid overheating the samples. All Raman measurements were performed at room temperature.
IV Results and Discussion
IV.1 Raman Scattering
Figure 1 shows the RS spectra of MA-a-GeSe4, c-Se and c-Ge. The alloy has bands at around 195, 215, 237 and 255 cm-1. The band at 195 cm-1 is associated with the breathing mode of CS units and the 215 cm-1 band is related to the breathinglike motions (companion peak) of Se in the ES units Sugai (1987); Wang et al. (1998); Popovic et al. (1998). The difference in the intensities of these peaks indicates that the alloy is formed basically by CS tetrahedra and ES tetrahedra are found in a small quantity. The very weak shoulder around 237 cm-1 is associated with and modes of Se chains, and they are also seen in c-Se (see Fig. 1). The broad and intense band at 255 cm-1 is related to and modes of Sen rings Wang et al. (1998); Popovic et al. (1998); Takeuchi et al. (1998); Gulbrandsen et al. (1999); Kohara et al. (1998). It is important to note that the band at around 165 cm-1, which is associated with Ge-Ge pairs vibrations in ethanlike units, is not seen in the spectrum of the alloy (as well as the other bands of c-Ge), indicating that the quantity of Ge-Ge pairs is very low in the alloy. In addition, the bands related to Se-Se pairs are not seen in the spectra of the alloys produced by MQ Wang et al. (1998) or VE Takeuchi et al. (1998) techniques at this composition, but they exist in MA-a-Ge30Se70 Machado et al. (2004a) and in MA-a-GeSe4, and their intensities suggest that the number of Se-Se pairs in our alloy may be relevant. These results indicate that the tetrahedral units are formed during the MA process and there is a preference for CS units.

IV.2 X-ray Diffraction and RMC Simulations
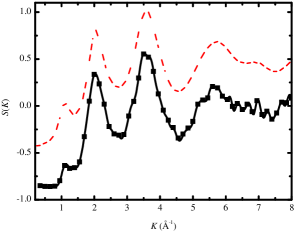
Figure 2 shows the experimental XRD (full line) for our alloy and the experimental ND (dashed line) given in Ref. Petri and Salmon, 2002 for MQ-a-GeSe4. The FSDP is seen at around 1.1 Å-1. It is lower than those shown in Refs. Petri and Salmon, 2002 and Rao et al., 1998, indicating that the IRO in the alloy produced by MA is less pronounced than in the MQ-GeSe4 samples Rao et al. (1998); Petri and Salmon (2002). The FSDP is known to be much dependent on Ge-Ge and, to a lesser extent, on Ge-Se correlations Fuoss et al. (1981); Moss (1974); Vashishta et al. (1989b); Salmon and Petri (2003). Therefore these correlations have a different behavior in MA-a-GeSe4. This fact is also verified in MA-a-Ge30Se70 Machado et al. (2004a).
was simulated using the RMC program available on the Internet RMC . To perform the simulations we have considered a cubic cell with 16000 atoms (3200 Ge and 12800 Se), , and a mean atomic number density atoms/Å3. This value was found from the slope of the straight line () fitting the initial part (until the first minimum) of the total function Waseda (1980). The minimum distances between atoms were fixed at the beginning of the simulations at Å, Å and Å. The obtained from the simulations (squares) is also shown in Fig. 2 and there is a very good agreement with the experimental .
First hard sphere simulations without experimental data were carried out to avoid possible memory effects of the initial configurations in the results. Then unconstrained runs (i.e. when only hard sphere diameters and experimental data were used during the simulation) were carried out. These runs led to essentially identical functions, because of the proximity of the atomic numbers and scattering factors of Ge and Se. In the next series of simulations we used the coordination numbers we have found for MA-a-Ge30Se70 Machado et al. (2004a) as starting coordination constraints (, and ), which were then allowed to vary freely. The results obtained from the best simulation achieved are shown in Fig. 2 and they are discussed below. As a final test, we also tried to make simulations forcing the Se-Se coordination to be two, as it is in a-Se, but again the simulations did not show a good convergence. When this constraint is released, the Se-Se coordination number decreases until it reaches the number we found for the previous case (, see text below). This indicates that there are no amorphous or crystalline selenium in the mixture, and the Raman bands at 237 and 255 cm-1 are associated with Se atoms that belong to the MA-a-GeSe4 alloy.
IV.2.1 Pair Distribution Functions
Figure 3 shows the functions obtained from the RMC simulations of MA-a-GeSe4 compared to those found experimentally for MQ-GeSe2 using ND with isotopic substitution Salmon and Petri (2003). Since the functions shown in Fig. 3 of Ref. Petri and Salmon, 2002 for MQ-GeSe4 were calculated and their combination do not reproduce quite well the experimental function for this alloy, we have chosen not to compare our results with those functions. We have also added to Fig. 3 the functions obtained for MA-a-Ge30Se70 Machado et al. (2004a) since it is interesting to compare both alloys produced by MA. The intensity of the first peak in is higher in the present alloy, confirming their existence in a larger quantity in the first coordination shell, as indicated by the RS measurement. The two first peaks of the function, which correspond to Ge-Ge first and second neighbors, show up around 2.35 and 3.80 Å. The first peak occurs at a distance a little shorter than that found in MQ-GeSe2 Petri et al. (2000); Salmon and Petri (2003), but the second is displaced towards higher-r values by 0.23 Å. In addition, the peak at around 3.0 Å seen in MQ-GeSe2 is not resolved in MA-a-GeSe4. Remembering that the distance between two Ge atoms in adjacent ES and CS units are found at 3.02 Å and 3.60 Å, respectively Cobb et al. (1996); Vashishta et al. (1989b), it can be seen that the fraction of ES units in MA-a-GeSe4 is low, again in agreement with the results obtained by RS. Since the intensity of the FSDP in seems to be related to the quantity of ES tetrahedra Vashishta et al. (1989a, b); Cobb et al. (1996); Cobb and Drabold (1997), the low quantity of ES units in our alloy could explain the low intensity of the FSDP.
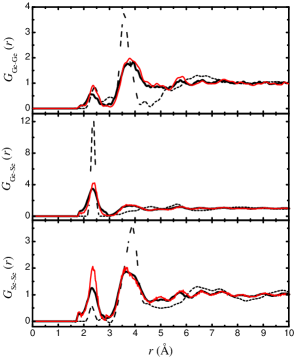
The first peak of function is located at 2.36 Å. This shell in our alloy is lower and broader than in MQ-GeSe2 but, due to the difference in densities, Ge-Se coordination numbers are almost the same in both alloys. The next peak appears at 3.84 Å, and it is higher than that at 4.95 Å. In the MQ-GeSe2 samples, there is a peak around 3.02 Å which is not seen, or at least not resolved, in MA-a-GeSe4, and there are peaks at 3.78 Å (smaller) and 4.66 Å (higher). In c-GeSe2 an ES Ge atom has Se neighbors in the range Å, and a CS Ge atom has Se neighbors in the range Å Penfold and Salmon (1991); Rao et al. (1998) Then, we have associated the peak at 3.80 Å with CS units and that at 4.95 Å with CS and ES units.
The first peak of function is located at 2.33 Å, and it corresponds to a coordination number , which is much higher than that obtained for the MQ-GeSe2 samples () Petri et al. (2000); Salmon and Petri (2003). This suggests that some of the tetrahedral units are connected by Se “bridges”, forming sequences such as Ge-Se-Se-Se-Ge. As a consequence, Ge-Ge pairs should be found at higher distance values. This agrees with the results obtained from the function. The next peak appears at 3.75 Å, which gives a ratio of Ge-Se:Se-Se distances of 0.632. The value expected for ideal tetrahedral coordination is , indicating that the tetrahedral (CS or ES) units are distorted in our alloy. It is interesting to note that in MQ-GeSe2 samples no peaks are found from Å to Å either considering ND results Petri et al. (2000); Salmon and Petri (2003) or MD simulations Vashishta et al. (1989b); Zhang and Drabold (2000). On the other hand, in MA-a-GeSe4 there are peaks at 4.95 and 5.75 Å, and we believe these peaks are related to the distances between Se atoms in the “bridges” and Se atoms in tetrahedral units. These features were also found in MA-a-Ge30Se70 Machado et al. (2004a). The peaks at around 6.6 and 7.4 Å, which are also seen in MQ-GeSe2 samples, can be associated, following Ref. Vashishta et al., 1989b, to distances between Se atoms belonging to two adjacent tetrahedral units.
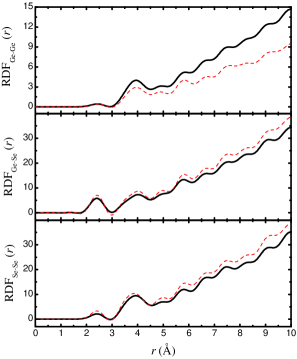
The coordination numbers show in Table 1 were calculated considering the RDF functions shown in Fig. 4. The integrations were made using the following ranges: from 1.7 Å to 2.95 Å to the first peak and from 2.95 Å to 4.5 Å to the second peak, for all RDF functions. The interatomic distances are also shown in Table 1. For a comparison, Fig. 4 also shows the RDF functions for MA-a-Ge30Se70, and its structural data are also shown in Table 1. It is interesting to note that except for Ge-Ge pairs, coordination numbers are always larger in MA-a-GeSe4 than in MA-a-Ge30Se70. If we compare our results with those found by MD simulations of l-GeSe4 Haye et al. (1998), in which it is found , and , a large increase in the homopolar coordination numbers is seen, suggesting that the liquid and the amorphous alloy produced by MA have important differences from the structural point of view. This was also verified in an amorphous Ga50Se50 alloy produced by MA studied recently by us Machado et al. (2004b).
| RMC | ||||||||
|---|---|---|---|---|---|---|---|---|
| First Shell | Second Shell | |||||||
| Bond Type | Ge-Ge | Ge-Se | Se-Ge | Se-Se | Ge-Ge | Ge-Se | Se-Ge | Se-Se |
| 0.22 | 3.61 | 0.90 | 1.71 | 2.70 | 8.3 | 2.1 | 10.1 | |
| (Å) | 2.35 | 2.36 | 2.36 | 2.33 | 3.80 | 3.84 | 3.84 | 3.75 |
| MA-a-Ge30Se70 Machado et al. (2004a) | ||||||||
| Bond Type | Ge-Ge | Ge-Se | Se-Ge | Se-Se | Ge-Ge | Ge-Se | Se-Ge | Se-Se |
| 0.26 | 3.50 | 1.75 | 1.25 | 3.85 | 7.4 | 3.7 | 9.7 | |
| (Å) | 2.33 | 2.35 | 2.35 | 2.33 | 3.83 | 3.84 | 3.84 | 3.75 |
| MQ-GeSe2 studied by ND Petri et al. (2000); Salmon and Petri (2003) | ||||||||
| Bond Type | Ge-Ge | Ge-Se | Se-Ge | Se-Se | Ge-Ge | Ge-Se111These numbers are not given in Refs. Salmon and Petri, 2003 or Petri et al., 2000 due to the difficulty in defining the second shell. | Se-Ge | Se-Se |
| 0.25 | 3.7 | 1.8 | 0.20 | 3.2 | - | - | 9.3 | |
| (Å) | 2.42 | 2.36 | 2.36 | 2.32 | 3.57 | - | - | 3.89 |
| l-GeSe2 studied by ND Penfold and Salmon (1991) | ||||||||
| Bond Type | Ge-Ge | Ge-Se | Se-Ge | Se-Se | Ge-Ge | Ge-Se | Se-Ge | Se-Se |
| 0.25 | 3.5 | 1.7 | 0.23 | 2.9 | 4.0 | 2.0 | 9.6 | |
| (Å) | 2.33 | 2.42 | 2.42 | 2.30 | 3.59 | 4.15 | 4.15 | 3.75 |
IV.2.2 Partial Structure Factors
The partial are shown in Fig. 5, together with the found in Ref. Salmon and Petri, 2003 and also with the for MA-a-Ge30Se70 Machado et al. (2004a). has its first three peaks at about 1.1 (very weak), 1.9 and 3.4 Å-1 and two minima at 1.2 and 2.8 Å-1. Their positions agree reasonably well with those found for MQ-GeSe2 studied by ND Petri et al. (2000); Salmon and Petri (2003), but intensities are very different. The first peak is lower in MA-a-Ge30Se70 and almost unresolved in MA-a-GeSe4. This peak is associated with the FSDP in the shown in Fig. 2 and, since the FSDP is known to be strongly dependent on the Ge-Ge correlations and, to a lesser extent, on the Ge-Se correlations Fuoss et al. (1981); Moss (1974); Vashishta et al. (1989b), the low intensity FSDP experimentally observed in Fig. 2 could be caused by weak Ge-Ge and Ge-Se correlations at its position. In addition, the heights of the second and third peaks are almost the same, and in MQ samples the height of the second peak is twice of that of the third peak.
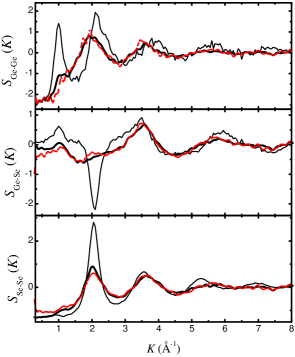
has two maxima at 1.1 and 3.5 Å-1 and a minimum at 1.7 Å-1. Again, the first peak of MA-a-GeSe4 is lower than that found in MQ-GeSe2 samples, but its position is the same, and it is also associated with the FSDP in . The second peak and the first minimum in MQ samples are found at 3.5 Å-1 and 2.1 Å-1, respectively, indicating that in our alloy they are dislocated to higher (the maxima) and lower- (the minimum) values. These facts can be explained by the important differences between the function and that of the MQ samples for Å.
has two peaks at around 2.0 and 3.6 Å-1, and there is a minimum at 2.8 Å-1. At about 1.2 Å-1 there is a small peak associated with the FSDP in . In MQ-GeSe2 samples the peaks are seen at 0.95, 2.05 and 3.55 Å-1, and there is a minimum at 2.75 Å-1. These data indicate that is similar to that of MQ-GeSe2 samples, at least in the low- region, concerning peak positions. However, we should note that their heights are different, in particular the intensity of the peak at 2.0 Å-1.
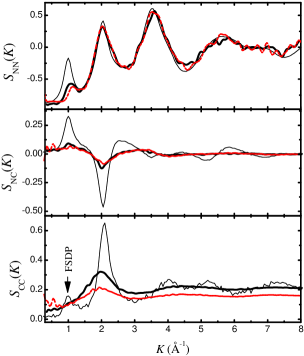
It is important to compare our results considering the BT formalism. Figure 6 shows the , and factors obtained using Eqs. 1, 2 and 3, together with those factors found by ND and shown in Ref. Salmon and Petri, 2003. As expected, resembles the XRD because the scattering lengths of Ge and Se are almost the same, and it is very similar to the found for MQ-GeSe2, except for the FSDP intensity at 1.0 Å-1. Although there are differences in the peak intensities, resembles that found for l-GeSe2 Penfold and Salmon (1991); Massobrio et al. (1998, 2001); Salmon (1992) and for MQ-GeSe2 Salmon and Petri (2003), including the sharp minimum at 2.0 Å-1. also behaves like that obtained for l-GeSe2 Penfold and Salmon (1991); Salmon (1992) and MQ-GeSe2 Salmon and Petri (2003). In l-GeSe2 a sharp FSDP is clearly seen in at around 1.0 Å-1, and this fact also occurs in MQ-GeSe2 samples. MD simulations of l-GeSe2 Massobrio et al. (1998, 2001) and MQ-GeSe2 Zhang and Drabold (2000) could not reproduce well this peak. In our case, a very weak FSDP can be seen at 1.1 Å-1 as a shoulder of the high peak at 2.0 Å-1. Remembering that the FSDP in (see Fig. 2) has a low intensity and considering all the results discussed above, we should not expect that the FSDP in was as high and well defined as it is in l- or MQ-GeSe2 samples. The IRO in MA-a-GeSe4 is different mainly because of the introduction of Se-Se first neighbor pairs as “bridges” between the tetrahedral units, thus decreasing the number of ES units and increasing the number of CS units. This affects the short and medium range order, which, in its turn, changes the concentration-concentration BT factor.
IV.2.3 Bond-Angle Distribution Functions
By defining the partial bond-angle distribution functions where is the atom in the corner we calculated the angular distribution of the bonds between first neighbor atoms. The six functions are shown in Fig. 7. All these functions were calculated considering as the position of the first minimum after the peak of the first shell ( Å).
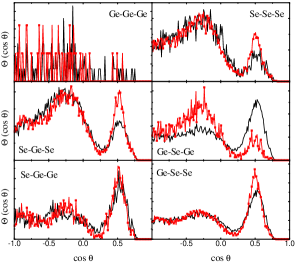
The function is very noisy because of the very small number of Ge-Ge pairs in the first shell, but it shows a tendency for angles around 100∘. The function has peaks at 55–61∘ and a broad distribution from 99 to 118∘, with a maximum at 103∘. The internal Se-Se-Se angles in perfect tetrahedra are found at , the Se-Se-Se angle in trigonal Se is seen at 103∘ and the angles in small Se chains and rings Kohara et al. (1998) can be found at 90–116∘. Thus, the function indicates that the tetrahedra in MA-a-GeSe4 are slightly distorted and Se chains and rings are formed, in agreement with RS results and with the previous analyses of the functions. The function is very similar to the function, showing peaks at 58∘ and 105∘, which is close to the ideal tetrahedral angle of 109∘.
The function peaks at about 58∘ and 106∘. The Ge-Se-Ge sequence in ES units has angles around 80∘ that are not seen in this function, reinforcing the small quantity of these units. On the other hand, this sequence in CS units has angles around 100∘, and -fold rings have angles ranging from 92∘ to 125∘.Cobb et al. (1996); Kohara et al. (1998) The and functions are similar to the others, having peaks at 58∘, associated with threefold rings, and at 116∘ (Se-Ge-Ge) and 109∘ (Ge-Se-Se), which are related to tetrahedral angles and -fold rings. The functions above confirm that distorted tetrahedral units are formed in MA-a-GeSe4, with a clear preference for CS units. These units seem to be connected by Se-Se bridges, forming small chains and rings, as pointed out by the RS data.
V Conclusion
To summarize, we can conclude that the amorphous GeSe4 alloy can be produced by MA starting from the elemental powders of Ge and Se, but the structure of the alloy is different from that found in MQ-, VE- or MG-GeSe2 or MQ-GeSe4 samples, making clear the importance of the preparation technique. Structural units similar to distorted CS and ES tetrahedra are formed, with a preference for CS tetrahedra, as indicated by Raman spectroscopy. These units seem to be connected by Se-Se bridges, as suggested by the high number of these pairs in the first shell, by the increase in the distance between Ge-Ge second neighbors, by the functions and also by RS vibrational data. These differences in the SRO affect the IRO of the alloy, and this causes the low intensity of the FSDP in of MA-a-GeSe4 when compared to the MQ-GeSe4 alloy Petri and Salmon (2002). The low intensity of the FSDP in can be traced back to the partial factor, whose FSDP is related to the ES units, which are found in a small quantity in the alloy. reflects these features and shows a very weak FSDP when compared to the factor found for l-GeSe2 Massobrio et al. (1998, 2001); Penfold and Salmon (1991) or MQ-GeSe2 Salmon and Petri (2003).
As a second remark, this study reinforces the relevance of using and combining RMC simulations with other techniques to model amorphous structures, since all features described above were obtained considering directly the experimental in the simulations.
Acknowledgements.
We would like to thank the Brazilian agencies CNPq, CAPES and FAPESP for financial support. We are indebted to Dr. Philip Salmon (University of Bath) for sending the data on MQ-GeSe2 and MQ-GeSe4.References
- Rao et al. (1998) N. R. Rao, P. S. R. Krishna, S. Basu, B. A. Dasannacharya, K. S. Sangunni, and E. S. R. Gopal, J. Non-Cryst. Solids 240, 221 (1998).
- Penfold and Salmon (1991) I. T. Penfold and P. S. Salmon, Phys. Rev. Lett. 67, 97 (1991).
- Salmon and Petri (2003) P. S. Salmon and I. Petri, J. Phys.: Cond. Matter 15, S1509 (2003).
- Petri and Salmon (2002) I. Petri and P. S. Salmon, Phys. Chem. Glasses 43C, 185 (2002).
- Petri et al. (2000) I. Petri, P. S. Salmon, and H. E. Fischer, Phys. Rev. Lett. 84, 2413 (2000).
- Tani et al. (2001) Y. Tani, Y. Shirakawa, A. Shimosaka, and J. Hidaka, J. Non-Cryst. Solids 293–295, 779 (2001).
- Machado et al. (2004a) K. D. Machado, J. C. de Lima, C. E. M. de Campos, T. A. Grandi, and P. S. Pizani, J. Chem. Phys. 120, 329 (2004a).
- Gulbrandsen et al. (1999) E. Gulbrandsen, H. B. Johnsen, M. Endregaard, T. Grande, and S. Stølen, J. Solid State Chem. 145, 253 (1999).
- Zhou et al. (1991) W. Zhou, M. Paesler, and D. E. Sayers, Phys. Rev. B 43, 2315 (1991).
- Takeuchi et al. (1998) H. Takeuchi, O. Matsuda, and K. Murase, J. Non-Cryst. Solids 238, 91 (1998).
- Sugai (1987) S. Sugai, Phys. Rev. B 35, 1345 (1987).
- Boolchand et al. (2001) P. Boolchand, X. Feng, and W. J. Bresser, J. Non-Cryst. Solids 293–295, 348 (2001).
- Vashishta et al. (1989a) P. Vashishta, R. K. Kalia, G. A. Antonio, and I. Ebbsjö, Phys. Rev. Lett. 62, 1651 (1989a).
- Vashishta et al. (1989b) P. Vashishta, R. K. Kalia, and I. Ebbsjö, Phys. Rev. B 39, 6034 (1989b).
- Massobrio et al. (1998) C. Massobrio, A. Pasquarello, and R. Car, Phys. Rev. Lett. 80, 2342 (1998).
- Massobrio et al. (2001) C. Massobrio, A. Pasquarello, and R. Car, Phys. Rev. B 64, 144205 (2001).
- Massobrio and Pasquarello (2001) C. Massobrio and A. Pasquarello, J. Chem. Phys. 114, 7976 (2001).
- Cobb et al. (1996) M. Cobb, D. A. Drabold, and R. L. Cappelletti, Phys. Rev. B 54, 12162 (1996).
- Cobb and Drabold (1997) M. Cobb and D. A. Drabold, Phys. Rev. B 56, 3054 (1997).
- Zhang and Drabold (2000) X. Zhang and D. A. Drabold, Phys. Rev. B 62, 15695 (2000).
- Haye et al. (1998) M. J. Haye, C. Massobrio, A. Pasquarello, A. D. Vita, S. W. D. Leeuw, and R. Car, Phys. Rev. B 58, R14661 (1998).
- Suryanarayana (2001) C. Suryanarayana, Prog. Mater. Sci. 46, 1 (2001).
- McGreevy and Pusztai (1988) R. L. McGreevy and L. Pusztai, Mol. Simulations 1, 359 (1988).
- McGreevy (1995) R. L. McGreevy, Nuc. Inst. & Met. in Phys. Res. A 354, 1 (1995).
- (25) RMCA version 3, R. L. McGreevy, M. A. Howe and J. D. Wicks, 1993. available at http://www.studsvik.uu.se.
- McGreevy (2001) R. L. McGreevy, J. Phys.: Condens. Matter 13, 877 (2001).
- Faber and Ziman (1965) T. E. Faber and J. M. Ziman, Philos. Mag. 11 (1965).
- Bathia and Thornton (1970) A. Bathia and D. Thornton, Phys. Rev. B 2, 3004 (1970).
- Rosi-Schwartz and Mitchell (1994) B. Rosi-Schwartz and G. R. Mitchell, Polymer 35, 5398 (1994).
- Mellergard and McGreevy (1999) A. Mellergard and R. L. McGreevy, Acta Cryst. A 55, 783 (1999).
- Karlsson et al. (2000) L. Karlsson, A. Wannberg, R. L. McGreevy, and D. A. Keen, Phys. Rev. B 61, 487 (2000).
- Jóvári and Pusztai (2001) P. Jóvári and L. Pusztai, Phys. Rev. B 64, 14205 (2001).
- Keen and McGreevy (1990) D. A. Keen and R. L. McGreevy, Nature 344, 423 (1990).
- Bionducci et al. (1999) M. Bionducci, G. Navarra, R. Bellissent, G. Concas, and F. Congiu, J. Non-Cryst. Solids 250, 605 (1999).
- Wicks and McGreevy (1995) J. D. Wicks and R. L. McGreevy, J. Non-Cryst. Solids 192, 23 (1995).
- DiCicco et al. (2000) A. DiCicco, M. Taglienti, M. Minicucci, and A. Filipponi, Phys. Rev. B 62, 12001 (2000).
- Machado et al. (2002) K. D. Machado, J. C. de Lima, C. E. M. de Campos, T. A. Grandi, and D. M. Trichês, Phys. Rev. B 66, 094205 (2002).
- de Lima et al. (2003) J. C. de Lima, D. Raoux, J. M. Tonnerre, D. Udron, K. D. Machado, T. A. Grandi, C. E. M. de Campos, and T. I. Morrison, Phys. Rev. B 67, 94210 (2003).
- Iparraguirre et al. (1993) E. W. Iparraguirre, J. Sietsma, and B. J. Thijsse, J. Non-Cryst. Solids 156–158, 969 (1993).
- Ohkubo et al. (2001) T. Ohkubo, H. Kai, and Y. Hirotsu, Mat. Sci. Eng. A 304–306, 300 (2001).
- Pusztai and Sváb (1993) L. Pusztai and E. Sváb, J. Phys.: Condens. Matter 5, 8815 (1993).
- Wagner (1972) C. N. J. Wagner, Liquid Metals (S. Z. Beer, Marcel Dekker, New York, 1972).
- Sasaki (1984) S. Sasaki, Anomalous Scattering Factors for Synchrotron Radiation Users, Calculated using Cromer and Liberman’s Method (National Laboratory for High Energy Physics, Japan, 1984).
- Wang et al. (1998) Y. Wang, O. Matsuda, K. Inoue, O. Yamamuro, T. Matsuo, and K. Murase, J. Non-Cryst. Solids 232–234, 702 (1998).
- Popovic et al. (1998) Z. V. Popovic, Z. Jaks̆ić, Y. S. Raptis, and E. Anastassakis, Phys. Rev. B 57, 3418 (1998).
- Kohara et al. (1998) S. Kohara, A. Goldbach, N. Koura, M.-L. Saboungi, and L. A. Curtiss, Chem. Phys. Lett. 287, 282 (1998).
- Fuoss et al. (1981) P. H. Fuoss, P. Eisenberger, W. K. Warburton, and A. Bienenstock, Phys. Rev. Lett. 46, 1537 (1981).
- Moss (1974) S. C. Moss, in Proceedings of the Fifth International Conference on Amorphous and Liquid Semiconductors (Taylor and Francis, London, 1974), p. 17.
- Waseda (1980) Y. Waseda, The Structure of Non-Crystalline Materials (Liquid and Amorphous Solids) (McGraw-Hill, New York, 1980).
- Machado et al. (2004b) K. D. Machado, P. Jóvári, J. C. de Lima, C. E. M. de Campos, and T. A. Grandi, J. Phys.: Condens. Matter 16, 581 (2004b).
- Salmon (1992) P. S. Salmon, Proc. R. Soc. London 437, 591 (1992).