Channel Formation and Intermediate Range Order in Sodium Silicate Melts and Glasses
Abstract
We use inelastic neutron scattering and molecular dynamics simulation to investigate the interplay between the structure and the fast sodium ion diffusion in various sodium silicates. With increasing temperature and decreasing density the structure factors exhibit an emerging prepeak around 0.9 Å-1. We show, that this prepeak has its origin in the formation of sodium rich channels in the static structure. The channels serve as preferential ion conducting pathways in the relative immobile Si–O matrix. On cooling below the glass transition this intermediate range order is frozen in.
pacs:
61.20.-p,61.20.Ja,61.12.-qAlkali silicates are a paradigm for multicomponent glass forming systems in which even at typical melt temperatures the mobility of the alkali ions exceeds that of the Si–O network by orders of magnitude JoBB51 ; GuKi66 ; BrFr88 . Although such a high mobility of the alkali ions should be reflected in the underlying structure, up to now, it is still unclear how the alkali atoms are built into the Si–O network. A distribution where an increasing alkali content causes increasing homogenous disruptions of the SiO4 tetrahedal network of pure silica Zac32 ; WaBi38 does not agree with the observed drastic difference in mobility. In addition, this distribution is in conflict with the highly non–linear dependence of the viscosity on alkali concentration MaSS83 ; KnDS94 . These observations lead to ideas that propose the existence of preferential ion conducting pathways in a Si–O matrix AnCT82 ; Gre85 .
Here, we present evidence for the existence of sodium diffusion channels in the static structure. Using neutron scattering experiments and molecular dynamics simulations on various sodium silicate melts and glasses, we investigate the structure that provides the mobility of the alkali ions. We demonstrate the accuracy of the molecular dynamics model by our neutron data. Then we make use of the detailed information obtained by molecular dynamics to elucidate the observed intermediate range order as seen by neutron scattering.
Sodium di- (NS2), tri- (NS3) and tetra- (NS4) silicate glasses were synthesized from ultrapure Na2CO3 and SiO2 powders by fusion at 1500 K. For the inelastic neutron scattering experiments glassy samples were encapsulated in Pt cells giving an annular sample geometry of 40 mm in height, 22.5 mm in diameter and a 1.25 mm wall thickness. Measurements were performed at room temperature and on liquid samples at temperatures between 1200 K and 1600 K on the neutron time–of–flight spectrometer IN 6 of the Institut Laue-Langevin in Grenoble. An incident neutron wavelength of Å-1 yielded an energy resolution of (FWHM) and an accessible momentum transfer at zero energy transfer of Å-1. The raw data reduction consisted of a normalization to a vanadium standard and a correction for self absorption and container scattering.
At 1600 K the structural relaxation of the Si–O network for the investigated sodium silicates is on a nanosecond scale MeSD02 ; KnDS94 – too slow to be resolved on IN 6. Therefore, the dynamic structure factor , depending on momentum and energy transfer , exhibits a strong elastic line with an elastic structure factor that is in good approximation the static structure factor times the Debye–Waller factor . Whereas scattering on the Si and O atoms is exclusively coherent, scattering on sodium is coherent and incoherent. The incoherent scattering reflects itself in a flat background in .
The potential that was used for the molecular dynamics simulations is a slight modification of the pair potential by Kramer et al. KrMS91 which is based on ab initio calculations. More details on this potential can be found in Ref. HoKB99 . The simulations were done at various densities for systems of particles (, , and ). At the densities g/cm3 and g/cm3 systems at the temperature K, i.e. in the liquid state, were equilibrated for 3.3 ns followed by microcanonical production runs of the same length (using the velocity form of the Verlet algorithm with a time step of 1.6 fs). In each case two independent runs were done in order to improve the statistics. The equilibrated systems at the density g/cm3 were also quenched to a glass state at K using a cooling rate of about K/s. In the latter simulation the pressure was kept constant at ambient pressure which yielded a density of g/cm3 at 300 K. Note that the densities g/cm3 and g/cm3 are close to the experimental densities at K and K, respectively MaSS83 .
The central quantity for the determination of the elastic structure factor from the simulation is the time–dependent dynamic structure factor defined by
| (1) |
with
| (2) |
being the position vector of particle at time . In Eq. (1) denotes the experimental coherent scattering lengths of particle species . The elastic structure factors were estimated by the equation (with ) where the Debye–Waller factor was determined by fitting in the relaxation regime the normalized quantity to a von Schweidler law (for details see Ref. HoK02 ). Note that we have not taken into account the incoherent scattering on sodium in the calculation of because this contribution is not expected to change the shape of the function significantly.

Fig. 1a displays the elastic structure factor of glassy and viscous sodium trisilicate as seen by inelastic neutron scattering. The maximum at Å-1 corresponds to the disrupted tetrahedal Si–O network structure of alkali silicate WaSu77 ; StMD95 . With increasing temperature the elastic scattered intensity at this wave-vector is decreasing at the expense of an increasing inelastic scattering. In contrast displays an additional prepeak at Å-1 which grows with increasing temperature, indicating an enhanced probability for a correlation of atomic arrangements at distances around 6-8 Å.
In sodium disilicate MeSD02 and sodium tetrasilicate neutron scattering reveals a similar behaviour: The elastic structure factors exhibit a growing prepeak at Å-1 on temperature increase. With increasing sodium content the height of the prepeak is increasing, whereas its position remains fairly unaffected by this large change in composition (Fig. 1b). We note, that for a monoatomic system a change in the structure that is due to thermal expansion would lead – beside a slight shift of the peak positions towards a smaller value – to a decreasing intensity of the peak height with increasing temperature. Thus, the emerging prepeak in the elastic structure factors as shown in Fig. 1 does not seem to be merely caused by thermal expansion but might be related to a change in the underlying structure. In the following, we clarify this behaviour of the elastic structure factors by means of our molecular dynamics simulations.


Fig. 2 displays the “simulated” neutron scattering elastic structure factor of sodium trisilicate. At the experimental densities, exhibits the same behavior as in the neutron scattering experiment incsca : Whereas around 1.7 Å-1 the elastic scattered intensity decreases with increasing temperature (as expected), around 0.9 Å-1 a shoulder is present at K which is nearly absent in the glass at K. Also shown in Fig. 2 is the elastic structure factor at the density of g/cm3 at K. Here the shoulder around 0.9 Å-1 has a smaller amplitude than in the corresponding case at the experimental density. This gives evidence that the possible structural changes leading to a more pronounced appearance of the feature around 0.9 Å-1 in are not due to a change in temperature but due to the change in the density. Thus, the question arises whether the shoulder around 0.9 Å-1 is related to structural features that tend to disappear with increasing density.
The partial static structure factors at the experimental densities for different correlations are shown in Fig. 3: A well–pronounced peak is present in and at K and at K. Thus, the structure that leads to the peak at Å-1 does not at all disappear with increasing density. That the feature at seems to be absent in at 300 K, is due to the fact that is a linear combination of six different partial structure factors: On the one hand positive and negative contributions cancel each other (note the negative amplitude of at ), and on the other hand exhibits only a shoulder at which is less pronounced at K. Because oxygen is the majority component (about 60% of the particles in NS3) and the coherent scattering length of oxygen is significantly larger than that of sodium and silicon ( and ), gives the major contribution to and thus, the changes in are the main cause for the emerging prepeak in the experimental and simulated with increasing temperature and decreasing density, respectively.
The feature at corresponds to a distribution of sodium ions that is not homogenous on a length scale of 6–8 Å. This is illustrated by the snapshot, Fig. 4, which shows a molecular dynamics configuration of NS3 at K at the density 2.2 g/cm3. Here, the sodium ions are represented by blue spheres that are connected to each other by surfaces. For clarity, the Si and O atoms are shown as small yellow and red spheres, respectively, that are connected to each other by covalent bonds shown as sticks. Note that the size of the latter spheres does not mirror the real size of Si and O. The snapshot gives a clear picture of a network of sodium channels that percolate through the Si–O structure. The peak at in the static structure factor marks the characteristic length scale of the latter network of channels.
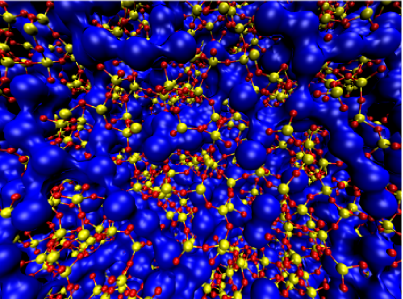
Recently, Jund et al. JuKJ01 have shown in a molecular dynamics simulation of NS4 that the sodium trajectories form a network of pockets and channels where the distance between the pockets is of the order of 5–8 Å. Then, Horbach et al. HoKB02 have given evidence in the case of NS2 that the latter network is reflected by the prepeak at in the static structure factor. Fig. 4 shows that the “structure of the sodium trajectories” is not only seen in the dynamics as claimed by Jund et al. JuKJ01 . The sodium trajectories are given by paths in a quasi–static structure of sodium diffusion channels, the lifetime of which is given by the characteristic relaxation time of the Si–O network.
A change of the Na2O content (from NS4 to NS2) or of the density does not significantly affect the position of the prepeak at as seen by molecular dynamics simulations and neutron scattering. The effect that the prepeak at becomes more pronounced in with increasing Na2O concentration (Fig. 1b) can be also explained by the simulation HoKB99 : The amplitude of the peak around Å-1 decreases with an increasing sodium content indicating a stronger disruption of the Si–O network if more sodium ions are added to the system. Moreover, Na–Na correlations contribute with a larger weight in the total structure factor and thus also the amplitude of the prepeak at increases. These findings from the simulation explain the behavior of as seen in Fig. 1b.
However, a change in the composition or the density is accompanied by a significant change in the disrupted Si–O network structure. This is indicated by the behaviour of the Si–O–Si angle: In the NS3 simulation at the experimental densities this angle increases from 134.5∘ at K (i.e. at the density of 2.46 g/cm3) to 143∘ (i.e. at the density of 2.2 g/cm3). Thus, the sodium diffusion channels are sustained over a broad range in temperature and sodium concentration because the packing of the disrupted Si–O tetrahedra is rather “flexible” with respect to the Si–O–Si angle. Of course, there should be a lower bound of sodium concentrations below which the latter rearrangements in the Si–O network are no longer possible. Indeed, at very low sodium oxide content (below about 5 mol%), a miscibility gap of Na2O and SiO2 even at typical melt temperatures has been reported mazurin .
Very recently, Lammert et al. LKH03 have investigated a lithium silicate melt by molecular dynamics simulation. They have shown that the diffusion mechanism for lithium is a kind of vacancy diffusion. Movies that we have done from the NS3 configurations such as Fig. 4 reveal a similar sodium diffusion mechanism. Thus, our picture of diffusion channels is consistent with the vacancy diffusion on a local length scale as proposed by Lammert et al. provided that also in lithium silicates diffusion channels exist. Indeed, our recent results of inelastic neutron scattering measurements KaMe03 and molecular dynamics simulations KnHB03 on various lithium and potassium bearing silicates indicate that preferential ion conduction pathways are a more general feature for alkali silicates. A neutron scattering experiment on a calcium silicate glass using Ca isotope substitution revealed a prepeak in the Ca–Ca partial structure factor GaEB91 at Å-1. In contrast to our findings in alkali silicates, the signal has been interpreted in terms of a glass structure based on ordered, densily packed domains. It remains to be seen, to what extent the existence of preferential ion conducting pathways in the static structure shown here for sodium silicates applies to other glass forming, oxide ion conductors.
In conclusion, inelastic neutron scattering experiments and molecular dynamics simulations on sodium silicate melts and glasses revealed the existence of sodium diffusion channels in the static structure. We find, that the formation of preferential ion conducting pathways is fairly unaffected by the sodium oxide concentration (in the studied composition range from sodium tetrasilicate to sodium disilicate), by a temperature change corresponding to the glass at 300 K up to the equilibrium melt, or a change of the density in the melt of about 8 %. In sodium silicates the values of the sodium ion diffusion at typical melt temperatures JoBB51 ; GuKi66 ; BrFr88 and the values of the viscosities MaSS83 ; KnDS94 depend relatively weakly on the sodium oxide concentration. The formation of sodium rich channels gives an explanation on a microscopic level for the observed macroscopic properties of mass transport in sodium silicates.
We thank Kurt Binder, Donald B. Dingwell, and Winfried Petry for their support and fruitful discussions. We are grateful to Hans Knoth for preparing Fig. 4. One of us (J. H.) was supported by the Deutsche Forschungsgemeinschaft (DFG) grant No HO2231/2–1.
References
- (1) J. R. Johnson, R. H. Bristow, and H. H. Blau, J. Am. Ceram. Soc. 34, 165 (1951).
- (2) Y. P. Gupta and T. B. King, Trans. Metall. Soc. A.I.M.E. 237, 1701 (1966).
- (3) M. Braedt and G. H. Frischat, Phys. Chem. Glasses 29, 214 (1988).
- (4) W. H. Zachariasen, J. Am. Chem. Soc. 54, 3841 (1932).
- (5) B. E. Warren and J. Biscoe, J. Amer. Ceram. Soc. 21, 259 (1938).
- (6) O. V. Mazurin, M. V. Streltsina, and T. P. Shvaiko–Shvaikovskaya, Handbook of Glass Data, Part A: Silica Glass and Binary Silicate Glasses, (Elsevier, Amsterdam, 1983).
- (7) R. Knoche, D. B. Dingwell, F. A. Seifert, and S. L. Webb, Phys. Chem. Minerals 116, 1 (1994).
- (8) C. A. Angell, P. A. Cheeseman, and S. Tamaddon, J. Phys. C9, 43, 381 (1982).
- (9) G. N. Greaves, J. Non–Cryst. Solids 71, 203 (1985).
- (10) A. Meyer, H. Schober, and D. B. Dingwell, Europhys. Lett. 59, 708 (2002).
- (11) G. J. Kramer, A. J. M. de Man, and R. A. van Santen, J. Am. Chem. Soc. 64, 6453 (1991).
- (12) J. Horbach, W. Kob, and K. Binder, Phil. Mag. B 79, 1981 (1999); Chem. Geol. 174, 87 (2001).
- (13) J. Horbach and W. Kob, J. Phys.: Condens. Matter 14, 9237 (2002).
- (14) Y. Waseda, H. Suito, Trans. Iron Steel Inst. Japan 17, 82 (1977).
- (15) Rev. Mineralogy 32, Structure, Dynamics and Properties of Silicate Melts, (1995) edited by J. F. Stebbins, P. F. McMillan, and D. B. Dingwell.
- (16) For the amplitude of is about a factor of 2–3 smaller in the simulation results than in the neutron scattering data. This discrepancy can be explained by the approximation in the calculation of that the incoherent scattering on sodium is not taken into account.
- (17) P. Jund, W. Kob, and R. Jullien, Phys. Rev. B 64, 134303, (2001).
- (18) J. Horbach, W. Kob, and K. Binder, Phys. Rev. Lett. 88, 125502 (2002).
- (19) O. V. Mazurin and E. A. Porai-Koshits, Phase separation in glass (Elsevier, Amsterdam, 1984).
- (20) H. Lammert, M. Kunow, and A. Heuer, Phys. Rev. Lett. 90, 215901 (2003).
- (21) F. Kargl, A. Meyer et al. (to be published).
- (22) H. Knoth, J. Horbach, and K. Binder (to be published).
- (23) P. H. Gaskell, M. C. Eckersley, A. C. Barnes, and P. Chieux, Nature 350, 675 (1991).