Diffuse first-order phase transition in NaNbO3:Gd
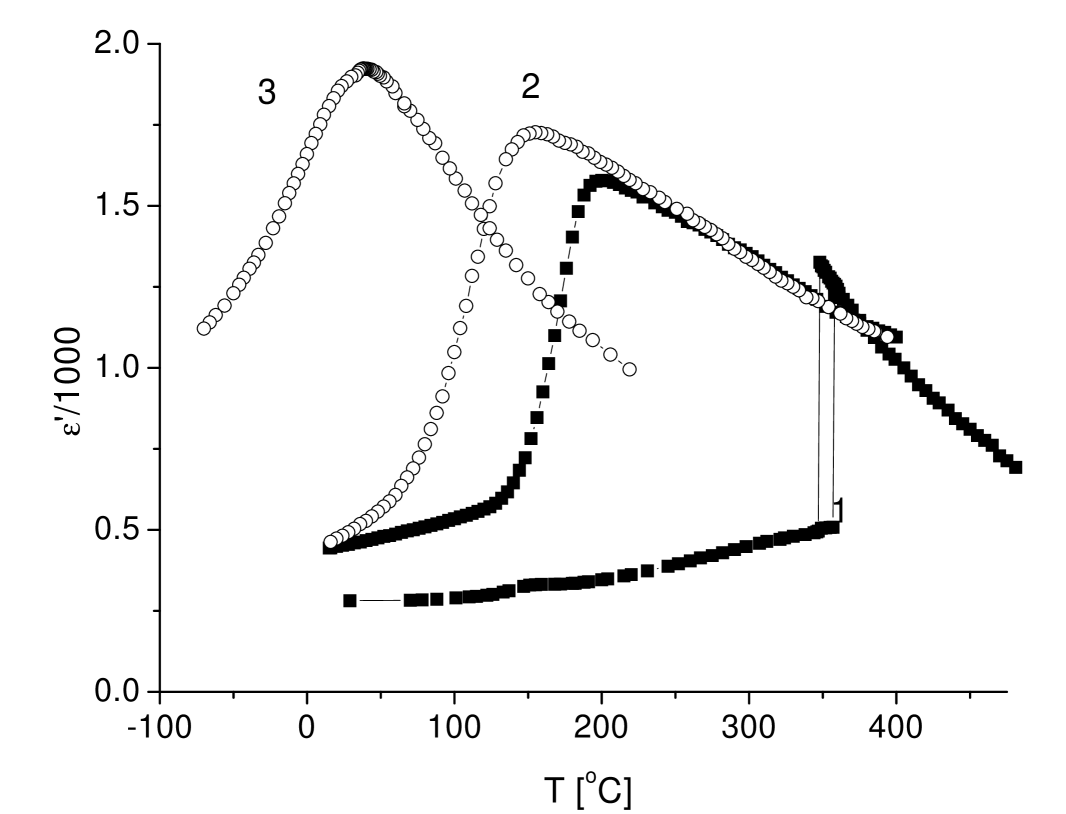
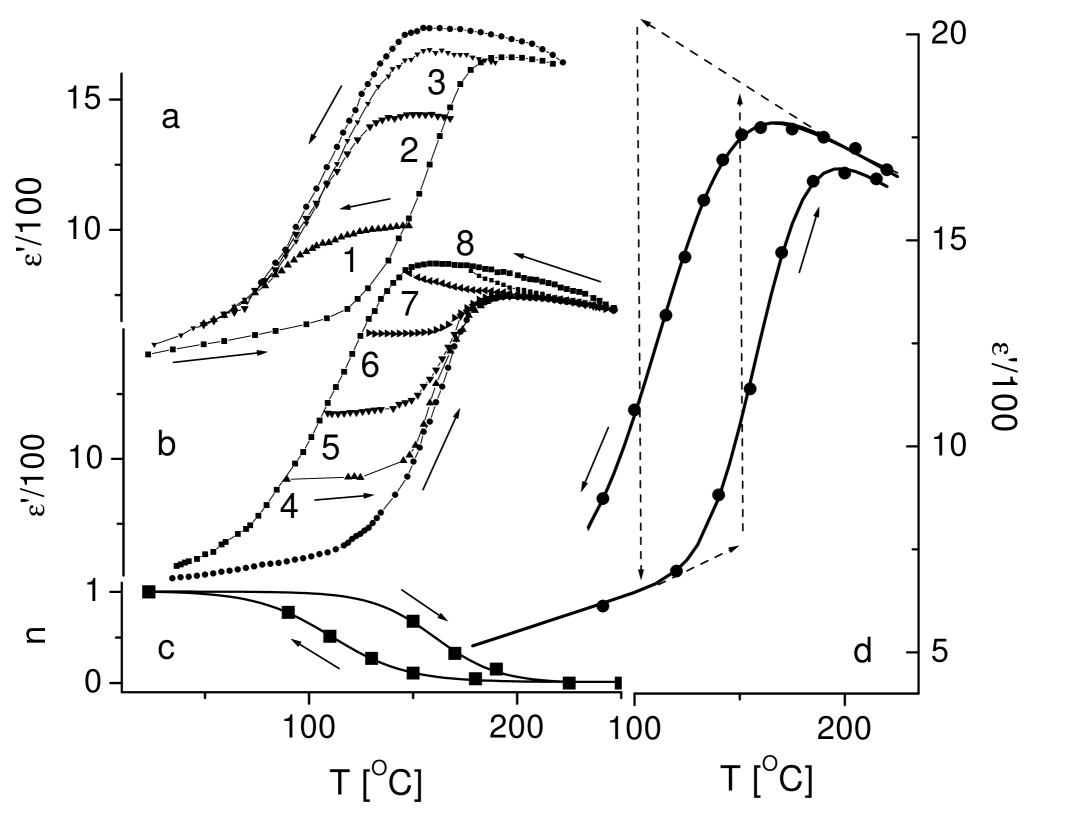
Although diffuse phase transitions have been known for a long time, in ferroelectric relaxors Smolenskii ; Cross , they have not been studied as much in perovskite-based antiferroelectrics Valant ; Such ; Raevski . Despite this, the latter have some obvious advantages in technical applications because of the absence of toxic lead and strong frequency dispersion of dielectric permittivity, , inherent to relaxors. NaNbO3:Gd(NNG) crystals were grown by the flux method Raevski . At has hysteresis (hereafter we mean thermal hysteresis of ), which disappears at higher (Fig. 1). Fig. 2 (a-b) shows obtained at heating of a NNG9 crystal up to with subsequent cooling (Fig. 2a), and cooling the crystal down to with subsequent heating (Fig 2b). It is seen that the hysteresis loop area depends on and strongly that implies that the diffuse first order phase transition in NNG9 develops step by step in finite volumes. As a result, the crystal’s state becomes inhomogeneous. The problem of describing dielectric permittivity in inhomogeneous media is usually discussed in terms of the effective medium approximation Bruggeman , within which we obtained that the fraction of the low-temperature (LT) phase is:
| (1) |
where and are the dielectric permittivities in the LT- and high-temperature (HT) phases, respectively. All these quantities can be obtained from the experiment performed. In agreement with our initial assumption, the dependence (Fig. 2c) is diffuse. One can also use the hysteresis loop area as a (nonlinear) measure of on cooling and on heating. Below, we will discuss the shape of in more details.
Temperature-dependent optical studies of NNG have been carried out by the rotating polarizer method, using the Metripol (www.metripol.com) microscope system Glazer and a precise heating stage (Linkam HFS91). NNG crystals with display distinctive changes of birefringence with temperature similar to that in NaNbO3. At the phase transition point, a spontaneous splitting into small regions (less than in size) with diffuse boundaries occurs, and the distribution of the birefringence image becomes very complex. Afar of the phase transition temperature, the scale of this non-uniformity increases up to .
The explanation of the experimental results obtained can be given in the same way as for relaxors Smolenskii ; Cross . One can introduce a distribution function for the Curie temperatures, , which, in the simplest case, can be described by a Gaussian function (this distribution is caused by internal local fields and stresses introduced by impurities Williamsb ; Molak ):
| (2) | |||||
where and are monotonic functions of temperature, which, in the first approximation, can be given by linear functions. Note that the Curie temperature of the ferroelectric phase transition is sufficiently lower than the temperature of the step. is a step function, which equals 0 at and 1 at ; erf(x) is the error function. The fit (Fig. 2d) shows that the width of the distribution function for NNG9 is about 27 K on heating and 35 K on cooling, which is nearly comparable with the hysteresis width, 44 K. We found that the distribution function width decreases with decrease of the Gd content. The results obtained allow one to suppose that the disappearance of the hysteresis and the dramatic increase of the diffuseness observed experimentally Raevski in NNG12 (see Fig. 1), may be due to a crossover between the widths of the hysteresis and the Curie temperature distribution function.
The diffuseness of a first order phase transition means coexisting two phases. This must increase the surface tension energy. Below, we discuss this surface tension contribution within a microscopic approach, which is an extension of a lattice gas model H :
| (3) |
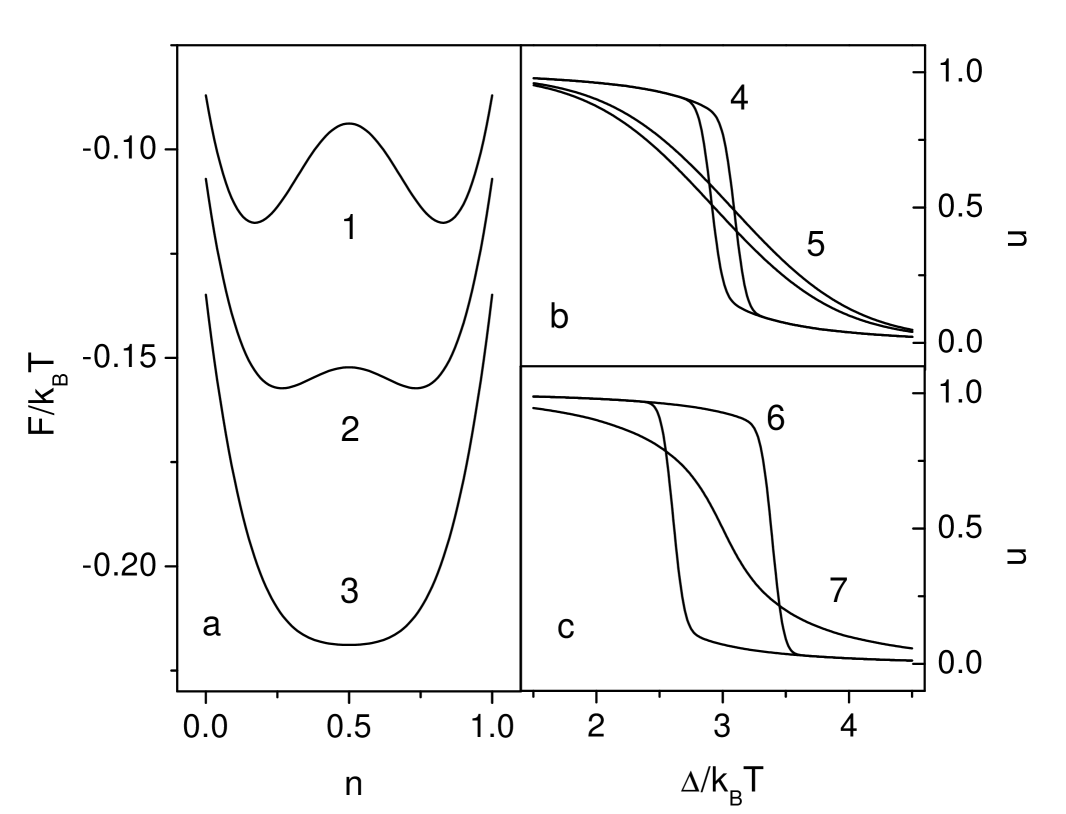
Here is a temperature dependent difference in chemical potentials of the phases, , where we suggest to be given randomly with a Gaussian distribution function at ; the eigen values of are 0 (HT phase) or 1 (LT phase); in the the second term we introduce the interface energy due to surface tension (it is positive when the nearest sites are different and zero when they coincide). The summation runs over the sites each of which is occupied by a solid either in the LT or HT phases. The summation in the last term is over the nearest neighbors only. We have derived the free energy (at a fixed value of ), in the mean field approximation: where is a mean field and is the average occupation probability of the LT phase. and may be averaged with a Gaussian function of having the width . We obtained that, the free energy has two minima at a small and at where is the number of the nearest neighbors (Fig. 3a). Increasing the width of the distribution function decreases the barrier height between the states and decreases the inclination of the curve (the measure of the sharpness of the phase transition). The real situation is, of course, more complex because of the random distribution of barriers in space (the decrease of the barriers may result in percolation of the new phase as it was found for manganates Khomskii ), but the model does give a reasonable explanation of observed behaviour: the phase transition is diffuse in spite of the surface tension the role of which is suppressed due to spreading the Curie temperatures.
References
- (1) G. A. Smolenskii, V. A. Bokov, V. A. Isupov, N. N. Krainik, R. E. Pasynkov and A. I. Sokolov, 1984 Ferroelectrics and related materials, Gordon and Breach Sci Publishers, N Y
- (2) L. E. Cross, Ferroelectrics, 76 241 (1987).
- (3) I. P. Raevski and S. A. Prosandeev, J. Phys. Chem. Sol.63, 1939 (2002).
- (4) M. Valant, D. Suvorov J. Am. Ceram. Soc. 82, 88 (1999).
- (5) J. Suchanicz, J. Kusz, H. Bohm, H. Duda, J. P. Mercurio, K. Konieczny, J. Europ. Ceram. Soc. 23, 1559 (2003).
- (6) A. M. Glazer, J. G. Lewis, W. Kaminsky, Proc. R. Soc. London, Ser. A 452, 2751 (1996).
- (7) A. Molak, J. Phys. Condens. Matter 9, 11263 (1997).
- (8) S. A. Prosandeev, I. P. Raevski, and U. V. Wagmare, AIP conference proceedings 677, 41 (2003). D. A.
- (9) G. Bruggeman, Ann. Phys. 24, 636 (1935).
- (10) T. Heimburg, Biophysical Journal 78, 1154 (2000).
- (11) D. Khomskii and L. Khomskii, Phys. Rev. B 67, 052406 (2003).