Direct relation between the low-energy spin excitations and superconductivity of overdoped high- superconductors
Abstract
The dynamic spin susceptibility, , has been measured over the energy range of meV for overdoped La2-xSrxCuO4. Incommensurate (IC) spin excitations are observed at 8 K for all superconducting samples for with peaking at meV. The IC peaks at 6 meV become smaller in intensity with increasing and, finally, become unobservable for a sample with which has no bulk superconductivity. The maximum decreases linearly with (onset) in the overdoped region, implying a direct cooperative relation between the spin fluctuations and the superconductivity.
pacs:
74.72.Dn, 75.40.Gb, 61.12.ExThe interrelationship between the magnetic fluctuations and the superconductivity in the cuprates is one of the most important features of the physics of high- superconductors. For the single CuO2 layer material, La2-xSrxCuO4 (LSCO), neutron scattering experiments have evinced strong evidence for the interdependence of the magnetism and the superconductivity Kastner_98 . Importantly, it is found that the magnetic excitations are incommensurate (IC) with the modulation direction approximately parallel to the Cu-O-Cu axis Bob_88 . The same modulated fluctuations have been confirmed in YBa2Cu3O6+y (YBCO) DaiPRL98 . It has also been found that is inversely proportional to the modulation period in the underdoped region for both LSCO Yamada98 and YBCO Dai01PRB ; chirs03 . Finally, the IC modulation direction for LSCO rotates from the diagonal Cu-Cu direction to the parallel Cu-O-Cu direction at the insulator-superconductor boundary at waki_rapid .
Another important magnetic feature correlated with the superconductivity is the magnetic resonance peak observed first in YBCO Fong95_res and more recently in Ba2Sr2CaCu2O8+y Fong_99 and Tl2Ba2CuO6+y He_02 . The resonance peak originates from a strong magnetic excitation at intermediate energies at the commensurate position. This peak is markedly enhanced below . YBCOreso Until recently no resonance had been seen in La2CuO4 (LCO)-based systems. However recent experiments in La1.875Sr0.125CuO4 Tra_04 and La1.84Sr0.16CuO4 Christensen_04 suggest that the overall dispersion of the magnetic excitations including the resonance is rather similar in YBCO and LCO-based superconductors.
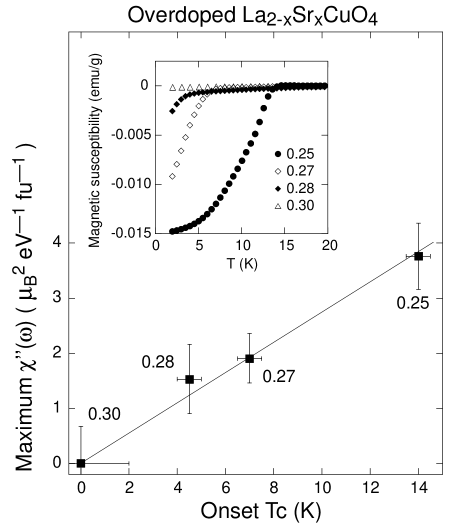
These experimental facts suggest a direct correlation between the superconductivity and the spin fluctuations, especially at low energies ( meV) in LSCO. Clearly, the behaviour in the overdoped region is particularly interesting since with increasing doping decreases progressively to zero. However, information on the spin fluctuations in the overdoped region is very sparse both because of the weak intensity of the magnetic excitations in neutron scattering and because of the difficulty in growing large high quality single crystals. In this Letter, we report a neutron scattering study of the magnetic excitations in overdoped LSCO with , 0.27, 0.28 and 0.30 with the intent of elucidating the relation between the low energy magnetic excitations for meV and the superconductivity. We find that all superconducting samples exhibit a maximum in the dynamic spin susceptibility, , at meV, and, notably, that the maximum decreases linearly to zero with (onset) in the overdoped region as shown in Fig. 1. This demonstrates a direct cooperative relation between the magnetic fluctuations and the superconductivity.
The single crystals grown by the Travelling-Solvent Floating-Zone method Hosoya94 were subsequently annealed under an oxygen pressure of 3 atm at 900 ∘C for 100 hours. Small pieces at each concentration, cut from the same crystals used for the neutron scattering experiments, have been characterized by measurement of the magnetic susceptibility. The inset in Fig. 1 shows the superconducting shielding signals measured in 10 Oe after cooling in zero field. decreases progressively with increasing , thus verifying that the actual hole concentration increases systematically in the grown crystals. The magnetic susceptibilities indicate that there is a minority phase present with a higher K whose volume fraction is at most 5 % in the total volume of each sample. Therefore, we choose as for each sample the onset temperature of the second and the largest transition, which is summarized in Table 1.
| onset (K) | (r.l.u.) | (Å-1) | |
| - | - |
Neutron scattering experiments were performed at the C5 spectrometer at the Chalk River Laboratory. For each concentration, two crystals (total volume of cc) were coaligned with the and axes in the scattering plane. Coaligned samples were mounted in a closed cycle He refrigerator and measured at temperatures down to 8 K. A vertically-focused Pyrolytic Graphite (PG) monochromator and a flat PG analyzer were used with the collimation sequence 33′-48′-S-51′-120′ (S denotes sample). All inelastic measurements were carried out with a fixed final energy of meV ( Å). A PG filter was placed after the sample to eliminate neutrons with wave lengths and . All overdoped samples were tetragonal down to the lowest temperature with typical lattice constants of Å at 8 K. Phonon intensities measured at the position showed that the volume ratios of the samples with , 0.27, 0.28, and 0.30 were 1: 1.16 : 0.98 : 1.02. All profiles of the inelastic magnetic scattering are fit to a resolution convoluted two-dimensional Lorentzian function to derive the incommensurability and intrinsic peak width , where is the thermal population factor, and the summation over has been carried out for the four peaks around . The absolute value of the dynamic susceptibility has been calculated by normalizing to the integrated intensity of a phonon at . has been calculated by integrating over in a single Brillouin zone for all four IC magnetic peaks.
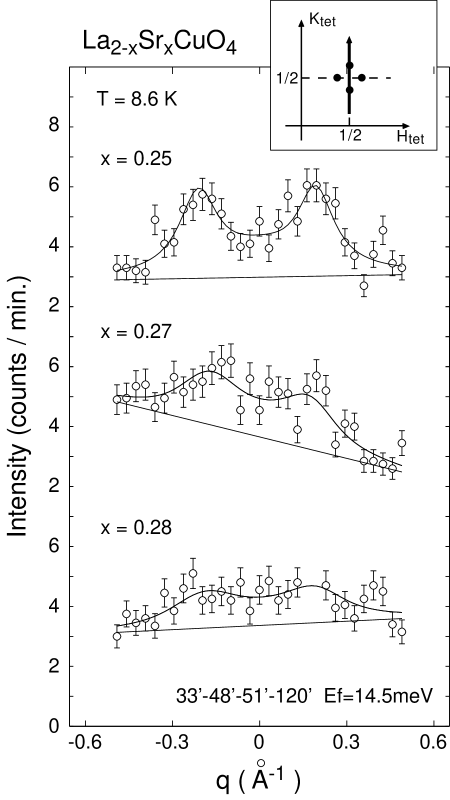
IC magnetic excitations have been observed for all superconducting samples. Representative profiles at 8 K are shown in Fig. 2, at meV for and 0.28, and at meV for . The scan trajectory is shown in the inset. The horizontal axis represents the distance from the position. The solid lines are the results of fits to the Lorentzian function convoluted with the instrumental resolution. The background levels are also adjusted in the fits. The incommensurability and the half width at half maximum obtained from the fits are listed in Table 1. Those parameters demonstrate that the incommensurability remains constant at while the peaks broaden progressively in with increasing . Although there is a small difference in volume for each concentration, it is nevertheless clear that the magnetic excitation intensity decreases progressively with increasing . Before discussing this interesting feature, we present first the energy dependence and temperature dependence of for . This sample shows the highest intensity among the concentrations studied.
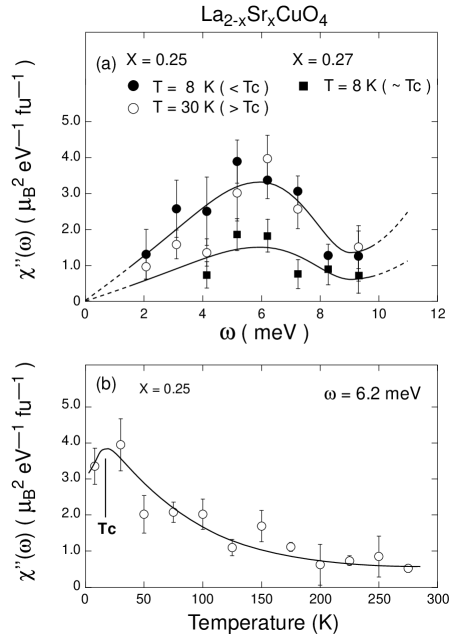
The energy dependence of at 8 K and 30 K for is shown in Fig. 3 (a) as closed and open circles, respectively. At 8 K, no clear spin gap is observed, consistent with Ref.[CHLee00, ]. Instead, we find that increases linearly with energy at meV, and has a maximum at meV, slightly lower than the energy at which in the optimally doped samples has a maximum. The linear increase of at low energy can be explained by a damped magnon model in which the response function is of the form . In this formula has a maximum at . However, a fit of our results to this function fails because of the large drop of at meV. This means that the maximum of around meV is intrinsic rather than due to the damping of magnons.
We have not observed any significant difference between the spectra at 8 K and at 30 K, that is, below and above . We believe that such a weak change in the spectrum through is characteristic of samples in the overdoped regime. The temperature dependence of at meV for is shown in Fig. 3 (b). appears to have a weak maximum around and to decrease continuously with increasing temperature up to 275 K. The same enhancement of the low-energy susceptibility at meV around has been observed for a sample with by Mason et al Mason93 . This suggests that this is a general feature for a wide hole-concentration range from the optimally-doped to the over-doped regions. This fact implies a correlation between the low energy susceptibility and the superconductivity which will be more clearly confirmed from the hole concentration dependence of that we discuss below.
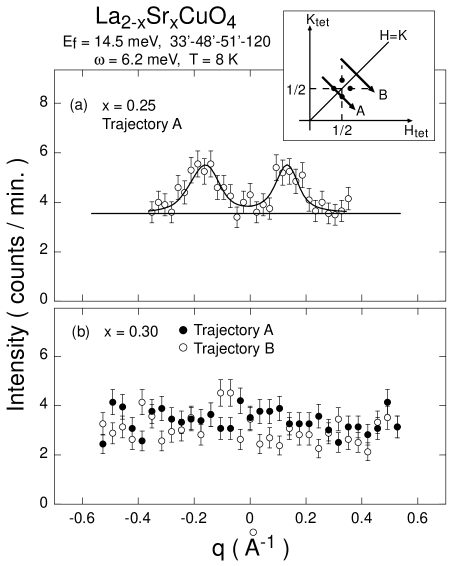
To probe further the relation between the peak at meV and the superconductivity, we have studied the hole-concentration dependence of . Since the spectrum does not change rapidly around , we have measured the magnetic response at 8 K for , 0.28 and 0.30. Clear IC peaks have been observed for at meV, while somewhat broader peaks have been observed for the sample at meV as shown in Fig. 2. The energy dependence of for is shown in Fig. 3 (a) as squares. It is seen that again has a maximum at meV. For the IC signal below 5 meV and above 7 meV is very weak and has not been detected clearly. These facts indicate that the dynamic spin susceptibility in overdoped LSCO always has a maximum around meV. Also, as shown in Fig. 2, the IC peak around meV clearly decreases in intensity with increasing hole concentration . Importantly, the IC magnetic signals become finally unobservable at which does not show bulk superconductivity for temperatures as low as K. This is clearly seen in Fig. 4, which shows scans (a) for and (b) for at meV along the trajectories displayed in the inset. Since the volumes of the and samples determined by phonon measurements are almost identical, one can compare the profiles for both concentrations directly. The IC peaks in simply disappear in the sample. Figure 4 (b) shows a comparison between scans along the two trajectories A and B, the former across the expected IC positions and the latter in the background region. Although there is a small difference between the two profiles, possibly due to poor statistics, no clear IC intensity appears for . We have also conducted scans at different energies meV, and along a trajectory across ; however no clear signal has been found. The decrease of magnetic intensity with increasing is displayed in Fig. 1 by plotting the maximum as a function of . The ambiguity of the magnetic intensity for is shown as an error bar for the data. Interestingly, the maximum is observed to be proportional to , evincing a direct and dramatic correlation between the low-energy IC spin excitations and the superconductivity.
In summary, we have shown that all superconducting overdoped samples, , 0.27 and 0.28, exhibit low-energy IC () spin excitations with an integrated susceptibility which has a maximum at meV. Further the maximum spin susceptibility decreases linearly to zero with . Finally, the low-energy spin excitations disappear coincident with the disappearance of the bulk superconductivity at . These results demonstrate a direct relation between the dynamic spin susceptibility peak at meV and the superconductivity. Our observation of the linear relation shown in Fig. 1 is limited to the overdoped region, since the spectrum exhibits different behaviours in the optimal and underdoped regions: to be specific, shows a gap below meV for optimally doped samples while for underdoped samples increases continuously with decreasing .
We conclude by observing that in LSCO the onset of superconductivity in the underdoped region coincides with a rotational transition of the direction of the low energy incommensurate spin fluctuations from diagonal to parallel to the Cu-O-Cu bond waki_rapid , while the vanishing of the superconductivity in the overdoped region is signalled by a smooth decrease in the amplitude of these parallel low energy spin fluctuations to zero. Empirically, then, in LSCO the low energy incommensurate spin fluctuations and the superconductivity are intimately correlated throughout the entire phase diagram, although the magnetic fluctuations contribute to the superconductivity in different manners at different doping levels. Clearly, this calls for a fundamental theoretical explanation.
Acknowledgements.
The authors thank G. Shirane, W. J. L. Buyers, C. Stock, B. Khaykovich, J. M. Tranquada, C. H. Lee P. M. Gehring, S.-H. Lee and S. A. Kivelson for invaluable discussions. Work at the University of Toronto is part of the Canadian Institute for Advanced Research and supported by the Natural Science and Engineering Research Council of Canada, while research at Tohoku University is supported by a Grant-in-Aid by the Japanese Ministry of Education, Culture, Sports, Science and Technology.References
- (1) M.A. Kastner et al., Rev. Mod. Phys., 70, 897 (1998).
- (2) H. Yoshizawa et al., J. Phys. Soc. Jpn. 57, 3686 (1988); R. J. Birgeneau et al., Phys. Rev. B 39, 2868 (1989); S.-W. Cheong et al., Phys. Rev. Lett. 67, 1791 (1991).
- (3) P. Dai et al., Phys. Rev. Lett. 80, 1738 (1998); H. A. Mook et al., Nature 395, 580 (1998).
- (4) K. Yamada et al., Phys. Rev. B 57, 6165 (1998).
- (5) P. Dai et al., Phys. Rev. B 63, 054525 (2001).
- (6) C. Stock et al., Phys. Rev. B 69, 014502 (2004).
- (7) S. Wakimoto et al., Phys. Rev. B 60, R769 (1999). S. Wakimoto et al., Phys. Rev. B 61, 3699 (2000). M. Matsuda et al., Phys. Rev. B. 62, 9148 (2000). M. Fujita et al., Phys. Rev. B 65, 064505 (2002).
- (8) H. F. Fong et al., Phys. Rev. Lett. 75, 316 (1995).
- (9) H. F. Fong et al., Nature 398, 588 (1999).
- (10) H. He et al., Science 295, 1045 (2002).
- (11) Detailed studies of the resonance peak in YBCO can be found, for example, in H. F. Fong et al., Phys. Rev. B 61, 14773 (2000), Ref. Dai01PRB, , Ref. chirs03, , and references therein.
- (12) J. M. Tranquada et al., cond-mat/0401621.
- (13) N. B. Christensen et al. cond-mat/0403439.
- (14) S. Hosoya et al., Physica C 235-240, 547 (1994). C. H. Lee et al., Semicond. Sci. Technol. 11, 981 (1998).
- (15) C. H. Lee et al., J. Phys. Soc. Jpn. 69, 1170 (2000); C. H. Lee et al., Phys. Rev. B 67, 134521 (2003).
- (16) T. E. Mason et al., Phys. Rev. Lett. 71, 919 (1993). T. E. Mason et al., ibid77, 1604 (1996).