Electron Scattering in AlGaN/GaN Structures
Abstract
We present data on mobility lifetime, , quantum lifetime, , and cyclotron resonance lifetime, , of a sequence of high-mobility two-dimensional electron gases in the AlGaN/GaN system, covering a density range of cm-2. We observe a large discrepancy between and (/6) and explain it as the result of density fluctuations of only a few percent. Therefore, only –and not – is a reliable measure of the time between electron scattering events in these specimens. The ratio / increases with increasing density in this series of samples, but scattering over this density range remains predominantly in the large-angle scattering regime.
In contrast to the extensively studied two-dimensional electron system (2DES) in AlGaAs/GaAs heterojunctions, the transport properties of 2DES in the more recently developed AlGaN/GaN system remain much less well understood. In particular the qualitative nature of the scattering mechanisms at low temperatures in this material remain controversial and the degree to which electron scattering is preferentially large- or small-angle is still under discussion. Electron scattering can be characterized by an average lifetime, , between events and an average scattering angle, . Since each scattering event dephases the wavefunction, the quantum lifetimes, , deduced from Shubnikov de Haas (SdH) measurement and from cyclotron resonance (CR) measurements, , are not expected to depend on , and both to be close to . In contrast, the transport lifetime, , deduced from mobility, measures the time for electron backscattering to occur. It depends heavily on and must always exceed and . For large angle scattering, is large and is very similar to and . If small angle scattering dominates, then . Hence, the ratio of and provides insight into the dominant electron scattering events Coleridge (1991); Sarma and Stern (1985).
A few groups have assessed the significance of one type of scatterers over another in AlGaN/GaN heterostructures Elhamri et al. (2000); Dimitrov et al. (2000); Brana et al. (2000); Harris et al. (2001); Frayssinet et al. (2000). Using a sample grown by molecular beam epitaxy (MBE) on a GaN template, Elhamri et al. Elhamri et al. (2000) measured a ratio of 20, suggesting the dominance of small-angle scattering in their specimen. Data from a single heterostructure grown on single-crystal GaN with = 2.4cm-2 and mobility 60, 000cm2/Vs indicated 20, again suggesting that weak scatterers play the dominant role Frayssinet et al. (2000). A common feature of all these studies is the reliance on SdH data to asses the inter-event lifetime, , which, as we will show in this report, can be unreliable in samples with even small density inhomogeneity. Also, so far there exist no data for 2cm-2. And even in the mid-cm-2 range, only sparse data exist. Lastly, there are only a few reports on CR lifetime, . None of them compares the CR lifetime data to values of or of their specimens Wang et al. (1996); Knap et al. (1996, 1997); Li et al. (2002).
Here we report on data for , , and measured on heterostructures with ranging from 1 to 4.5cm-2. All measurements are performed at 4K where, in our specimens, only scattering from static scatterers (defects, interface roughness, residual impurities, etc.) contribute, and scattering by phonons is negligible pho . Our results from modeling SdH oscillations clearly indicate that is severely affected by density inhomogeneities. We propose it not to be a good measure for the time between scattering events in our samples. Instead, provides a good measure for this inter-event lifetime and we can use it, in combination with , to deduce the average scattering angle, . Our analysis shows that the scattering events in our samples are predominantly large-angle.
| Al | Al | ||||
|---|---|---|---|---|---|
| 5 | 1.38 | 16 | 5 | 2.74 | 16 |
| 5 | 1.48 | 17.9 | 9 | 3.4 | 27 |
| 6 | 1.6 | 12 | 10 | 3.9 | 36 |
| 5 | 2.35 | 17 | 12 | 4.36 | 41 |
| 5 | 2.4 | 18 |
Our heterostructures are grown by MBE on GaN templates prepared by hydride vapor phase epitaxy (HVPE) on sapphire substrates. These templates have a typical dislocation density of 0.5-1cm-2. The 2D density, was established during growth by controlling the thickness and Al of the barrier layer. The sample parameters are listed in Table 1. Evaporated Ti/Al contacts were used to perform van der Pauw, low-field Hall and SdH measurements in the same cooldown. The first two measurements were used to determine the classical transport lifetime, , from the Drude mobility . The quantum lifetime, , was derived from SdH data using the customary expression Coleridge (1991) for the oscillatory part of the magneto-resistance. CR experiments using a Fourier transform spectrometer were performed in a separate cooldown. The CR carrier lifetime, is deduced from the half-width-at-half-maximum (HWHM=) of the broadened CR line. The magnetic field was applied perpendicular to the 2DES and the carrier density was measured in situ from the SdH oscillations.
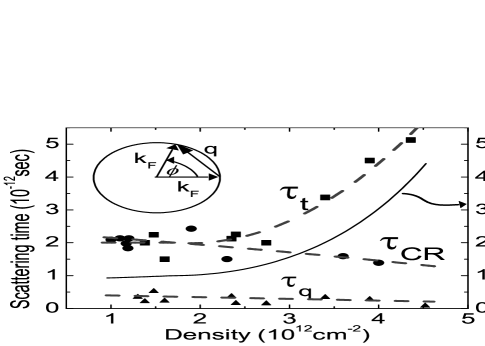
Fig.1 shows the three lifetimes plotted against 2D electron densities. In spite of the sample-to-sample scatter in the data, there are several important observations that can be made. In this series of samples, the mobility lifetime, , is roughly constant up to cm-2 and then increases as the density rises to 4.5cm-2 The CR lifetime, , is very similar to for 2.5cm-2 and then decreases slightly for higher . The quantum lifetime, , is found to be the shortest over the entire density range studied. The dashed lines drawn through the lifetimes are guides to the eye and are used for parameterization. The parameterizations are required since was measured in cooldowns separate from those for SdH and mobility measurements. This produces slightly different densities, as seen in Fig.1 and a parameterization of the data helps us compare the ’s.
We first address the central result of our work: the huge discrepancy between and . Since we have observed shifts in SdH oscillations recorded at different contacts at the sample periphery, there is strong evidence that our specimens are inhomogeneous. Different local densities contribute slightly shifted oscillations in SdH and can affect the deduced in a very significant way. On the other hand, is practically immune from density inhomogeneities across the specimen. The position of the CR resonance line , depends only on the electron mass, *, which is essentially density independent non .The line broadening is caused almost exclusively by carrier scattering. Hence, , and not , is a good measure of the inter-event lifetime, .
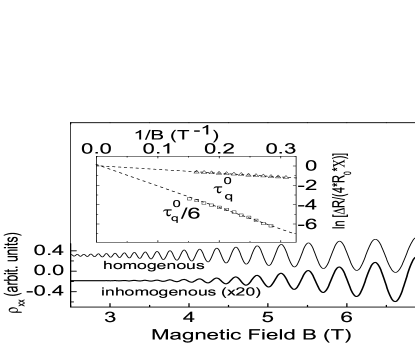
In order to model the effect of inhomogeneities we assume a Gaussian distribution of densities of given width, . The “total SdH oscillations” are then modeled as the sum of the distribution of all “partial SdH oscillations”. Mathematically this amounts to a convolution of the magnetoresistance for the central density with a Gaussian of width . Fig. 2 shows a computer generated SdH trace for a density of = 4 cm-2 and a lifetime, =1ps together with the results of a convolution with = 0.02. Note that the convoluted trace is heavily damped but free of “beating”. It demonstrates that the absence of beating in data from such high density specimens does not guarantee a homogenous electron density. Interpreting the convoluted trace as single-density experimental data yields the correct average electron density of = 4 cm-2, but a lifetime, = 0.18 ps, six times lower than the actual lifetime, . Assuming to reflect the true we performed simulations on all our specimens and deduce density inhomogeneities that decrease from =6 to 2 of as the density increases from = 1 to 4.5 cm-2. From our SdH simulations, we conclude that the ’s determined from SdH measurements are not the true quantum lifetime of the 2DES. Instead, their relatively low value is caused by small (2-6) density modulations in our samples. We emphasize that the 2DES in AlGaN/GaN is particularly susceptible to this effect due to its comparatively high electron density. In AlGaAs/GaAs systems, typically 2 cm-2 and the required for a similar suppression of is . This is much larger than the observed inhomogeneity () in AlGaAs/GaAs structures.
For the remainder of our discussion we take , to be a good measure of the inter-event lifetime, . We compare it with to learn about the average scattering angle and wavevector, and , respectively. Since the 2DES is degenerate, all scattering occurs at the Fermi energy, , between states of Fermi wavevector, . Using a simple model pictured as an inset of Fig. 1, we can write . Moreover, modeling the electron motion as a random walk, scatterings with average angle are required for backscattering to occur and hence . For each scattering event reverses the momentum. In this limit, and . For , many scattering events are required for momentum reversal. Hence, and . Using the above expressions, we can deduce and from our data. To this end we have parameterized the data of Fig. 1 and show their ratio, , in Fig. 1 (see solid line). The variation of 1 to 4.5 reveals that the average scattering angle varies from to as increases from 1 to 4.5cm-2. It indicates that large angle scattering dominates in the density regime of our samples. This observation is contrary to most reports on AlGaN/GaN and is a result of our usage of rather than as a measure for the time between scattering events. Had we used instead, the average would decrease to a range of to . Using the above expressions and our data, we can also derive the density dependence of the wavevector . Beyond 2.5cm-2 where the parameterization of our data is quite reliable (see Fig. 1) we find not to vary significantly. This indicates that scattering events of approximately constant -value, whose average angle – and hence effectiveness – decreases with increasing density, are dominant throughout this regime.
Finally, we compare our data with available theoretical results. From Fig.3 of the work of Hsu and Walukiewicz Hsu and Walukiewicz (2002) we can estimate that for 10 Al, / increases from 10 to 20 as increases from 1 to 2cm-2 and drops as the density increases further. In contrast, we measure much smaller lifetime ratios that rise continuously from 1 to 4.5 as increases from 1 to 4.5cm-2 (see our Fig. 1). The discrepancies may be due to the fact that large angle scatterers such as interface roughness and dislocations were not considered in Ref. Hsu and Walukiewicz (2002). Lifetime ratios limited by charged dislocations calculated by Jena and Mishra Jena and Mishra (2002) are found to be 10 (Ref.Jena and Mishra (2002), Fig.3 for ) and monotonically increasing up to 10cm-2. The similarities between our data and these calculations support our model in which large angle scattering dominates. In fact, the average spacing of dislocations in our specimens is 400 nm as determined from AFM measurements. The mean free path deduced from the and the Fermi velocity values ranges between 200 and 300 nm. This suggests dislocations to be a major contributor to the overall low temperature scattering.
Acknowledgements.
We would like to thank L.N. Pfeiffer, K.W. West, S. Das Sarma, A. Millis and A. Mitra for helpful discussions. A portion of the work was performed at the National High Magnetic Field Laboratory, which is supported by NSF Cooperative Agreement No. DMR-0084173 and by the State of Florida. Financial support from the W. M. Keck Foundation and the Office of Naval Research is gratefully acknowledged.References
- Coleridge (1991) P. Coleridge, Phys. Rev. B 44, 3793 (1991).
- Sarma and Stern (1985) S. D. Sarma and F. Stern, Phys. Rev. B 32, 8442 (1985).
- Elhamri et al. (2000) S. Elhamri, A. Saxler, W. C. Mitchel, C. R. Elsass, I. P. Smorchkova, B. Heying, E. Haus, P. Fini, J. P. Ibbetson, S. Keller, et al., J. Appl. Phys. 88, 6583 (2000).
- Dimitrov et al. (2000) R. Dimitrov, M. Murphy, J. Smart, W. Schaff, J. R. Shealy, L. F. Eastman, O. Ambacher, and M. Stutzmann, J. Appl. Phys. 87, 3375 (2000).
- Brana et al. (2000) A. F. Brana, C. Diaz-Paniagua, F. Batallan, J. A. Garrido, E. Munoz, and F. Omnes, J. Appl. Phys. 88, 932 (2000).
- Harris et al. (2001) J. J. Harris, K. J. Lee, T. Wang, S. Sakai, Z. Bougrioua, I. Moerman, E. J. Thrush, J. B. Webb, T. Martin, D. K. Maude, et al., Semicond. Sci. Technol. 16, 402 (2001).
- Frayssinet et al. (2000) E. Frayssinet, W. Knap, P. Lorenzini, N. Grandjean, J. Massies, C. Skierbiszewski, T. Suski, I. Grzegory, S. Porowski, G. Simin, et al., Appl. Phys. Lett. 77, 2551 (2000).
- Wang et al. (1996) Y. J. Wang, R. Kaplan, H. K. Ng, K. Doverspike, D. K. Gaskill, T. Ikedo, I. Akasaki, and H. Amono, J. Appl. Phys. 79, 8007 (1996).
- Knap et al. (1996) W. Knap, H. Alause, J. M. Bluet, J. Camassel, J. Young, M. A. Khan, Q. Chen, S. Huant, and M. Shur, Solid State Commun. 99, 195 (1996).
- Knap et al. (1997) W. Knap, S. Contreas, H. Alause, C. Skierbiszewski, J. Camassel, M. Dyakonov, J. Yang, M. A. Khan, Q. Chen, J. Yang, et al., Appl. Phys. Lett. 70, 2123 (1997).
- Li et al. (2002) Z.-F. Li, W. Lu, S. C. Shen, S. Holland, C. M. Hu, D. Heitmann, B. Shen, and Y. Zheng, Appl. Phys. Lett. 80, 431 (2002).
- (12) Simulations yield acoustic phonon limited 1 ns at 4K.
- (13) Even a 10 density fluctuation at 4 cm-2 adds only a 1 spread in * due to band non-parabolicity, which in turn broadens the CR line also at the 1 level.
- Hsu and Walukiewicz (2002) L. Hsu and W. Walukiewicz, Appl. Phys. Lett. 80, 2508 (2002).
- Jena and Mishra (2002) D. Jena and U. K. Mishra, Phys. Rev. B 66, 241307 (2002).