Infrared probe of the electronic structure and charge dynamics in Na0.7CoO2
Abstract
We present measurements of the optical spectra on Na0.7CoO2 single crystals. The optical conductivity shows two broad interband transition peaks at 1.6 eV and 3.1 eV, and a weak midinfrared peak at 0.4 eV. The intraband response of conducting carriers is different from that of a simple Drude metal. A peak at low but finite frequency is observed, which shifts to higher frequencies with increasing temperature, even though the dc resistivity is metallic. The origin of the interband transitions and the low-frequency charge dynamics have been discussed and compared with other experiments.
pacs:
78.20.-e, 71.27.+a, 74.25.Gz, 74.70.-bThe recent discovery of superconductivity at 5 K in hydrated sodium cobaltate Takada has attracted much attention, as it is a new system other than cuprates where a doped Mott insulator becomes a superconductor. The host compound NaxCoO2 consists of alternate stacking of Na and CoO2 layers in which edge sharing CoO6 octahedra lead to a two-dimensional (2D) triangular lattice of Co ions.Terasaki1 ; Terasaki2 Superconductivity occurs when Na content x is near 0.3 and sufficient water is intercalated between the CoO2 layers. This material provides a model system for studying the physics of correlated electrons in a 2D triangular lattice. It is also believed that the study of NaxCoO2 system may shed new light on high-temperature superconductivity in cuprates.
To understand the mechanism of superconductivity in this material, great effort has been paid to the investigation of its electronic structure. As the first step, attention has been given to the host compound. A detailed band structure calculation for x=0.5 compound has been performed by Singh.Singh1 Within the local density approximation (LDA), it was found that the O 2p bands are located well below the Fermi level and there is little hybridization between O 2p and Co 3d bands. The splitting between the Co 3d eg and t2g bands is very large. The conduction electrons are mainly from the t2g band and the eg band is about 2.5 eV above the Fermi level. In the rhombohedral crystal field, the t2g manifold is further split into two ag and four e bands. The ag bands contribute a large cylindrical hole Fermi surface centered at . This large Fermi surface was confirmed by the ARPES measurements Valla ; Hasan ; Yang . However, the six Fermi pockets from the e bands, predicted by the LDA, were not observed by the ARPES. On the other hand, if the effects of spin polarization were included, an itinerant ferromagnetic state was predicted to exist for x=0.3 to 0.7.Singh1 ; Singh2 ; Kunes There was no report on the existence of distinct magnetic order in this material, but a Curie-Weiss-like susceptibility was found when x 0.7. This suggests that Co ions have local moments associated with the exchange splittingTakada ; Sakurai ; Lorenz , but strong quantum fluctuations suppress the long-range ferromagnetic ordering in NaxCoO2 .Singh2
In this work, we report the in-plane optical response over broad frequencies on single crystals with x=0.7. Our measurements yield two broad interband transition peaks at 1.6 eV and 3.1 eV. The interband transition energies are significantly different from the energy difference between the occupied t2g and empty eg bands (2.5 eV) as predicted by the LDA. The physical origin for this difference will be discussed. Moreover, our experiments also revealed a weak midinfrared peak at 0.4 eV and unusual charge dynamics at low frequencies.
High-quality Na0.7CoO2 single crystals with size around 3mm3mm were grown using the flux method.Jin Fig. 1 shows the in-plane dc resistivity measured by four-contact method. The temperature dependence of is typically metallic and agrees with those reported in Ref. Hasan ; Wang ; Foo with similar Na concentration.

The crystals could be readily cleaved to obtain a fresh and shinny surface. The near-normal incident reflectance spectra were measured by a Bruker 66v/S spectrometer in the frequency range from 40 cm-1 to 29,000 cm-1 . The sample was mounted on an optically black cone in a cold-finger flow cryostat. An in situ overcoating technique was employed for reflectance measurements Homes . The optical conductivity spectra were obtained from a Kramers-Kronig transformation of R(). We use Hagen-Rubens’ relation for the low frequency extrapolation, and a constant extrapolation to 100,000 cm-1 followed by a well-known function of in the higher-energy side.
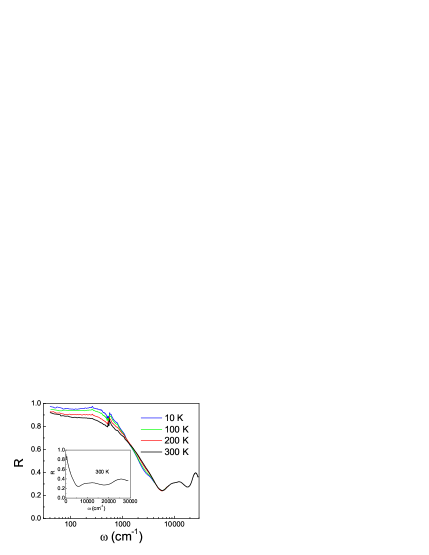
Fig. 2 shows the in-plane reflectance spectra measured at different temperatures between 10 K and 300 K. In accord with the metallic dc resistivity behavior with a positive slope, we found that the low-frequency reflectance increases with decreasing temperature. However, the reflectance in the mid-infrared region decreases with decreasing temperature and at different temperatures cross at about 1,300 cm-1 . The main spectral change caused by temperature variation is roughly below 4,000 cm-1 . The reflectance reaches a minimum (or an edge ) near 6,000 cm-1 . This frequency is close to the so-called screened plasma frequency. We note that this frequency is significantly lower than that of optimally doped cuprates like YBa2Cu3O7-δ and Bi2Sr2CaCu2O8+δ, suggesting that the conducting carrier density is lower in the present compound.
Fig. 3 shows the conductivity spectra over broad frequencies. Corresponding to the reflectance minimum, the optical conductivity also exhibits a minimum at similar frequency. The low-frequency part is mainly contributed by the conducting carriers. A sum of the spectral weight up to 6,000 cm-1 yields approximately the overall plasma frequency of 1.2104 cm-1 , which is apparently lower than the values for optimally doped cuprates obtained by the same method.Puchkov At high frequency side, two prominent interband transition peaks centered at 25,000 cm-1 (3.1 eV) and 13,000 cm-1 (1.6 eV) are observed and labelled as and . A week shoulder is seen for the peak near 9,000 cm-1 . The peak strengths, especially the one, could be affected by the high-frequency extrapolation in the Kramers-Kronig transformation, but their shapes and positions are less affected. In fact, as shown in the inset of Fig. 2, two interband transition peaks in the measured reflectance in the above mentioned energy scales can be clearly seen.
According to the band structure calculation,Singh1 the O 2p bands are much below the Fermi level, and the transition between the O 2p bands and Co 3d bands is beyond our measurement frequencies. A most probable interband transition relevant to our observation is from the occupied Co3d t2g to the empty Co3d eg bands due to the octahedral crystal field splitting. However, the LDA result for the energy difference between the t2g and eg bands is 2.5 eV,Singh1 which lies between those two peaks. We suggest that the difference could be due to the neglect of the spin polarization effect in the simple LDA calculation. Within spin-polarized local density approximation (LSDA), Na0.5CoO2 is expected to be a ferromagnetic half metal,Singh1 and the ferromagnetic instability is robust with respect to doping.Singh2 ; Kunes It is predicted that the exchange splitting of the t2g states is about 1.5 eV for Na0.3CoO2.Kunes Experimentally, although no long range ferromagnetic ordering was observed, a Curie-Weiss-like temperature dependence of susceptibility was found for x near 0.7.Takada ; Sakurai ; Lorenz Recent neutron inelastic scattering also indicated ferromagnetic spin fluctuations within the cobalt-oxygen layers for Na0.75CoO2.Boothroyd Therefore, the exchange splittings for the spin-up and spin-down energy levels of t2g and eg are still expected to exist. This splitting will broaden the t2g and eg band widths. On one hand, it reduces the minimum excitation gap between the t2g and eg bands (leading to the peak); on the other hand, it leads to further increase of the largest energy separation between the t2g and eg bands ( transition). So, the two peaks resemble the respective transitions between spin minority and spin majority DOS as observed in ferromagnetic materials, such as CrO2.Singley ; Mazin
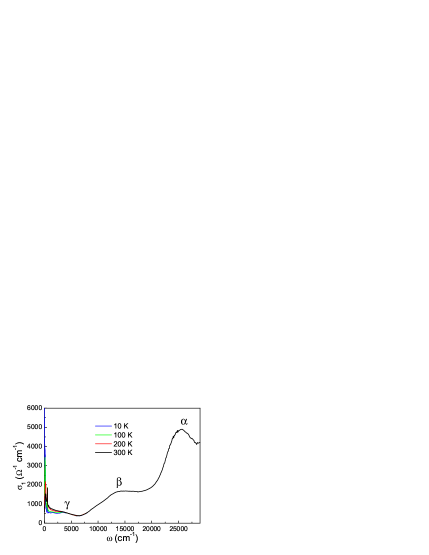
In addition to the interband transition, there is a weak absorption feature (labelled as in fig. 3) in the mid-infrared region around 3,300 cm-1 (0.4 eV). This feature is already present at room temperature, but becomes more pronounced at low temperatures. There are several possibilities for the origin of this absorption feature. A simple explanation is that the weak peak is due to the interband transition between different t2g states. The ARPES experiments along the -K direction revealed the existence of a nearly flat band at 0.16 - 0.2 eV below Fermi energy and an extended flat band just above EF. Yang However, the transition between them is unlikely to be responsible for this feature, since the excitation energy is smaller than 0.4 eV. Thus it is more likely that this weak peak is dut to a transition from occupied e bands to some partially filled ag bands within t2g manifold. An alternative explanation is that the weak mid-infrared feature is due to strong correlation effects. Recent theoretical study based on a fermion-spin theory of the t-J model on a triangular latticeLiu shows that, besides a Drude-like peak at lower frequencies, a mid-infrared peak exists in this material. In this picture, the mid-infrared peak results from the competition between the kinetic and magnetic exchange energies. It is also possible that this peak results from spin polarons induced by magnetic fluctuations.
Fig. 4 shows the conductivity spectra below 1,500 cm-1 . The low frequency conductivity increases with decreasing temperature, consistent with the metallic behavior of the dc resistivity shown in Fig. 1. The increase of the spectral weight at low frequencies comes from the region below the mid-infrared peak. At room temperature, two in-plane phonons could be seen clearly at 525 and 553 cm-1 . With decreasing temperature, they shift slightly towards higher frequencies, and two additional phonons become visible at 505 and 575 cm-1 . In NaxCoO2, Na ions have two possible sites, leading to two kinds of structural geometries.Jorgensen Symmetry analysis for each geometry reveals two infrared-active in-plane phonon modes 2E1u.Li The respective mode frequencies are somewhat different for the two geometries. The observation of two in-plane phonon modes at room temperature, which are all close to the frequency of hard E1u mode, may indicate that the two structural geometries, or both Na sites occupations, are present in the sample. The appearance of additional phonon modes might be due to a structural change with temperature. However, a complete understanding of the infrared active phonons requires further efforts.
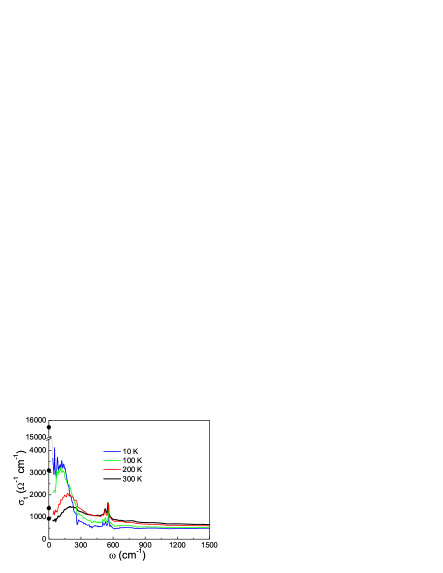
The most striking feature is that the intraband response of conducting carriers is rather different from the simple Drude behavior. The conductivity drops at very low frequencies, resulting in a low frequency peak. The peak shifts toward lower frequency with decreasing temperature. Such peak has been observed by Bernhard et al. on Na0.82CoO2 single crystals in a very recent report.Bernhard Similar finite energy peaks that shift to lower energies with decreasing T are predicted for Raman scattering in correlated systems near metal-insulator transition on the metallic side.Freericks Usually, the drop of optical conductivity at low frequency is considered as a signature of charge localization. For NaxCoO2 , however, this drop is unlikely to be due to the weak localization effect, since the dc resistivity is purely metallic and does not show any sign of localization in the whole temperature range measured.
More information about the low-frequency charge dynamics could be obtained by comparing the dc resistivity with infrared conductivity at zero frequency limit. We found that, at room temperature, the optical conductivity in the low frequency limit agrees well with the dc data within experimental errors. However, with decreasing temperature, the dc conductivity data appear to have higher values. In particular, at 10 K, the dc conductivity is as high as 15,600 , four times higher than the low-frequency optical conductivity data. This implies that there should exist a sharp increase in the optical conductivity below the frequency limit of our measurements. In this case, the conductivity drop tends to disappear due to the emergence of the new component at extremely low frequencies.
We believe that the temperature dependent behavior of the low-lying excitations observed in optical conductivity has close relationship with the quasiparticle dynamics observed in ARPES experiments. For Na0.7CoO2 single crystals, a well defined quasiparticle was observed only at low temperature where the resistivity is linear in T.Hasan The quasiparticle weight decreases to almost zero on raising temperature to above 100 K. In a study on Na0.5CoO2 crystals, Valla et al.Valla also found that the in-plane quasiparticles exist only at low temperature where the c-axis transport becomes metallic. If we compare the infrared data with ARPES results, it becomes clear that the low- drop in optical conductivity of NaxCoO2 correlates with the incoherent electronic states in which the quasiparticle picture breaks down. It also turns out that the positive slope of dc transport does not necessarily mean the existence of well-defined quasiparticles. The high temperature transport in NaxCoO2 is incoherent in nature. It is worth pointing out that the finite-energy peak has also been observed in other strongly correlated systems.Takenaka The coexistence of the ”metallic” dc resistivity with a finite-energy peak in optical conductivity and the absence of well-defined quasiparticles in ARPES is a great challenge to our understanding of the charge transport.
Our results also imply that the development of an extremely narrow and sharp Drude component at low temperature might correspond to the well-defined quasiparticles in ARPES. Note that the occurrence of a sharp and narrow resonance mode at =0 in a broad spectral background at low temperature was widely observed in strongly correlated electron systems, which was explained in terms of the renormalizaton of both the effective mass and scattering time of quasiparticles in the many-body picture.Degiorgi On this basis, this renormalized quasiparticle peak should be responsible for the moderate mass enhancement observed in the specific heat measurement for the material.Terasaki2 The very narrow Drude peak was also inferred in the very recent work by Bernhard et al.Bernhard from the ellipsometry measurement on Na0.82CoO2. From the decrease of the real part of dielectric function at very low frequency, they estimated the plasma frequency for this narrow Drude carriers of roughly 1,300 cm-1 . This value is almost 10 times smaller than that the overall plasma frequency obtained from the sum rule in the present work. Such difference also reflects the enhanced effective mass of quasiparticle at low temperature.Degiorgi
To conclude, the electronic structure and charge dynamics have been investigated for Na0.7CoO2 by means of optical spectroscopy probe. The optical conductivity spectra show two broad interband transition peaks at 1.6 eV and 3.1 eV, and a weak midinfrared peak at 0.4 eV. The former two peaks were explained as transitions between occupied t2g to empty eg bands by invoking the effect of exchange splitting. The midinfrared peak is attributed either to the interband transition within the t2g manifold or to the electronic correlation effect. The intraband response of conducting carriers is different from that of a simple Drude metal. The optical conductivity exhibits a peak at finite frequency, which shifts slightly towards higher frequencies with increasing temperature. Our analysis suggests that the peak is not due to the carrier localization but represents the incoherent electronic states where the quasiparticle picture breaks down.
We acknowledge helpful discussions with Z. Fang, S. P. Feng, J. L. Luo, Y. Wang, L. Yu, and G. M. Zhang. This work is supported by National Science Foundation of China (No. 10025418, 10374109), the Knowledge Innovation Project of Chinese Academy of Sciences. Oak Ridge National Laboratory is managed by UT-Battelle, LLC, for the U.S. Department of Energy under contract DE-AC05-00OR22725.
References
- (1) K. Takada, et al., Nature (London) 422, 53 (2003).
- (2) I. Terasaki, et al., Phys. Rev. B 56, 12685 (1997).
- (3) I. Terasaki, Physica B 328, 63 (2003).
- (4) D. J. Singh, Phys. Rev. B 61, 13397 (2000).
- (5) T. Valla et al., Nature (London) 417, 627 (2002).
- (6) M. Z. Hasan, et al., cond-mat/0308438.
- (7) H. B. Yang, et al., cond-mat/0310532.
- (8) D. J. Singh, Phys. Rev. B 68, 020503(R) (2003).
- (9) J. Kunes, K. W. Lee, and W. E. Pickett, cond-mat/0308388.
- (10) H. Sakurai, et al., cond-mat/0304503.
- (11) B. Lorenz, et al., cond-mat/0304537.
- (12) R. Jin, et al., Phys. Rev. Lett. 91, 217001 (2003).
- (13) Y. Wang, et al., Nature 423, 425 (2003).
- (14) M. L. Foo, et al, cond-mat/0312174.
- (15) C. C. Homes, et al., Appl. Opt. 32, 2973 (1993).
- (16) A. V. Puchkov, et al., J. Phys.: Condens Matter 8, 10049 (1996).
- (17) A.T. Boothroyd, et al. cond-mat/0312589
- (18) E. J. Singley, et al., Phys. Rev. B 60, 4126 (1999);
- (19) I. I. Mazin and D. J. Singh, Phys. Rev. B 59, 411 (1999);
- (20) B. Liu, et al., cond-mat/0311557.
- (21) J. D. Jorgensen, et al., cond-mat/xxx
- (22) Z. Li, J. Yang, J. G. Hou and Q. Zhu, cond-mat/0402497
- (23) C. Bernhard, et al., cond-mat/0403155
- (24) J. K. Freericks et al., Phys. Rev. B 67, 155102 (2003)
- (25) N. L. Wang et al., Phys. Rev. B 67, 134526 (2003); K. Takenaka, et al., Phys. Rev. B 68, 134501 (2003), and references therein.
- (26) L. Degiorgi, Rev. Mod. Phys. 71, 687 (1999).