An RF-Driven Josephson Bifurcation Amplifier for Quantum Measurements
Abstract
We have constructed a new type of amplifier whose primary purpose is the readout of superconducting quantum bits. It is based on the transition of an RF-driven Josephson junction between two distinct oscillation states near a dynamical bifurcation point. The main advantages of this new amplifier are speed, high-sensitivity, low back-action, and the absence of on-chip dissipation. Pulsed microwave reflection measurements on nanofabricated Al junctions show that actual devices attain the performance predicted by theory.
LABEL:FirstPage1 LABEL:LastPage#12
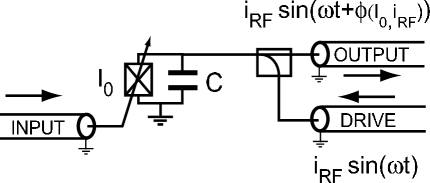
Quantum measurements of solid-state systems, such as the readout of superconducting quantum bits RFSET ; Cottet ; Boulder ; DELFT ; Buisson ; LukensSquid ; Zorin , challenge conventional low-noise amplification techniques. Ideally, the amplifier for a quantum measurement should minimally perturb the measured system while maintaining sufficient sensitivity to overcome the noise of subsequent elements in the amplification chain. Additionally, the characteristic drift of materials properties in solid-state systems necessitates a fast acquisition rate to permit measurements in rapid succession. To meet these inherently conflicting requirements, we propose to harness the sensitivity of a dynamical system - a single RF-driven Josephson tunnel junction - tuned near a bifurcation point. The superconducting tunnel junction is the only electronic dipolar circuit element whose non-linearity remains unchanged at arbitrary low temperatures. As the key component of present superconducting amplifiers SIS ; PARAMP ; SQUID , it is known to exhibit a high degree of stability. Moreover, all available degrees of freedom in the dynamical system participate in information transfer and none contribute to unnecessary dissipation resulting in excess noise. The operation of our Josephson bifurcation amplifier is represented schematically in Fig. 1. The central element is a Josephson junction whose critical current is modulated by the input signal using an application-specific coupling scheme (input port), such as a SQUID loop DELFT or a SSET Cottet . The junction is driven with an sinusoidal signal fed from a transmission line through a directional coupler (drive port). In the underdamped regime, when the drive frequency is detuned form the natural oscillation frequency and when the drive current , the system has two possible oscillation states which differ in amplitude and phase Dykman ; Siddiqi . Starting in the lower amplitude state, at the bifurcation point the system becomes infinitely sensitive, in absence of thermal and quantum fluctuations, to variations in . The energy stored in the oscillation can always be made larger than thermal fluctuations by increasing the scale of , thus preserving sensitivity at finite temperature. The reflected component of the drive signal, measured through another transmission line connected to the coupler (output port), is a convenient signature of the junction oscillation state which carries with it information about the input signal. This arrangement minimizes the back-action of the amplifier since the only fluctuations felt at its input port arise from the load impedance of the follower amplifier, which is physically separated from the junction via a transmission line of arbitrary length and can therefore be thermalized efficiently to base temperature. In this Letter, we present an experiment that demonstrates the principle of bifurcation amplification, and we show that the sensitivity obtained is in good agreement with a well-established theory of dynamical transitions, thus making it relevant for stringent tests of superconducting qubits and gates.
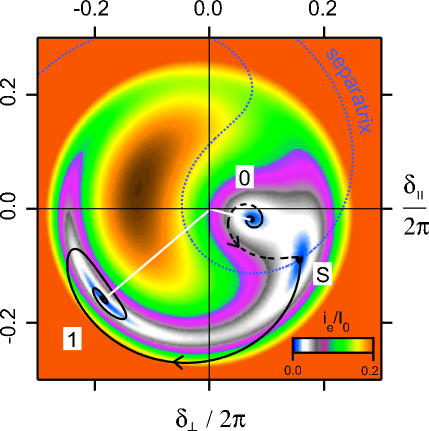
The dynamics of the junction are descibed by the time evolution of the junction gauge invariant phase difference where is the voltage across the junction. In the presence of a microwave drive , the oscillations in the junction phase can be parametrized using in-phase and quadrature phase components (higher harmonics of oscillation are negligible). When the detuning and the quality factor satisfy , then two steady state solutions can exist for . Here is the junction plasma frequency, is the capacitance shunting the Josephson element and is the characteristic impedance of the transmission line at the output port. The two oscillation states appear as two points in the plane and are denoted by vectors labelled 0 and 1 (see Fig. 2). The error-current Kautz which describes the generalized force felt by the system is also plotted in plane. Its value goes to zero at the attractors corresponding to states 0 and 1 and also at a third extremum which is the dynamical saddle point. Also shown in Fig. 2 are the calculated escape trajectory Dykmanescape from state 0 (dashed) and the corresponding retrappping trajectory Dmitriev into state 1 (solid line). Fig. 2 has been calculated for , and , where . These values correspond to typical operating conditions in our experiment. The dynamical switching from state 0 to 1 is characterized by a phase shift given here by . Using the junction phase-voltage relationship and the transmission line equations, we can calculate the steady-state magnitude and phase of the reflected microwave drive signal. The change in the oscillation of results in a shift of the reflected signal phase . Since there is no source of dissipation in the junction chip, there should be no change in the magnitude of the reflected signal power, even though .
Our main sample consisted of a single shadow-mask evaporated Al/Al203/Al tunnel junction with , shunted with an on-chip lithographic capacitance Siddiqi to obtain a reduced plasma frequency . The dynamics of the transition between the two oscillation states were probed using microwave pulses, generated by the amplitude modulation of a CW source with a phase-locked arbitrary waveform generator with resolution. The reflected signal was passed through an isolator at base temperature to a matched HEMT amplifier at in the spirit of Day et al. Zmuidzinas . At room temperature, the reflected signal was further amplified, mixed down to and finally digitally demodulated using a digitizer to extract the signal phase .
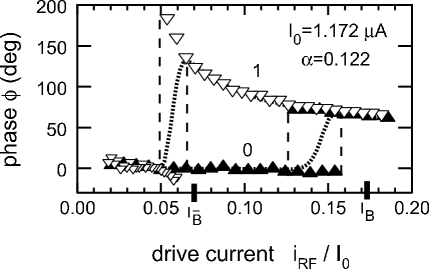
We first probed the drive current dependence of the reflected signal phase by applying a long symmetric triangular shaped pulse with a peak value . The demodulated reflected signal was divided into sections, each yielding one measurement of for a corresponding value of . The measurement was repeated times to obtain a distribution of . In Fig. 3, the mode of the distribution is plotted as a function of . For , the bifurcation amplifier is always in state 0, is constant and assigned a value of . As the drive current is increased above , thermal fluctuations are sufficiently large to cause transitions to the 1 state. In the region between the two dashed lines at and , displays a bimodal distribution with peaks centered at and with the latter corresponding to the amplifier in the 1 state, as we have demonstrated previously Siddiqi . The dotted line in Fig. 3 is the average reflected signal phase . When is increased above , the system is only found in state 1. In the decreasing part of the ramp, the system does not start to switch back to state 0 until . The critical switching currents for the transition and for the transition, calculated from numerical simulations to treat the inductance of wire bonds, are denoted with ticks in Fig. 3, and are in good agreement with experiment. The hysteresis is a consequence of the asymmetry in the escape barrier height for the two states. Thus, the transition at is nearly irreversible, allowing the bifurcation amplifier to latch and store its output during the integration time set by the sensitivity of the follower amplifier.
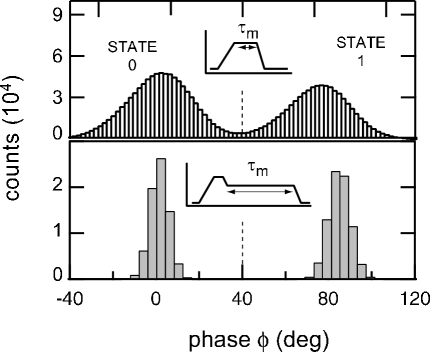
To determine the sensitivity of the bifurcation amplifier, we have characterized in detail the switching in the vicinity of the transition. We excited the system with two different readout pulse protocols. In the first protocol, the drive current was ramped from 0 to its maximum value in and was then held constant for before returning to 0. Only the final of the constant drive period were used to determine the oscillation phase with the first allotted for settling of the phase. Histograms taken with a acquisition rate are shown in Fig. 4. In the upper panel, the two peaks corresponding to states 0 and 1 can easily be resolved with a small relative overlap of . The width of each peak is consistent with the noise temperature of our HEMT amplifier. In this first method, the latching property of the system has not been exploited. In our second protocol for the readout pulse, we again ramp for and allow a settling time of , but we then reduce the drive current by and measure the reflected signal for . In that latter period, whatever state was reached at the end of the initial period is ”latched” and time is spent just increasing the signal/noise ratio of the reflected phase measurement. As shown in the lower panel of Fig. 4, the two peaks are now fully separated, with a relative overlap of allowing a determination of the state 1 probability with an accuracy better than . This second protocol would be preferred only for very precise time-resolved measurements of or for applications where a low-noise follower amplifier is impractical.
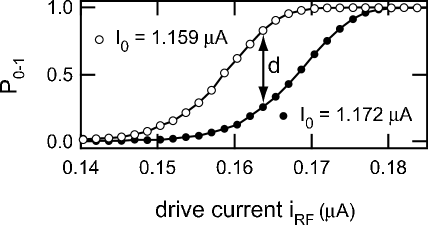
A third experiment was performed to study the state 1 switching probability for different values of the temperature and , the latter being varied with a magnetic field applied parallel to the junction plane. Using the first readout protocol and the discrimination threshold shown in Fig. 4, we obtain the switching probablity curves shown in Fig. 5. Defining the discrimination power as the maximum difference between two switching probability curves which differ in we find that at , for – the typical variation observed in a superconducting charge-phase qubit Vion . The switching probability curves should shift according to , which for our case takes the value 5.6. In Fig. 5, the curves are shifted by , which agrees well with this prediction. For the case of the DC current biased junction, similar curves would shift only by since the switching current is itself. Comparable discrimination power using DC switching has only been achieved in these devices at As the temperature is increased, the switching probabilility curves broaden due to increased thermal fluctations and the disciminating power decreases: at , .
We finally determined the escape rate as a function of by measuring the time dependence of the switching probability, using a method previously applied to the determination of the static switching rates to the voltage state Turlot . Here is the attempt frequency and the barrier height can be approximated as where . After the initial ramp () and settling period (), the reflected signal phase was extracted every for a duration of . By repeating this measurement, we generated switching probability histograms which we analyzed as . In parallel with these dynamical switching measurements, we have run static switching measurements with the same analysis, yielding the escape temperature . We have found that exceeded by 60mK, an effect we do not fully understand yet but which might be attributed to a combination of insufficient filtering in our RF amplifier line outside the measurement band and to high-frequency non-equilibrium vortex motion in the superconducting films of our device. Analyzing the dynamical switching data with in place of , we extract a value of from the data with while the calculated value keeping higher order terms in is .
With the Josephson bifurcation amplifier operating at , it is possible to resolve with a signal/noise ratio of 1 a variation in in a total time , corresponding to a critical current sensitivity of . This value is in agreement with the approximate prediction . This formula shows that the sensitivity is independent of , in contrast with the sensitivity obtained in the linear regime Delft2 . Operating the junction near a bifurcation point has the advantage that the sensitivity is limited only by temperature and not by the measurement bandwidth. The advantage of the bifurcation amplifier over SQUIDs Clarke resides in its extremely low back-action. Since there is no on-chip dissipation, the only source of back-action is the junction phase fluctuations induced by our matched isolator load at . Both numerical simulations and analytical calculations predict a spectral density . In our system, the generalized back-action force is and we calculate a noise temperature , considerably lower than that of resistively shunted SQUIDs where at comparable temperatures Urbina . Finally the bifurcation amplifier does not suffer from quasiparticle generation associated with hysteretic SQUIDS DELFT and DC current-biased junctions Cottet which switch into the voltage state. Long quasiparticle recombination times at low temperatures limit the acquisition rate of these devices while the recombination process itself produces excess noise for adjacent circuitry Lukens .
In conclusion, the Josephson bifurcation amplifier is competitive with the SQUID for applications where low noise temperature is required. Its speed, suppression of on-chip dissipation, and latching make it ideal for the readout of superconducting qubits. At temperatures such that , the discrimination power would be greater than 95%, hence permitting stringent tests of Quantum Mechanics, like the violation of Bell’s inequalities.
We would like to thank D. Prober, E. Boaknin, L. Grober, D. Esteve, D. Vion, S. Girvin and R. Schoelkopf for discussions and assistance. This work was supported by the ARDA (ARO Grant DAAD19-02-1-0044) and the NSF (Grant DMR-0072022).
References
- (1) A. Aassime, G. Johansson, G. Wendin, R.J. Schoelkopf, and P. Delsing, Phys. Rev. Lett. 86, 3376 (2001).
- (2) A. Cottet, D. Vion, A. Aassime, P. Joyez, D. Esteve, and M.H. Devoret, Physica C 367, 197 (2002).
- (3) J.M. Martinis, S. Nam, J. Aumentado, and C. Urbina, Phys. Rev. Lett. 89, 117901 (2002).
- (4) I. Chiorescu, Y. Nakamura, C.J.P.M. Harmans, and J.E. Mooij, Science 299, 5614 (2003).
- (5) O. Buisson, F. Balestro, J. P. Pekola, and F. W. J. Hekking, Phys. Rev. Lett 90, 238304 (2003).
- (6) T.V. Filippov, S.K. Tolpygo, J. Mannik, and J.E. Lukens, IEEE Trans. Appl. Supercond. 13, 1005 (2003).
- (7) A. B. Zorin, arXiv:cond-mat/0312225 v1 9 Dec 2003.
- (8) R. Tucker and M.J. Feldman, Rev.Mod. Phys. 57, 1055 (1985).
- (9) B. Yurke, L.R. Corruccini, P.G. Kaminsky, L.W. Rupp, A.D. Smith, A.H. Silver, R.W. Simon, and E.A. Whittaker, Phys. Rev. A 39, 2519 (1989).
- (10) S.T. Ruggiero and D.A. Rudman (eds.), Chap 2. by J. Clarke ”SQUIDS: Principles. Noise, and Applications”, Superconducting Samples, Academic Press, San Diego (1990).
- (11) M.I. Dykman and M.A. Krivoglaz, Physica A 104, 480 (1980).
- (12) I. Siddiqi, R. Vijay, F. Pierre, C.M. Wilson, L. Frunzio, M. Metcalfe, C. Rigetti, R.J. Schoelkopf, M.H. Devoret, D. Vion, and D.E. Esteve, arXiv:cond-mat/0312553 v1 21 Dec 2003.
- (13) R.L. Kautz, Phys. Rev. A 38, 2066 (1988).
- (14) M.I. Dykman and M.A. Krivoglaz, JETP 50, 30 (1980).
- (15) A.P. Dmitriev, M.I. D’yakonov, and A.F. Ioffe, JETP 63, 838 (1986).
- (16) P.K. Day, H.G. LeDuc, B.A. Mazin, A. Vayonakis, J. Zmuidzinas, Nature 425, 817 (2003).
- (17) D. Vion, A. Aassime, A. Cottet, P. Joyez, H. Pothier, C. Urbina, D. Esteve, and M. Devoret, Science 296, 886 (2002).
- (18) C. Urbina, D. Esteve, J.M. Martinis, E. Turlot, M.H. Devoret, H. Grabert, and S. Linkwitz, Physica B 169, 26 (1991).
- (19) A. Lupa scu, C. J. M. Verwijs, R. N. Schouten, C. J. P. M. Harmans, and J. E. Mooij, arXiv:cond-mat/0311510 v1 21 Nov 2003.
- (20) M. Mück, J.B. Kycia, and J. Clarke, Appl. Phys. Lett.78, 967 (2001).
- (21) F.C. Wellstood, C. Urbina, and J. Clarke, Appl. Phys. Lett. 54, 2599 (1989).
- (22) J. Mannik and J.E. Lukens, arXiv:cond-mat/0305190 v2 6 Nov 2003.