Influence of carbon doping in the vortex matter properties of MgB2
Abstract
We have studied the vortex-matter phase diagram of low C doped MgB2 superconductor. The significant finding is the appearance of a peak effect, which, as both our global magnetization and local ac susceptibility measurements revealed, is placed well below the -line. The absence of significant bulk pinning below the onset line of the peak effect implies that the Bragg glass phase is present for . Interestingly, the unexpected absence of bulk pinning above the end point line of the peak effect implies the presence of a slightly pinned vortex phase in the regime . In addition, the observed increase of the since the carbon doped MgB2 becomes more dirty and the reduced anisotropy, in comparison to the pure MgB2, makes the C-doped MgB2 more favorable for practical applications.
pacs:
74.25.Dw, 74.25.Ha,74.25.Op,74.62.BfIn spite of the rich physics of recently discovered MgB2 nagamatsu01 , due to the multi component order parameter twogap , the potential of MgB2 for applications is limited by comparatively low upper-critical fields kOe pissas02 . Atomic substitutions may influence the basic properties of a superconductor making it appropriate for practical applications, by increasing the line and/or the critical current that can sustain without losses. On the other hand, atomic substitutions may help in the clarification of a number of issues related with the basic mechanism which is responsible for the superconductivity in the particular compound. It has been theoretically proposed that the line can be increased by adding nonmagnetic impurities gurevich03 . The MgB2 crystal structure consists of alternating close packed Mg+2 layers and honeycomb-like boron sheets. was found to gradually decrease upon substitution of Mg for Al and B for C, consistent with a decrease in the density-of-states at the Fermi level induced by electron doping and reduced lattice volume. Although both Al and C reduce the , the filling of the -band may reduce the anisotropy of the pristine MgB2,anisotropy helping this way the tuning of the basic properties of MgB2.
Single crystals were grown by a high-pressure technique lee03 previously developed for the growth of pristine MgB2 phase lee01 using precursors with a nominal composition of Mg(B1-xCx)2 . The residual resistivity ratio at , of crystals from the same batch, as used in the present work is while the residual resistivity increases by a factor of 3-4 in comparison to the pristine MgB2, indicating a degreasing of the mean free path by a factor of 3-4.
Local ac susceptibility measurements were carried out on a MgB1.96C0.04 single crystal by means of a GaAsIn Hall chip (active area of m2). The dimensions of the crystal are m3 with the shorter length along the -axis. The crystals have of 35.6 K at zero dc field ( Oe) and a transition width of 0.3 K (10%-90% criterion). In order the small ac field to be measured, under the presence of a large dc magnetic field, a second sensor of the same size was connected opposite to the first one by means of an ac bridge. The real and imaginary parts () of the modulated Hall voltage, which is proportional to the local magnetic moment () at the surface of the crystal, were measured by means of two lockin amplifiers. DC magnetization measurements were performed (SQUID) magnetometer.
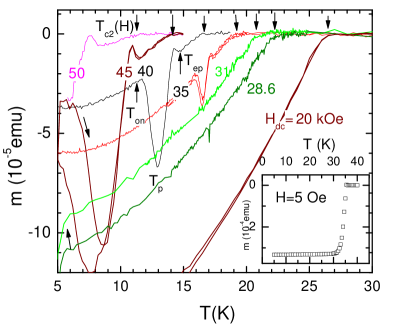
Figure 1 shows the temperature variation of the bulk magnetic moment of the MgB1.96C0.04 for several magnetic fields () as it was measured by the SQUID magnetometer. For small fields (1-32 kOe) the curves doesn’t show any special feature and are terminated at the axis in a parallel fashion. The diamagnetic onset temperature is identified with that is determined by extrapolating the low temperature curve to . As one can see the irreversibility is negligible, and only when the temperature is reduced enough, irreversible behavior is appeared. Measurements in higher fields ( kOe) clearly show a negative peak whose its height and width increase as the magnetic field increases. We define the temperatures where the peak effect starts as , takes its minimum value as and finally ends as . It is interesting to note that in the interval , the magnetization is nearly reversible (see the curve measured at kOe) while for the magnetic moment presents hysteretic behavior which increases as the magnetic field increases.
For a type-II superconductor, near line is expected that the magnetization varies as abrikosov , where is determined by the geometrical arrangement of fluxoids in the mixed state and is the second Ginzburg-Landau-Maki parametermaki . The isofield slope, near is determined by two factors: . Since one can ignore the second term, consequently, the slope of the magnetization curves near is mainly determined from the line slope. The observed reduction of the magnetization slope as the field increases means that the line goes to with decreasing slope.

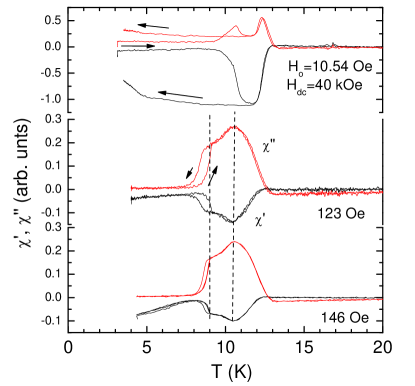
Fig. 2 shows the real and imaginary parts of the local fundamental ac-susceptibility (, ), as function of temperature, measured under several dc magnetic fields kOe for an ac-field Oe. The measurements have been taken during cooling and heating. As the measurements are made in higher magnetic fields both and form a peak. Moreover, the location of the peak temperature and the end point do not depend on the amplitude of the ac-field. Our local Hall measurements enabled us to detect the peak effect in much lower fields than the global SQUID measurements. In addition, below a characteristic point (24.5 K, 20 kOe) the peak effect could not be observed. Below this characteristic point the peak effect turned into a sharp drop which we define it by its onset and its end point . This feature also could not be observed below a second characteristic point (26 K,12 kOe) (see Fig. 4 below).
Comparing the temperature where the diamagnetic signal appears in our local ac susceptibility measurements to the corresponding bulk dc measurements we find out that this doesn’t correspond to the . Here, we would like to emphasize that for the case of a type-II superconductor in the mixed state with negligible pinning, as the line is approached one expects that the local ac-susceptibility is mainly in-phase to the ac field (for sufficiently low frequencies) and positive (paramagnetic) . We did not observe paramagnetic ac moment for probably due to the fact that, either the paramagnetic moment is below our sensitivity limit, or we have a superposition of a paramagnetic and a diamagnetic ac moment (due to a small critical current) of equal size giving a zero net ac-moment.
As we presented in Fig. 2 pronounced hysteretic behavior of the local ac susceptibility is observed in the regime below the peak points, when high dc magnetic fields are applied (e.g kOe). The appearance of hysteresis in non-equilibrium states may be indicative of a first-order phase transition but doesn’t necessarily provide a conclusive evidence. However, while the exact mechanism of the peak effect is not fully understood, recent experiments on Nbling01 , Bi2Sr2CaCu2O8+δ,Avraham HgBa2CuO4,Stamopoulos02A ; Stamopoulos02B , NbSe2 Marchevsky and (K,Ba)BiO3, klein01 have correlated the onset of the peak effect with a first-order order-disorder transition of the vortex lattice. A high enough driving force exerted on vortices may uncover different behavior than the one observed in a low applied perturbation. We systematically investigated the influence of the amplitude of the applied ac field on the hysteretic response. In Fig. 3 we present the temperature variation of the real and imaginary part of local ac-susceptibility under 40 kOe dc-magnetic field, for appreciate large amplitudes of the ac-field. We see that the detected hysteresis progressively reduces as we apply higher ac fields. For high enough ac fields the hysteresis is confined only in the regime between the onset of the peak and a new characteristic point, at which the in-phase signal presents a kink. These results may be explained as following: The fact that the zero field cooled vortex state exhibits zero screening current in the regime suggests that no metastable states are present in this regime and that the so-called Bragg glass state bragg is a true equilibrium phase. Furthermore, we performed relaxation and partial loop measurements in the regime between the onset point and the peak effect. Those measurements, which will be presented elsewherePissasC , revealed that partial sub-loops are always present and that the field cooled vortex state exhibits strong relaxation, while the zero field cooled one doesn’t relax even in long experimental times. These results indicate that the zero field cooled vortex state is an equilibrium state while the field cooled phase is a supercooled metastable one. In addition, these two vicinal vortex states (namely the disordered and the Bragg glass) coexist in the finite temperature interval around the transition regime. All the above mentioned results indicate that the detected transition is of first order. Recently, the same behavior was detected in YBa2Cu3O7,Zhukov Bi2Sr2CaCu2O8+δ Beek00 ; Avraham , HgBa2CuO4+δ Stamopoulos02A ; Stamopoulos02B , NbSe2 Marchevsky and V3Si,gapud03 single crystals.
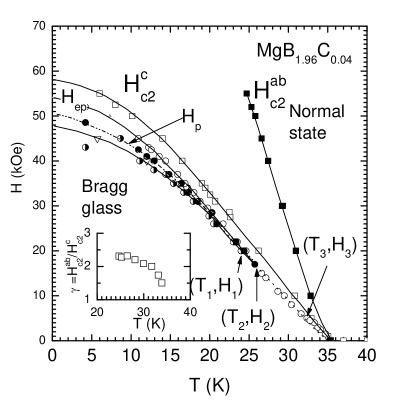
Figure 4 summarizes our results in the form of phase diagram of the mixed state of MgB1.96C0.04. A similar phase-diagram has been also determined for the sample. The main differences with sample are the larger characteristic fields , , and . Remarkably, the ( kOe) field does not change between the pristine and carbon doped crystals. For completeness the -line was added, permitting the estimation of the anisotropy which is depicted in the inset. This part of the anisotropy curve is well below the corresponding curves reported in the literatureanisotropy for the pristine MgB2c-anisotropy . In the results presented in Fig. 4 there is a remarkable experimental finding. The end point line as defined from the end point of the peak effect doesn’t coincide to the upper-critical field line as that defined from the bulk magnetization measurements. In addition, the portion of the mixed state occupied by the peak effect shrinks and the magnitude of the critical current is reduced as the field decreases. The peak effect disappears at and is transformed to a very narrow diamagnetic step, up to the point . As the field is further reduced, the local shows a monotonic conventional behavior. However, the line defined by the diamagnetic onset points of the curves is also placed below the line and only at a particular point changes slope and coincides to the line. Based on our results and with what already is known in other compounds the onset peak-effect line concerns an order-disorder transition, most probably of first-orderAvraham ; Marchevsky , so the is a tricritical point where a first order transition is terminated. One could claim that point is a critical point. However a critical point can exist only for phases such that the difference between them is purely quantitative. Therefore, these vortex solid phases cannot be continuously transformed into each other and a termination of the phase transition line, separating these phases, can terminate only on another phase transition linemikitik01 ; giamarchi95 . This fact may not be valid in our case, since the Bragg glass phase is also qualitatively different from the phase that occupies the region between the and the end-point line. This region of the phase diagram may be related with a amorphous vortex phase. We would like to stress that in this regime the critical current is very low (normally one expects that the critical current reduces smoothly towards the zero values at ) and is an important new experimental finding which needs a theoretical explanation. A critical point therefore cannot exist for such phases, and the equilibrium curve must either go to or terminate by intersecting the equilibrium curves of other phases. Consequently, the onset line below may concern a curve of second-order phase transitions in the plane that separates phases of different symmetry, namely a transition line from a Bragg glass to an amorphous vortex phase. Alternatively, if one supposes that the diamagnetic onset of the local susceptibility (for , see Fig. 4) does not represent a phase transition but simply marks an irreversibility line, then the point is a critical point with the consequence of a reentrance of the Bragg glass phase below the point in the regime . At the end, we would like to comment on the presence of the characteristic point (33 K, 5 kOe). As we observe in Fig. 4 for magnetic fields below the onset of the diamagnetic local ac response coincides to the onset of the diamagnetic global dc magnetic moment. Although tunnelling data are not available at the presence, we know that in pristine MgB2 near the gap closes at about 4-5 kOe. Therefore, it is interesting to correlate this point with the closing of the gap.
In summary, we experimentally estimated the vortex matter phase diagram for MgB1.96C0.04 single crystal superconductor which exhibits half the anisotropy of the pristine MgB2 one. The peak effect is observed in our local Hall and in bulk SQUID measurements. The respective line and even the end point line are placed well below the upper-critical field line . The line doesn’t terminate on the line but disappeared at . The peak effect line concerns an order-disorder transition of first-order. This line probably is terminated at the tricritical point continuing as a line of second order transitions up to . The is obviously increased in the C doped MgB2 crystal, implying a decreased mean free path of the charge carrier.
Acknowledgements.
This work was partially supported by the New Energy and Industrial Technology Development Organization (NEDO) as collaborative research and development of fundamental technologies for superconductivity applications.References
- (1) J. Nagamatsu et al., Nature(London) 410, 63 (2001).
- (2) Y. Wang, T. Plackowski and A. Junod, Physica (Amsterdam) 355C, 179 (2001); P. Szabó, et al., Phys. Rev. Lett. 87, 137005 (2001); X. K. Chen, et al., Phys. Rev. Lett. 87, 157002 (2001); F. Giubileo, et al., Phys. Rev. Lett. 87, 177008 (2001);M. R. Eskildsen, et al., Phys. Rev. Lett. 89, 187003 (2002); F. Bouquet, et al., Phys. Rev. Lett. 89, 257001 (2002).
- (3) M. Pissas, S. Lee, A. Yamamoto and S. Tajima, Phys. Rev. Lett. 89, 097002 (2002).
- (4) A. Gurevich, Phys. Rev. B 67, 184515 (2003).
- (5) M. Pissas, et al., Phys. Rev. B65, 184514 (2002);
- (6) S. Lee, T. Masui, A. Yamamoto, H. Uchiyama, and S. Tajima, Physica C 397,7 (2003).
- (7) S. Lee et al., J. Phys. Soc. Jpn. 70, 2255 (2001).
- (8) A. A. Abrikosov,Zh. Eksperim. i Teor. Fiz. 3̱2, 1442 91957)[English transl.:Soviet Phys.-JETP 5, 1174 (1957)].
- (9) K. Maki, Physics 1, 21 (1964).
- (10) X. S. Ling et al. Phys. Rev. Lett. 86, 712 (2001).
- (11) N. Avraham et al., Nature (London) 411, 451 (2001).
- (12) D. Stamopoulos and M. Pissas, Phys. Rev. B 65, 134524 (2002).
- (13) D. Stamopoulos, M. Pissas, and A. Bondarenko Phys. Rev. B66, 214521 (2002).
- (14) M. Marchevsky, M.J. Higgins, and S. Bhattacharya, Nature (London),409, 591 (2001).
- (15) T. Klein et al., Nature (London) 413, 404 (2001)
- (16) T. Giamarchi, and P. Le Doussal, Phys. Rev. B 55, 6577 (1997); D. Ertas, and D. R. Nelson, Physica C 272, 79 (1996).
- (17) M. Pissas, D. Stamopoulos, S. Lee and S. Tajima, unpublished results.
- (18) A.A. Zhukov et al., Phys. Rev. B61, 886 (2000), A.A. Zhukov et al., Phys. Rev. Lett. 87, 17006 (2001).
- (19) C.J.van der Beek et al., Phys. Rev. Lett. bf 84, 4196 (2000).
- (20) A. A. Gapud et al. Phys. Rev. B67, 104516 (2003).
- (21) Lowering of the anisotropy upon carbon doping has been reported by T. Masui, S. Lee and S. Tajima, (preprint and personal communication) from the same batch of crystals used in the present study. Lowering of the anisotropy has been also reported by R. Ribeiro et al. Physica C 384, 227 (2003) using a polycristalline sample with nominal composition MgB1.6C0.4.
- (22) G. P. Mikitik, and E. H. Brandt, Phys. Rev. B 64, 184514 (2001).
- (23) T. Giamarchi, and P. Le Doussal, Phys. Rev. B 52, 1242 (1995).