D.-S. Lee, K.-I. Goh, B. Kahng, and D. Kim
School of Physics and Center for Theoretical Physics,
Seoul National University, Seoul 151-747, Korea
Abstract
We study the evolution of random graphs where edges are added one by one
between pairs of weighted vertices
so that resulting graphs are scale-free with the degree exponent .
We use the branching process approach to
obtain scaling forms for the cluster size distribution and the
largest cluster size as functions of the number of edges and
vertices . We find that the process of forming a spanning cluster is
qualitatively different between the cases of and .
While for the former, a spanning cluster forms abruptly at a
critical number of edges , generating a single
peak in the mean cluster size as a function
of , for the latter, however, the formation of a spanning cluster
occurs in a broad range of , generating double peaks in
.
pacs:
89.70.+c, 89.75.-k, 05.70.Jk
Recently, many studies have been performed on
complex networks. Such studies are mostly influenced by the random
graph theory proposed by Erdős and Rényi (ER) er61 . In
the ER model, number of vertices are present from the
beginning and edges are added one by one in the system, connecting
pairs of vertices selected randomly.
A remarkable result ER obtained is that
a giant cluster of size , a spanning cluster,
appears abruptly when reaches its threshold
value , which is .
Note that the formation of such a spanning cluster can be viewed as a
percolation transition occurring at the
critical probability .
While the ER graph is pioneering, it is too random, and various properties
of the ER graph are not in accordance with those of complex
networks recently discovered in real world. For example, the
distribution of the number of edges incident on each vertex,
called the degree distribution, is Poissonian for the ER graph,
while it follows a power law for many real-world networks,
called scale-free (SF) networks ba99 ; mendes02 ; newman03 .
It was shown that a SF network can be generated by following a
similar way to used in the ER model goh01 ; caldarelli02 .
number of vertices are
present from the beginning and edges are added one by one. For
SF networks, however, each vertex with the index of an integer
() is not identical, but is assigned a normalized
weight with a control parameter
. Each edge connects a pair of vertices
selected with probability . Thus the ER graph is
generated with . The process of adding edges is
repeated until the total number of edges in the system reaches
.
This process of constructing networks is called the static model.
When is in the intermediate regime
,
with being specified below,
the degree distribution follows a
power law, with .
However, when (),
the network is too sparse (dense), so that the degree distribution
does not follow the SF behavior.
The static model was introduced to generate SF networks with
various , being used to study various problems.
However, it has not been studied yet how clusters
evolve as the number of edges increases, which is
the goal of this Letter.
The percolation problem of SF networks has been
studied albert00 ; cohen00 ; callaway00 ; cohen02 ,
reversely, that is, by removing randomly-selected vertices as well
as their attached edges.
In this Letter, we study how the cluster evolution of SF graphs
proceeds as edges are added. Besides confirming the previous
results in Ref. cohen00 ; cohen02 ,
we show that the process of forming a spanning cluster for the
case of is fundamentally different from that of .
When , as in the case of the ER graph, there exists a critical
number of edges at which a spanning cluster forms through many
small clusters coalescing, and the mean cluster size diverges at finite
in the thermodynamic limit.
In other words, a percolation transition occurs at .
When , however, large or small clusters grow in a similar
manner as a whole without sudden coalescence occurring.
As a result, the mean cluster size does not diverge anywhere, but instead
exhibits two peaks at and . Near , some small
clusters merge together forming a much larger one, but it does not span
the entire system. After passing , the largest cluster as well as
smaller ones continue to grow, and the largest one becomes
as large as around . Throughout this Letter,
we will denote the case of as (I), as (II),
and as (III). The schematic diagram of the
cluster formation is shown in Fig. 1.
We obtain characteristic numbers of edges for each case as
a function of and summarize them in the phase diagram
shown in Fig. 2. Moreover, we derive scaling forms for
the cluster size distribution and the largest cluster size
analytically and numerically.
Power-law degree distribution — The probability that a
vertex has degree follows approximately a Poissonian form as
for large and large .
Here the average degree of the vertex is given by
, where
,
with .
Note that converges to the Riemann zeta function
for but scales as for .
When is small enough, most vertices
have no edge.
When , that is,
,
the SF behavior in the degree distribution begins to appear.
When , the degree
distribution is derived as
(1)
where is given as .
Figure 1: Schematic picture for the comparison of cluster evolution
between (I,II) (a) and (III) (b).Figure 2: Schematic phase diagram of the static model. The
SF behavior of the degree distribution appears between
and . A spanning cluster emerges at for
(I,II), and around for (III).
The quantities in […] are only for (III).
Branching process approach — As increases beyond ,
small clusters form.
However, clusters are still sparse and
of tree structure er61 .
The formation of such sparse clusters
can be understood through the
multiplicative branching process approach harris89 .
Here we introduce the probability distribution as
the number of vertices
belonging to -clusters, clusters with vertices,
divided by aharony92 .
Also we define another probability distribution as
the number of edges followed by
-clusters divided by .
The generating functions of those quantities
are defined as and , respectively.
Both summations run over finite
clusters only harris89 , and then when clusters are sparse
the following relations hold:
(2)
where and
with
.
To apply Eq. (2) to the static model, we
use the following form valid in the limit ;
.
Then it is obtained that
for , where , a negative constant,
and so on,
while
(3)
for ,
where is the floor
function of and .
The generating function can be obtained by
inverting , and is then obtained
by using .
Critical point — The values of and
are only when , while they are smaller than
when . Thus the condition , which is the same as
the condition molloy95 ,
leads to a characteristic number of edges ,
(4)
For large , is
for (I,II),
and for (III).
We will show later that for (I,II), a spanning cluster appears at ,
but for (III), the size of the largest cluster does not reach
at . Thus more edges are needed to generate
a spanning cluster.
Cluster size distribution — The asymptotic behaviors of
and for large can be obtained from the singular parts of
and as ,
respectively. In the static model,
the characteristic behaviors of and
depend on the degree exponent , classifying them into the three cases,
(I), (II), and (III).
Each case is again
classified into (i) subcritical (), (ii)
critical (), and (iii) supercritical cases (). Our results for are listed in Table I for each case.
Table 1:
Cluster size distribution .
Here , and
the scaling exponents are given as
for (I) and
for (II).
(i)
(ii)
(iii)
(I,II)
(III)
Emergence of spanning cluster —
In cases of (i) and (ii),
the size of the
largest cluster is obtained self-consistently through the relation,
using in Table 1.
For example, when
, is obtained to be .
Thus when (ii),
for (I) er61 and for (II) cohen_book .
For (III),
using , we obtain
, but
we show below that this is not the incipient
spanning cluster.
The size of the largest cluster for the subcritical case (i)
is
for (I),
for (II),
and for (III),
with .
In case of (iii), the theory of the multiplicative branching
process yields the size of
an infinite cluster
through .
Thus it can be identified
with the largest cluster if it is
larger than at .
From Eq. (2),
,
and the value of is obtained
by solving Eq. (3) with .
Thus we obtain, with for (I) and
for (II) in the regime of ,
while
for (III) when ,
where a new scaling exponent for (I) and
for (II) was used. The behaviors of (i), (ii), and (iii) lead
to a scaling ansatz for (I,II),
(5)
where is given in Table 1, and
is constant for and behaves as
for and for with
for (I) and for (II).
In the thermodynamic limit, a spanning cluster
emerges if only . On the other hand, for (III),
(6)
where is a constant for , behaving as
when and for .
The size of the largest cluster is ,
which is not as large as , even when , so that
is not
a percolation threshold.
The largest cluster size becomes only when
becomes as large as .
To check such scaling behaviors
of , we perform numerical simulations
for and .
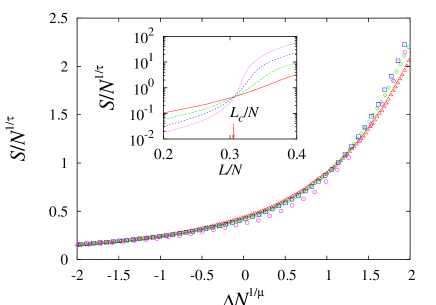
As shown in Figs. 3 and 4,
the data of
with different
collapse
with the scaling variables,
for (II),
and for (III), respectively.
For ,
theoretically obtained in Eq. (4)
is confirmed by the data crossing at .
Figure 3: Data collapse of
versus for
Eq. (5)
with ,
and , , , and
.
Here , ,
and
from Eq. (4) are used.
Inset: the same data plotted versus cross at .
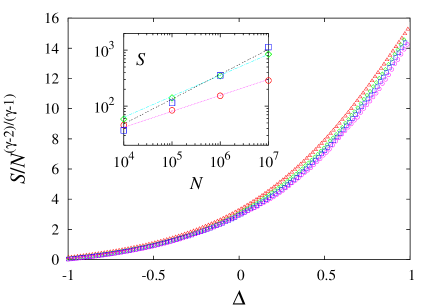
Figure 4: Data collapse of versus
for Eq. (6)
with and
, , , and
. Here from
Eq. (4) is used.
Inset: plot of at versus for
, , and , being
in accordance with
represented by the
dotted, dashed-dotted, and dashed line, respectively.
Mean cluster size — The difference in the cluster
evolution for (I), (II), and (III) appears more apparently
in the mean cluster size defined as
The quantity is similar to the susceptibility defined in
the percolation theory but here we exclude the largest cluster
even for . For (I,II), as increases, many small
clusters grow by attaching edges, which continues up to ,
and then a spanning
cluster forms by the abrupt coalescence of those small clusters
as shown in Fig. 1.
Since we do not count the spanning cluster in calculating , decreases rapidly as passes . Thus the
mean cluster size exhibits a peak at , which diverges in
the thermodynamic limit .
The scaling behaviors of and in
Table 1 lead to another scaling ansatz
(7)
where is a constant when , and behaves as
when , and for (I) and
for (II) when .
Such behaviors can be confirmed with numerical data for
in
Fig. 5.
For (III), however, the mean cluster size does not diverge at any
value of but has two blunt peaks (Fig. 6).
First, it has a small peak
at ,
but it increases again as
increases beyond . Edges newly introduced either create new
clusters of size larger than or merge small clusters
to the larger one with size not as large as .
When reaches where
the second peak arises,
the largest cluster becomes as large as .
When is near ,
can be evaluated through
,
and it follows that
, where is a characteristic cluster size
defined in Table 1, and
the constant term originates from
the isolated vertices whose fraction is nearly .
Since () increases (decreases)
with increasing for , is maximal
at , occurring
at with
being a constant depending on .
That is verified numerically as shown in the inset of
Fig. 6. For ,
using ,
we obtain to be
(8)
where
and
It exhibits a peak at for ,
close to the location obtained by numerical simulations
(Fig. 6).
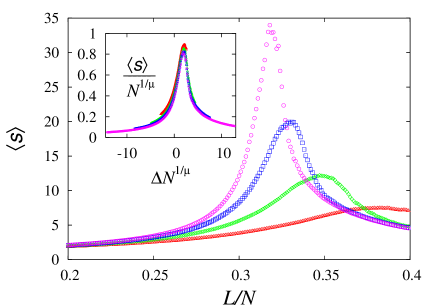
Figure 5: Mean cluster size as a function of
with
for , , , and
.
The peak heights increase with .
The inset shows the data collapse of
the rescaled mean cluster size
versus
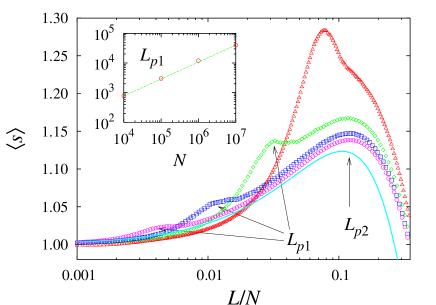
.Figure 6: Mean cluster size
as a function of in semi-logarithmic scales
with
for , , , and
.
In addition to the peak at ,
another peak is shown at for , , and
, respectively.
The measured values of ()
as a function of are plotted in the inset
together with the guide line whose slope is
for comparison.
The solid line represents Eq. (8).
Dense graph — The power-law degree distribution in
Eq. (1)
lasts up to ,
around which the vertex is connected to nearly all vertices
() and
the degree distribution begins to develop a peak at .
As increases beyond ,
more vertices have such maximal number of edges,
and the graph becomes denser.
Summary —
We have studied how clusters of SF graphs are created and evolve as the
number of edges increases.
We obtained the cluster size distribution, the largest cluster size,
and the mean cluster size as functions of the numbers of edges and
vertices . Those quantities behave differently
when and . For the former, a giant spanning
cluster forms through a sudden coalescence of small clusters,
exhibiting a percolation transition, while for the latter, it does gradually,
and the mean cluster size shows double peaks at distinct numbers of edges,
and . This result implies that the fragmentation process
of SF graphs under random failures on edges is qualitatively similar to
(different from) the one under intentional attack when
() albert00 ; cohen00 .
Finally, it is noteworthy that recently Aiello el al.aiello02
studied the possibility of forming a spanning cluster for given
and as a function
of , and found that a spanning cluster
can exist only for . However,
the way of constructing a SF graph in their model is different
from ours.
The authors would like to thank S. Havlin for helpful comments on
the manuscript. This work is supported by the KOSEF Grant
No. R14-2002-059-010000-0 in the ABRL program.
References
(1)
P. Erdős and A. Rényi, Publ. Math. Inst. Hung. Acad. Sci. 5,
17 (1960); Bull. Inst. Int. Stat. 38, 343 (1961).
(2)
A.-L. Barabási and R. Albert, Science 286, 509 (1999).
(5)
K.-I. Goh, B. Kahng, and D. Kim, Phys. Rev. Lett. 87, 278701 (2001).
(6)
G. Caldarelli, A. Capocci, P. De Los Rios, and M.A. Muñoz,
Phys. Rev. Lett. 89, 258702 (2002); B. Söderberg,
Phys. Rev. E 66, 066121 (2002).
(7)
R. Albert, H. Jeong, and A.-L. Barabási, Nature 406, 378 (2000)
(8)
R. Cohen, K. Erez, D. ben-Avraham, and S. Havlin, Phys. Rev. Lett. 85, 4626 (2000); Phys. Rev. Lett. 86, 3682 (2001).
(9)
D.S. Callaway, M.E.J. Newman, S.H. Strogatz, and D.J. Watts,
Phys. Rev. Lett. 85, 5468 (2000).
(10) R. Cohen, D. ben-Avraham, and S. Havlin,
Phys. Rev. E 66, 036113 (2002).
(11)
R. Otter, Ann. Math. Statist. 20, 206 (1949);
T.E. Harris, The Theory of Branching Processes (Dover, New York, 1989).
(12)
D. Stauffer and A. Aharony, Introduction to percolation theory
(Taylor & Francis, London, 1992).
(13)
M. Molloy and B. Reed, Random Struct. Algorithms 6, 161 (1995).
(14)
R. Cohen, S. Havlin, and D. ben-Avraham, in
Handbook of Graphs and Networks, edited by S. Bornholdt and H.G. Shuster
(Willey-VCH, New York, 2002), Chap. 4.
(15)
W. Aiello, F. Chung, and L. Lu, Exp. Math. 10, 53 (2001).