Segregation phases in a vibrated binary granular layer
Abstract
We present the results of an experimental study of patterned segregation in a horizontally shaken shallow layer of a binary mixture of dry particles. As the compacity, , of the mixture was increased, the evolution of three distinct phases was observed. We classify them as binary gas, segregation liquid and segregation crystal phases using macroscopic and microscopic measures. The binary gas to segregation liquid transition is consistent with a continuous phase transition and includes the characteristic feature of critical slowing down. At high compacities we observed an intriguing slow oscillatory state.
1 Introduction
In segregation, excitation via flow or shaking can, counter-intuitively, cause an initially homogeneous mixture of grains to de-mix [1, 2]. Intriguingly, it does not always happen and the conditions for its occurrence are difficult to predict. Hence, a better understanding would have a major economic impact in the pharmaceutical, chemical processing and civil engineering industries [3]. However, despite decades of research, a predictive model of the process has yet to emerge. More recently, segregation has received considerable attention from the physics community as an example of a challenging far from equilibrium system with pattern formation [2]. Although many small scale laboratory studies involving vibration [4], avalanching in partially filled horizontal rotating drums [5] and stratification in vertically poured mixtures [6] have been investigated and a variety of mechanisms proposed [7], an understanding of the fundamental principles involved remains incomplete.
In our experiments [8, 1, 9, 10] we have focused on quasi-2-dimensional layers of binary mixtures of particles which are horizontally driven by the stick–slip frictional interaction with the surface of a horizontal tray. Vibration of an initially homogeneous mixed binary layer can give rise to robust segregation of the constituents, depending on the total filling fraction of the layer. We call this parameter the compacity. As the compacity was increased the evolution of distinct phases was observed. We identified them as a binary gas, a segregation liquid and a segregation crystal using both microscopic and macroscopic measures to identify their properties. This horizontal and quasi-2-dimensional set up gives the practical advantage that any collective behavior is readily visualized, vertical compaction effects are effectively eliminated and the material is in contact with the forcing throughout the drive cycle.
For this class of quasi-2D binary granular systems a qualitative segregation mechanism has been suggested [10, 11, 12, 13] using the idea of excluded volume depletion as in colloidal systems and binary alloys [15]. This is in the spirit of the physics of complex systems where attempts have been made to unify descriptions of granular materials, colloids, gels and foams [17, 18]. We discuss the relevance of these ideas to our observations in some concluding remarks.
2 The experiment
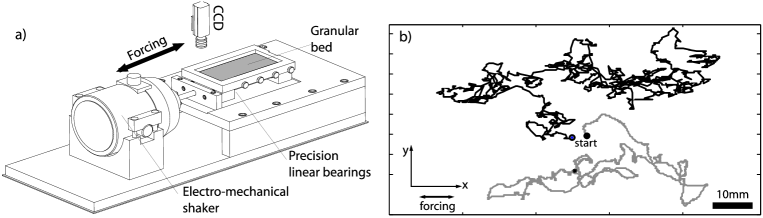
A schematic diagram of the top view of the apparatus is presented in Fig. 1(a). It consisted of an accurately levelled and horizontal smooth rectangular tray, of dimensions with a flatness of less than , on which particles were vibrated longitudinally. The tray was made from aluminum tool plate for increased rigidity and was mounted on a horizontal platform which was connected to an electro-mechanical shaker. Its motion was a close approximation to one-dimensional as it was constrained by four lateral high precision linear bush bearings. The dynamic displacement and acceleration of the shaking bed was monitored by a Linear Displacement Variable Transformer (LVDT) and a piezoelectric accelerometer. The tray’s acceleration was checked to be sinusoidal, to 0.1% in power, using the power spectrum of the accelerometer trace.
We have investigated segregation using a variety of mixtures but here focus on results for two specific types: mixture A (polystyrene spheres + sugar particles) and mixture B (phosphor-bronze spheres + poppy seeds). In particular, we have used mixture B for the detailed quantitative results. The details for the particles’ material properties is presented in Table 1.
At this point we define the layer compacity to be the total filling fraction of the system,
| (1) |
where and are the numbers of species and in the layer, and are the two dimensional projected areas of the respective individual particles ( for poppy seeds and for phosphor-bronze spheres) and and are the longitudinal and transverse dimensions of the rectangular tray. We have chosen to fix the forcing at a single frequency and amplitude and explore the effect of the layer compacity.
| Material | Avg. Diameter () | Density () | Shape |
|---|---|---|---|
| poppy seed | 1.07 () | 0.2 | flat ’kidney’ shaped |
| phosphor-bronze | 1.50 | 8.8 | precision spherical |
| polystyrene | 0.5 | 1.1 | precision spherical |
| sugar | 1.71 | 1.6 | roughly spherical |
Throughout this study, experiments were performed in a quasi-monolayer regime so that the smaller particles were rarely on top of the larger ones. This was particularly the case for the mixtures of poppy seeds and phosphor bronze spheres since the size ratio for these two types of particle is . However, some overlapping of particles did occur so that compacities up to were achieved in the high packing limit.
3 Single particle motion
As discussed above, the forcing was strictly sinusoidal but both types of particles were driven by a stick-and-slip interaction with the oscillatory surface of the container. These interactions induced stochastic motion and trajectories of single particles with the characteristics of a 2D random walk were obtained. Typical one minute long trajectories for a poppy seed and a phosphor-bronze sphere are shown in Fig. 1(b). The statistics of the motion were anisotropic with a preference for motion in the direction of the forcing. Note that the two types of particles responded to the driving differently, due to their mass, shape and surface properties. When many particles were present, collective motion dominated with diffusion biased in the direction of the forcing.
4 Granular segregation
In Fig. 1(c) and (d) we present two examples of segregation patterns for the two mixtures considered. The snapshots correspond to the segregated states which formed after the mixture was vibrated for a period of 15 minutes. The experimental runs were systematically started from a homogeneous mixed layer using the following method. Firstly, small particles were vibrated at large amplitudes, , creating an homogeneous and isotropic sub-monolayer. The large particles were then suspended above the layer, on a horizontal perforated plate with () diameter holes arranged in a triangular lattice. A shutter was then opened and the 1596 particles fell onto the layer of small particles, creating a near homogeneous binary mixture. Domains such as those shown in Fig. 1(c) and (d) then formed. The differences in the physical properties of the two mixtures illustrates that, in our system, patterned segregation is a robust phenomena.
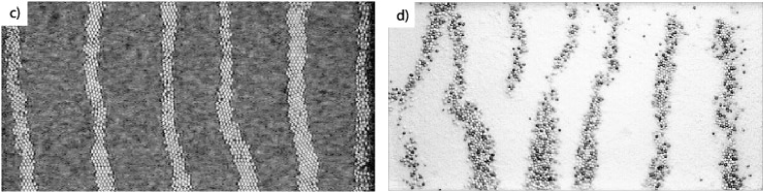
In order to quantify the dynamics of growth of the segregated domains we focus on mixture B and establish two macroscopic measures: the average longitudinal width and the average number of domains of phosphor-bronze spheres. At this stage, the images of the whole layer ( pixels) were processed such that regions of poppy seeds were given a value of 0 (black) and regions of spheres a value of 1 (white). For each acquired frame this was calculated by scanning through each of the 300 horizontal lines and the length, , of each of the white steps was measured. We therefore define, , to be the average value of the domain width and the average number of domains, , to be the number of such steps, per pixel line.
A typical time evolution of for , over a period of 20min, is presented in Fig. 2(a). It is characterised by a fast initial segregation growth, over timescales of the order of . During this period the mechanism of the segregation process is as follows. Initially, single large particles diffuse in a sea of the smaller ones. When two large particles come close together, the smaller particles cannot fit between them, and hence the pair is subjected to an asymmetric pressure that will keep it together. Subsequently, pairs may encounter others so that progressively larger clusters form. The unidirectionality of the driving induces an asymmetry in the segregated domains such that elongated domains of the larger particles (phosphor-bronze spheres or sugar particles) develop. The segregation domains were elongated in a direction perpendicular to the drive. The growth of the domains then exhibits an intermediate saturation level as can be seen in the plateau labelled in Fig. 2(a).
Further coarsening of the domains can take place, albeit at longer timescales. Two examples of the patterns at later times are presented in Fig. 2(b) and (c) at and , respectively. During this period coarsening has occurred via the break-up of one of the stripes and consequent merging with its neighbours. In contrast to the fast initial segregation, this slow coarsening may be associated with large scale collective motion in the layer of poppy seeds.
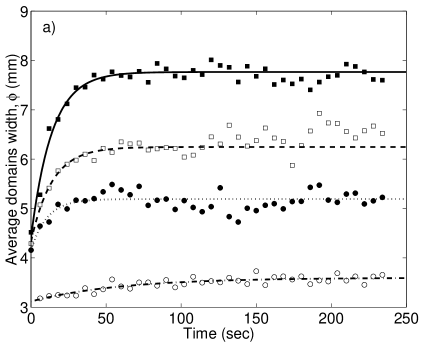
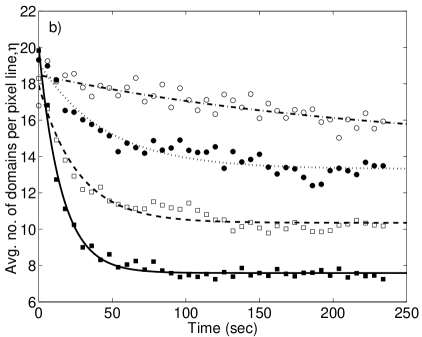
Since there is a distinct separation of the timescales we will now focus on the fast initial segregation growth regime. In Fig. 3(a) and (b), we present typical time-series for and , respectively, for four different values of , over the first of vibration. The superimposed lines are fits of,
| (2) |
to the experimental time series of both and , where and are the respective saturation levels and and , the segregation times, are timescales associated with the saturation of the domain growth. We denote by the segregation level. A result which may be inferred from both sets of time sequences in Fig. 3 is that, when the domains form, there is a progressive coalescence of clusters with an increase of the average width and corresponding decrease in the number of domains in the system.
5 Segregation Phase transition
We next investigated the dependence of the saturation levels, , and segregation times, , on the compacity of the layer for both and . This was done by incrementally increasing the number of poppy seeds, , in the layer, in measured steps, while the number of phosphor-bronze spheres, , held constant, i.e. . We chose to perform the experiments by changing the numbers of poppy seeds. This can be regarded analogous to the experimental protocol in colloid-polymer mixtures of increasing the concentration of the polymer in solution (see Section 8 and Ref. [21]). The qualitative behaviour presented here was found to be robust over a range of .

The -dependence of the segregation level is presented in Fig. 4(a). For low compacities, up to a value, , the segregation level remains low and approximately constant around . This corresponds to approximately two sphere diameters and we do not classify these as domains; the system is deemed to be in a mixed or unsegregated state. This is essentially a collisional regime since there is enough free volume in the system so that particles collide and randomly diffuse, without aggregation. We denote this regime by a binary gas.
As is increased, past , clusters of the larger particles form mobile segregation domains, of increasing , emerge in a nonlinear way. Above , the clusters of larger particles were mobile and their movement was reminiscent of oil drops on water as they flowed, merged and split and the motion of the particles within the clusters was highly agitated. As was incrementally increased there was a gradual decrease of the overall motion of segregation domains so that they become less mobile and increasingly more stable. Also, for larger values of , there was a significant decrease of the agitation of the spheres within the domains.
The average number of domains, shown in Fig. 4 remains approximately constant up to the same value , after which it rapidly decreases as is increased. This is expected for increasingly wider domains since the number of phosphor-bronze spheres is constant. This scenario is consistent with the existence of a continuous phase transition for granular segregation of the binary mixture, as the layer compacity is incrementally increased, with a critical point for segregation, .
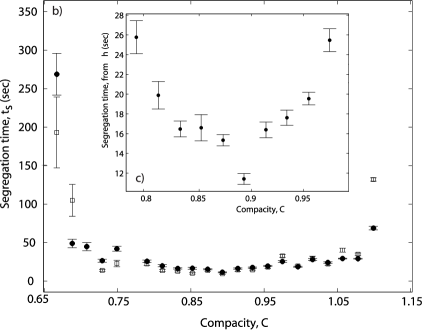
In Fig. 4(b) we present the segregation times obtained from the fits of Eq. (2) to and as a function of . Note that we only define for , since this is the parameter range over which segregation occurs. As expected for a continuous phase transition, diverges, as is decreased from above, near , a phenomena usually referred to as critical slowing down[14]. This adds further evidence for the existence of a phase transition.
As the compacity is increased, past , this slowing down of the segregation persists up to . At this point there is a minimum in the segregation time, as shown in Fig. 3(c), with . For greater values of there is a qualitative change in the segregation behaviour and the layer takes increasingly longer to segregate. At this large values of , stable crystalline stripes form which are separated by dense regions of poppy seeds.
The above scenario suggests that the segregated phase, for , can be sub-divided into two further regimes: one in which the speed of segregation increases with () and another in which the opposite occurs (). We denote the first by segregation liquid and the second by segregation crystal.
6 Binary gas, segregation liquid and segregation crystal phases
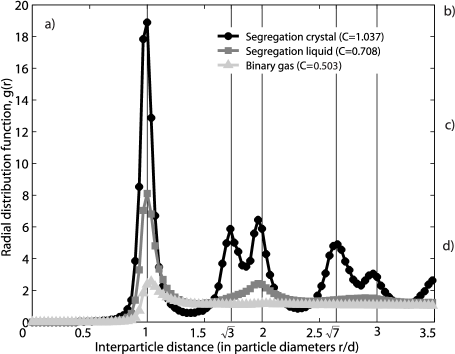

To further justify this idea of three segregation phases we turn to the structural information given by the radial pair distribution function for the large spheres, ,
| (3) |
where is the separation of the and th particles and the angled brackets denote a time average. is a normalization constant such that for a uniform distribution of particles. The data for the calculation of was obtained 3min after the driving was switched on. Time averaging was then performed over 1min, for 1500 temporal realisations of the layer’s configuration.
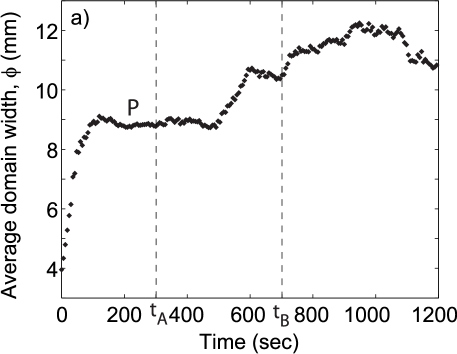
In Fig. 5(a) we show three curves of where each represents the segregation phases discussed above. Typical configurations of the spheres, for each of the phases, are presented in the zoomed photographs in Fig. 5(b),(c) and (d). Note that the photographs have been image processed such that only the phosphor-bronze spheres are visible. For the binary gas (), has a peak at which quickly decays at large distances, as expected for a disordered gas. Increasing results in a monotonic increase of the height of the first peak, . At intermediate compacities (), liquid-like behavior is observed, with peaked at 1, 2 and 3 particle diameters. The positions of neighbouring spheres are correlated and the maxima may be associated with shells of neighbours. The oscillations are rapidly damped, showing the decay of short-range order. This behaviour is commonly seen in hard sphere liquids and was first observed experimentally by Bernal [16]. In the segregation crystal phase () two further peaks emerge near and , characteristic of a hexagonally packed crystal, in two dimensions. At these high compacities, individual spheres in the segregation domains rattle inside the cage formed by its neighbours.
7 Oscillatory states
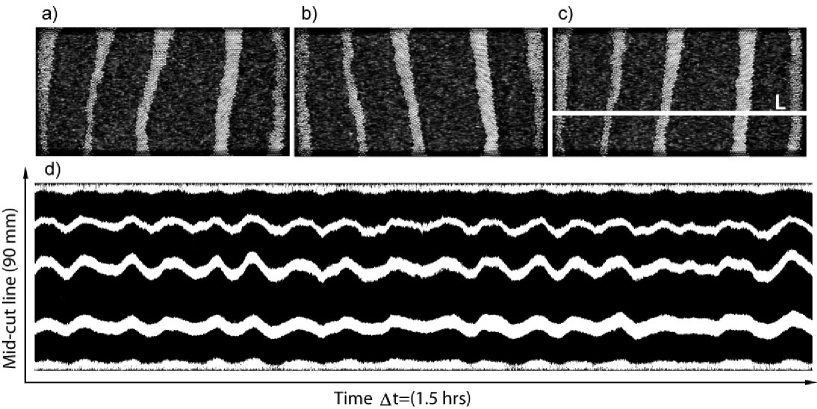
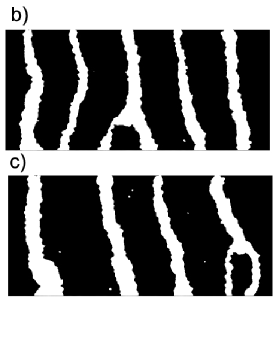
At the highest values of the compacity where robust crystalline stripes form, we have observed intriguing well defined oscillations of the segregation patterns. The phosphor-bronze stripes bend, periodically, backwards and forwards in a reproducible way. For each of the regions of poppy seeds in between two phosphor-bronze stripes, there is a complementary collective motion in the form of a single large vortex. The direction of rotation of the vortex is reversed every half-cycle of the oscillation. In Fig. 6(a)-(c) we show three photographs of the granular layer which were captured 40 min after having started from a homogenous mixture and correspond to the beginning of the cycle, half-cycle and full cycle points of one oscillation, respectively.
We illustrate the periodic nature of the oscillations, in Fig. 6(b) with a space time diagram of the process. This was constructed by sampling along a single line in the -dimension, and progressively stacking the lines over a period of . The sampling line was positioned at 1/3 of the y-length of the tray as indicated by the solid white line superposed in Fig. 6(c). A well defined cycle is clearly observed and it has a period of . This suggests the existence of a strong coupling between the oscillation of the stripes through bending and the vortex inversion in the poppy seed’s layer. It is interesting to note that the timescale associated with these oscillations is times slower than the driving (at ) excluding the possibility of a simple resonance in the driving/granular-layer system. Hence, the mechanism which gives rise to this oscillatory phenomena remains, as yet, unexplained.
8 Discussion and conclusion
It is interesting to note that there are some analogies between segregation in our binary granular system and aggregation in binary colloids [19] and emulsions [20]. In particular, when the size ratio between the large colloidal particles and the radius of gyration of the polymer is larger than , colloid-polymer mixtures display colloidal gas, liquid and crystal phases of the large spheres [21, 22]. Aggregation in such systems is usually explained using an excluded volume depletion argument introduced by Asakura and Oosawa [23] in the context of binary hard spheres. This entropic argument is equivalent to the mechanistic view that if two large particles are close enough so that no other particle (or polymer) may fit between them, they will be subjected to an asymmetric osmotic pressure that leads to an effective attractive inter-particle force. In colloid-polymer mixtures the strength of the interaction can be tuned by changing the concentration of the polymer in solution, therefore inducing gas-to-liquid and liquid-to-crystal transitions. These resemble the granular phases we have observed by incremental increase of the compacity. However, an important difference is that our granular system is both driven and dissipative and therefore far from equilibrium. In addition, Brownian motion is an intrinsic part of the equilibrium dynamics of colloidal systems. Hence a direct connection between the two systems remains an open question.
In conclusion, our results provide quantitative evidence for the
existence of three phases - binary gas, segregation liquid and
segregation crystal - in granular segregation of horizontally
excited binary mixtures. At high compacities, intriguing regular
oscillatory states were observed. We show that segregation
undergoes a continuous phase transition that occurs for
compacities above a critical value and exhibits critical slowing
down. We have presented both macroscopic and microscopic measures
which are self-consistent. Analogies of this phase behaviour may
be drawn with other depletion driven self-assembling binary
systems. This raises the possibility of importing ideas from
binary colloids in equilibrium to formulate new models for
granular segregation.
The authors would like to thank A. Stephenson for valuable discussions. P.M.R. was supported by the Portuguese Foundation of Science and Technology. G.E. was funded by a studentship from the EPSRC. The research of T.M. is supported by an EPSRC Senior Fellowship. This work was completed while visiting the Isaac Newton Institute, Cambridge.
References
- [1] T. Mullin. Science, 295:1851, 2002.
- [2] T. Shinbrot and F. Muzzio. Physics Today, pages 25–30, March 2000.
- [3] J. C. Williams. Powder Technology, 15:245–251, 1976.
- [4] N. Burtally, P. King, and M. Swift. Science, 295:1877–1879, 2002.
- [5] J. M. N. T. Gray. J. Fluid. Mech., 441:1–29, 2001.
- [6] H. Makse, P. Cizeau, and H. Stanley. Phys. Rev. Lett., 78:3298–3301, 1997.
- [7] J. M. Ottino and D. V. Khakhar. Annu. Rev. Fluid Mech., 32:55–91, 2000.
- [8] T. Mullin. Phys. Rev. Lett., 84(20):4741–4744, 2000.
- [9] P. M. Reis and T. Mullin. Phys. Rev. Lett, 89:244301, 2002.
- [10] P. M. Reis, G. Ehrarhdt, A. Stephenson and T. Mullin. submitted to Europhys. Lett., August 2003.
- [11] S. Aumaitre, T. Schnautzand C. A. Kruelle, and I. Rehberg. Phys. Rev. Lett., 90:114302, 2003.
- [12] T. Shinbrot and F. Muzzio. Nature, 410:251–258, March 2001.
- [13] J. Duran and R. Jullien. Phys. Rev. Lett, 80:3547–3550, 1999.
- [14] P. M. Chaikin. Principles of condensed matter physics, (CUP), 1995.
- [15] K. M. Hill and J. M. Kakalios. Phys. Rev. E, 49:R3610, 1994.
- [16] B.J. Bernal, Proc. Roy. Soc, A280:299, 1964.
- [17] A. J. Liu and S. R. Nagel. Nature, 396:21–22, 1998.
- [18] V. Trappe, V. Prasad, L. Cipelletti, P. N. Segre, and D. A. Weitz. Nature, 411:772–775, 2001.
- [19] A. D. Dinsmore, A. G. Yodh, and D. J. Pine. Phys. Rev. E, 52:4045–4057, 1995.
- [20] J. Bibette, D. Roux, and F. Nallet. Phys. Rev. Lett., 65:2470–2473, 1990.
- [21] W. C. K. Poon. J. Phys.: Condens. Matter, 14:R859–R880, 2002.
- [22] A. Moussaïd, W.C.K. Poon, P.N. Pusey and M.F. Soliva, Phil. Trans. R. Soc. Lond. A, 359:897–907, 2001.
- [23] S Asakura and F Oosawa. J. Polym. Sci, 33:183–192, 1958.