Critical behavior of an epidemic model of drug resistant diseases
Abstract
In this work, we study the critical behavior of an epidemic propagation model that considers individuals that can develop drug resistance. In our lattice model, each site can be found in one of four states: empty, healthy, normally infected (not drug resistant) and strain infected (drug resistant) states. The most relevant parameters in our model are related to the mortality, cure and mutation rates. This model presents two distinct stationary active phases: a phase with co-existing normal and drug resistant infected individuals and an intermediate active phase with only drug resistant individuals. We employ a finite-size scaling analysis to compute the critical points the critical exponents ratio governing the phase-transitions between these active states and the absorbing inactive state. Our results are consistent with the hypothesis that these transitions belong to the directed percolation universality class.
pacs:
64.60.Ht, 05.70.Ln, 87.23.Cc, 87.19.XxI Introduction
The spread of epidemic processes in a population has been profusely studied by biologically oriented mathematicians mainly by the use of a set of partial differential equations governing the time evolution of global variables such as the density of infected, refractory and healthy individuals book . At high dimensions where local density fluctuations are negligible, this mean-field like approach gives the correct overall behavior of these systems, according to renormalization group arguments. At low dimensions, density fluctuations become relevant and microscopic approaches have to be considered. In general, most models of epidemic propagation processes present a second order phase transition between a vacuum and a stationary active state Dickman1 ; Dickman2 ; Chopard ; Schutz ; Kwon . The vacuum corresponds to an absorbing state towards which the system can evolve but from which it cannot leave. Systems with such absorbing states cannot satisfy detailed balance due to the irreversible character of their dynamics.
Nonequilibrium phase transitions from active fluctuating into inactive absorbing states have been studied extensively for the last twenty years Dickman2 ; Wijland ; Dickman3 ; Fulco1 ; Lipowski ; Albano . These phase transitions into absorbing states are characterized by a nonequilibrium critical behavior similar to that of an equilibrium phase transition in many respects. One usually uses the concept of scale invariance to understand nonequilibrium phase transitions with critical exponents characterizing its universal behavior. These exponents allow us to categorize nonequilibrium phase transitions into different universality classes. In reaction models for the spread of epidemics, the density of infected individuals acts as the order parameter, vanishing in the absorbing state and having a finite average value in the active state. The transition between the active and stationary state is achieved by tuning a typical reaction rate that acts as the relevant control parameter. In the vicinity of the critical point, the density of infected individuals vanishes as . Nonequilibrium phase transitions are often characterized by spatial and temporal correlation lengths. Close to the transition point, the spatial and temporal correlation lengths diverge as and . These two correlation length scales are related by , where is called the dynamic exponent. These three critical exponents ( , , ) form the basic set of exponents characterizing the universality class of a given reaction-diffusion process. It is generally believed that nonequilibrium phase transitions into absorbing states can be categorized into a finite number of universality classes. Usually, systems presenting a continuous transition to a single absorbing state belong to the directed percolation universality class Dickman2 ; Hinrichsen1 ; Lipowski2 . However, some exceptions to this general rule have been recently reported to occur basically in systems with a infinite number of absorbing states Jensen ; Munoz ; Marques ; Dickman4 ; Hooyberghs ; Wijland1 or with particle diffusion Fulco2 ; Hinrichsen2 ; Kwangho .
In recent years, there has been a growing interest in studying diseases caused by organisms that can mutate into drug resistant forms. One of the major reasons for the emergence of such resistant organisms is the inappropriate use of the drugs used to combat them. Such is the case, for example, when antibiotics are incorrectly administered to treat the tuberculosis bacillus Gupta ; daSilva , or the excessive use of anti-malaria drugs in Amazonia, Brazil Ferraroni ; Kremsner ; deAlencar ; Cerutti ; Duarte . Although these drugs are the only known effective treatments for such diseases, their abuse can very quickly lead to the emergence of drug resistant mutant strains. For example, while the exact mechanisms are not fully understood, strains have evolved that are resistant to every drug used in Amazonia during the 1950’s and 60’s. To retard the emergence of such resistant strains, measures are now being taken in the medical profession to administer drugs only when needed, and giving preference to drug “cocktails” with multiple components deAlencar ; Cerutti ; Duarte . Recently, an epidemic spreading model with immunization and mutations has been introduceddammer . The model also exhibits a phase transition belonging to the directed percolation universality class and shows explicitly that the protection gained by immunization is substantially decreased by the occurrence of mutations.
In this work, we will study a -dimensional stochastic epidemic propagation model considering the potential emergence of a population of drug resistant organisms. We will be mainly interested in determining the stable phases and the scaling exponents governing the possible phase transitions. The model presents two coupled order parameters, namely, the density of drug sensitive and drug insensitive individuals. The coupling of an order parameter to a fluctuating density has been shown to modify the universality class of the absorbing sate phase transition in some models of population dynamicsKree ; Wijland . By employing extensive numerical simulations in finite populations and finite size scaling analysis, we will show that an active phase emerges in which there is no drug sensitive individuals but a finite density of drug resistant ones. The relative strength of the parameters controlling the processes of healing, death and development of drug resistance, actually determines the stationary population state. Further, we will show that all identified transitions in this model seem to belong to the directed percolation universality class.
II Basic model for the emergence of drug resistance
Here, we will follow closely the ideas of Schinazi . Individuals distributed at random on a given environment can be in three possible states, namely healthy, infected by normal strain and infected by resistant strain. Birth of individuals will be introduced by considering that a vacant site becomes occupied by a healthy individual at a rate . Infection occurs by contact at a rate where is the number of infected neighbors and the index stands for normal () and drug resistant () states. Individuals infected with the normal strain can heal at a rate . In what follows, we will consider that the healing rate is due to drug administration, i.e., the spontaneous healing rate is negligible. Infected individuals can also develop drug resistance at a rate . This process can be originated by both natural mutations and bad drug administration. Individuals that develop drug resistance will not be allowed to heal and die at a mortality rate . The average surviving-time of drug resistant individuals is much smaller than the average life-time of individuals infected with the normal strain, which will be taken as infinite in our simulations. The above dynamical rules describing the processes of birth, death, healing, development of drug resistance and infection by contact with normal or resistant strains are summarized in table 1. Notice that the state with only healthy individuals is an absorbing one, since it is no longer possible for anybody to become infected. Such is the case, for example, with small pox, which has been eradicated.
A mean field approximation can be described using the following rate equations for the average densities:
where a homogeneous, i.e., spatially uniform density of all populations was assumed. It is straightforward to show that there are three possible stationary states: (i) the absorbing state with only healthy individuals; (ii) an active state where healthy individuals coexist with individuals infected by normal and resistant organisms; and (iii) a second active state where healthy and infected individuals coexist but all infected individuals have the resistant organism. An important point to note is that normal organisms always coexists with resistant organisms, i.e., a stationary active state without a drug resistant population is not possible.
The basic contact process (CP), introduced by Harris Harris as a “toy model” for spreading of disease, corresponds to the limiting case where only states and are allowed Jensen ; Munoz ; Alon ; Dickman5 . The infection reaction rate is where is the number of infected neighbors, and the cure rate is , i.e. all sick individuals will recover in the next time step. Below the critical threshold , the absorbing state is reached, but for a stationary active state is possible. The model can also be applied to study the spread of a disease in the absence of mutations. In this case, we have only states , and . This model is known in the literature as the forest fire model Bak ; Drossel ; Henley . The above two limits have been extensively investigated in the literature and accurate estimates of their critical exponents have shown that they belong to the directed percolation universality class. Here, we are going to perform extensive numerical simulations to obtain the full phase-diagram of the model allowing all possible states.
III Numerical simulations: Phase diagrams and critical exponents
We employed the above described model in finite one-dimensional chains with periodic boundary conditions. Sites are considered to be vacant or occupied by an individual that interacts with its nearest neighbors. The initial state corresponds to a random distribution of healthy () and infected () individuals. For a given set of model parameters, we let the system evolve towards a statistically stationary state. In what follows we are going to restrict our study to the particular case of , letting as free parameters the rates of mutation (), cure () and mortality (). In our simulations, the statistically stationary state was considered as reached after lattice sweeps. Configurational averages were performed by considering the subsequent configurations. Finite size simulations of dynamical systems exhibiting an absorbing state are usually compromised by the fact that this is the only stationary state. To avoid this feature, we reactivate the dynamics whenever the absorbing state is reached by introducing a small density of the critical order parameter. The dynamics follows the rules of contamination, healing, mutation, death and birth processes summarized in table 1. In addition to these rules, the contamination of a healthy individual that is surrounded by both kinds of infected sites is chosen to be preferentially updated to state (resistant strain).
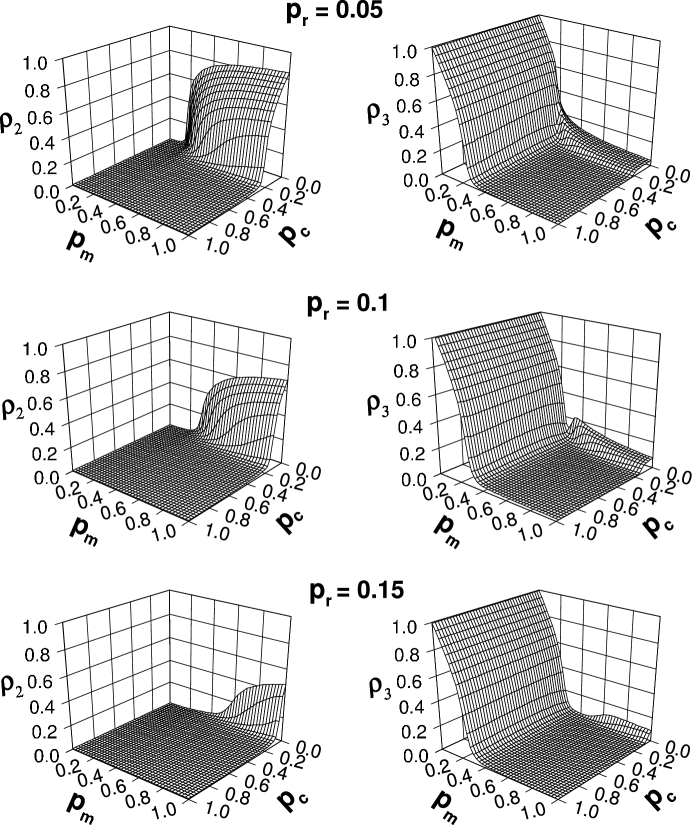
In figure 1, we show the equilibrium density of normally infected individuals () and drug resistant ones () as obtained from simulations on chains with sites for three characteristic values of the mutation rate . We observe that the absorbing state is the equilibrium state for large values of cure and mortality rates. Two distinct active stationary regimes are also clearly identified. The first one corresponds to a state with zero density of normally infected but with a finite density of drug resistant ones. This phase is stable at low death rates and its emergence is independent of the mutation rate . The large surviving time of drug resistant individuals in this regime favors the contamination process. The second active state has co-existing densities of normal and drug resistant infected individuals. It emerges in the regime of low cure rates but disappears for large mutation rates. A direct transition between these active states takes place at low death and cure rates.
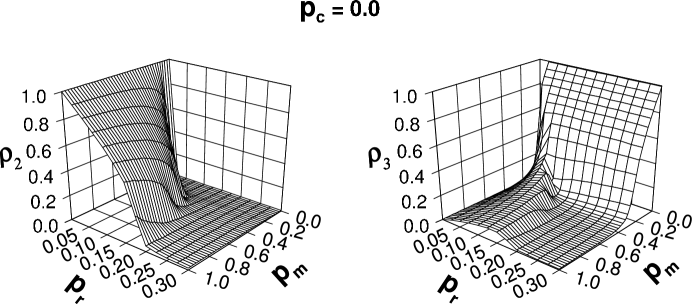
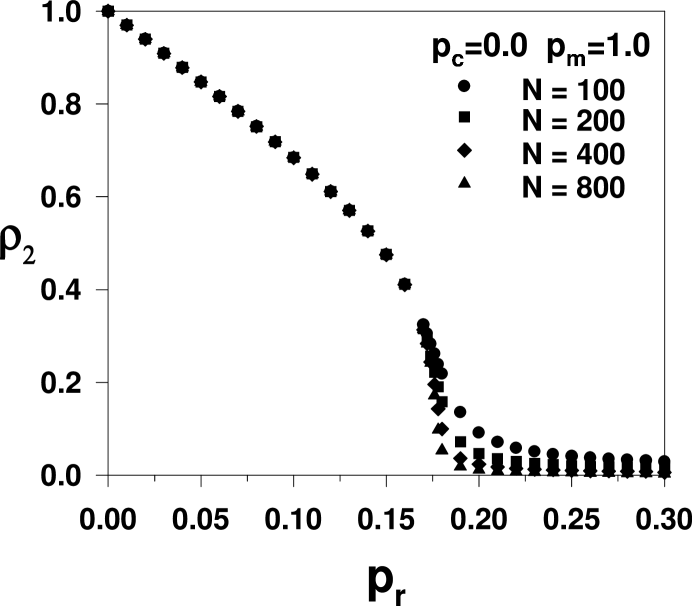
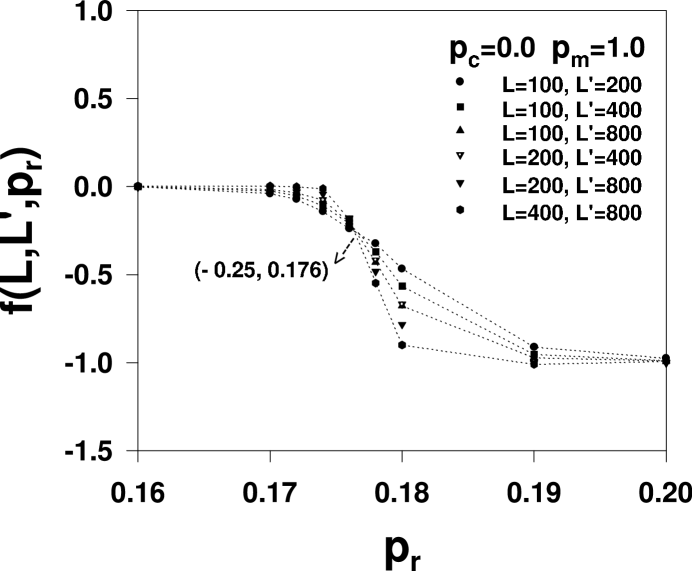
In order to closely investigate the transition between the active state with co-existing densities and the absorbing state, we computed the order parameter densities for (no healing), which is the most favorable case for co-existence. In figure 2, we show the relevant densities as function of and . Notice that there is a critical mutation rate above which the phase with co-existing densities disappears. The maximum value for the critical mutation rate is attained for . To have an accurate estimate of the critical parameters, we employed a finite size scaling analysis of our numerical data. Figure 3 shows the density as a function of the mutation rate for the special case of and and several chain sizes. The data suggest a continuous transition near . A numerical renormalization group analysis of the above data can provide a better estimate of the critical value. This procedure explores the finite size scaling relation that the order parameter density is expected to obey at the vicinity of the critical point, namely
| (1) |
Therefore, one can construct a family of auxiliary functions
| (2) |
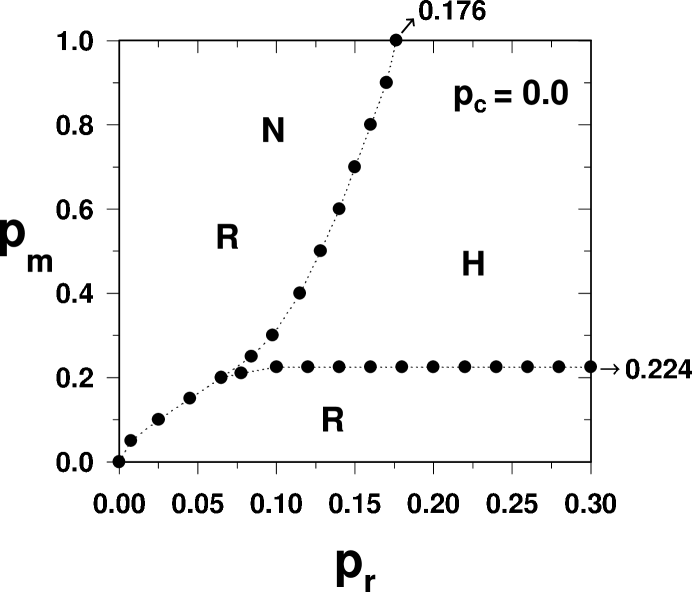
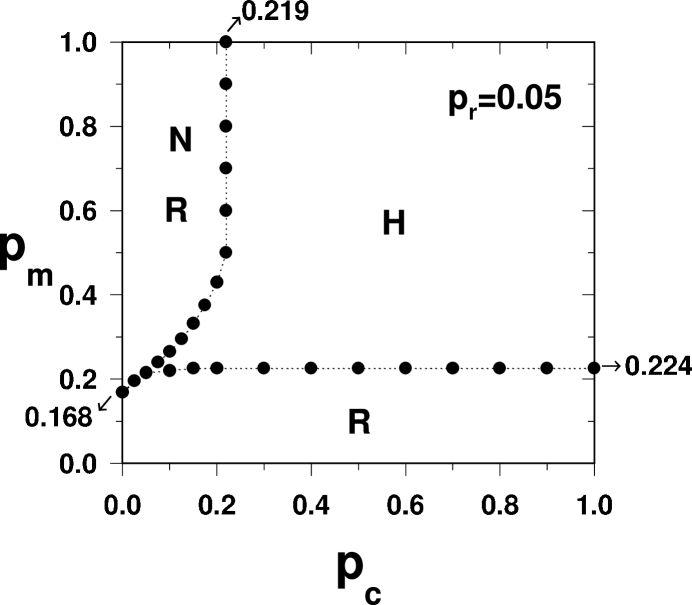
According to the finite size scaling hypothesis, these auxiliary functions shall all intercept at the critical point and . In figure 4, we report the above scaling analysis to the data shown in figure 3. All curves obtained from distinct pairs of lattice sizes intercept nearly at the same point. Without considering any correction to scaling, we obtain an accurate estimate of and the critical exponents ratio . The above finite-size scaling analysis was employed to obtain the full phase diagram in the absence of treatment () as shown in figure 5. The absorbing healthy state (H) is always the equilibrium one at large mutation and mortality rates. The phase diagram exhibits three distinct phase transitions. For mortality rates above , the active state is the one with co-existing densities of normal (N) and resistant (R) individuals which is the stationary state at small . For mortality rates below the stationary state is always active, as the long surviving-time of infected individuals makes the contamination process the predominant one. However, there is a transition between the active co-existing state at small to the active state with a finite density of drug resistant individuals and a zero density of normal individuals at large . Notice that at intermediate mutation rates the phase-diagram presents re-entrant transitions with the sequence of active-inactive-active equilibrium states appearing with increasing mortality rates . In all cases, the measured values of were consistent with these transitions belonging to the directed percolation universality class. In figure 6 we illustrate the main phase-diagram for a fixed mutation rate. In this case, the absorbing state is the equilibrium state at large cure and mortality rates. At low mortality rates [below the critical value , there is always a finite density of drug resistant individuals. With increasing cure rate a transition between the active co-existing state and the absorbing state can takes place. The line delimiting this transition saturates at a maximum critical cure rate which decreases with increasing mutation rates. Further, this co-existing phase is only stable for mortality rates larger than and moves to larger values as increases. At small mutation rates the above two lines intercept (as shown in the figure) and a direct transition between the two possible active states can take place. On the other hand, at the limiting value of the NR to H transition line disappears and the co-existing phase is no longer stable. Re-entrant sequence of active-inactive-active equilibrium states can also be achieved at intermediate cure rates.
IV Summary and Conclusions
We have studied a stochastic epidemic model in a 1-dimensional lattice which considers the possibility of individuals to develop drug resistance. Individuals with the normal disease may heal due to drug administration but those with the resistant strain do not heal and die at a finite mortality rate. We numerically simulated this model of population dynamics in finite chains with periodic boundary conditions and investigated the properties of the stationary states. The model presents one absorbing inactive state with only healthy individuals. There is also a main active stationary state with fluctuating densities of normal and drug resistant infected individuals. Further, an intermediate active stationary state with no normally infected individuals and a fluctuating density of drug resistant ones is also realizable. This state can be the stationary one only when the mortality rate is below a critical threshold , since under this condition the long surviving-time of drug resistant individuals potentialize this epidemic process. For mortality rates above the critical threshold a transition between the main active to the absorbing state takes place with increasing cure rates. We reported typical phase-diagrams showing the stationary states as a function of the main transition rates. The phase-diagram exhibits re-entrant regions and a direct transition between the main and intermediate active states at low mutation rates. We further employed a finite-size scaling analysis to compute the exponent ratio which is consistent with these transitions belonging to the directed percolation universality class.
V Acknowledgments
This work was partially supported by the Brazilian research agencies CNPq and CAPES and by the Alagoas state research agency FAPEAL.
References
- (1) J. D. Murray, Mathematical Biology (Springer, Berlin, 1993).
- (2) R. Dickman, Nonequilibrium Statistical Mechanics in One Dimension, edited by V. Privman (Cambridge University Press, Cambridge, England,1996).
- (3) J. Marro and R. Dickman, Nonequilibrium Phase Transitions in Lattice Models, (Cambridge University Press, Cambridge, England,1999), and references therein.
- (4) B. Chopard and M. Droz, Cellular Automata Modelling of Physical Systems, (Cambridge University Press, Cambridge, England,1998).
- (5) G. M. Schutz, Phase Transitions and Critical Phenomena, edited by C.Domb and J. L. Lebowitz (Academic Press, New York, 2000), Vol. 19.
- (6) S. Kwon, J. Lee and H. Park, Phys. Rev. Lett. 85, 1682 (2000).
- (7) R. Dickman, Physica A 306, 90 (2002).
- (8) U. L. Fulco, D. N. Messias and M. L. Lyra, Physica A 295, 49 (2001).
- (9) A. Lipowski and M. Droz, Phys. Rev. E 64, 031107 (2001).
- (10) E. V. Albano, M. A. Munoz, Phys. Rev. E 63, 031104 (2001).
- (11) H. Hinrichsen, Adv. Phys. 49, 815 (2000).
- (12) A. Lipowski and D. Lipowska, Physica A 276, 456 (2000).
- (13) I. Jensen, Phys. Rev. Lett. 70, 1465 (1993); I. Jensen and R. Dickman, Phys. Rev. E 48, 1710 (1993).
- (14) M. A. Muñoz, G. Grinstein, R. Dickman and R. Livi, Phys. Rev. Lett. 76, 451 (1996).
- (15) M. C. Marques, M. A. Santos and J. F. F. Mendes, Phys. Rev. E 65, 016111 (2001).
- (16) R. Dickman, W. R. M. Rabêlo and G. Ódor, Phys. Rev. E 65, 016118 (2001).
- (17) J. Hooyberghs, E. Carlon and C. Vanderzande, Phys. Rev. E 64, 036124 (2001).
- (18) F. van Wijland, Phys. Rev. Lett. 89, 190602 (2002).
- (19) U. L. Fulco, D. N. Messias and M. L. Lyra, Phys. Rev. E 63, 066118 (2001).
- (20) H. Hinrichsen, Phys. Rev. E 63, 036102 (2001).
- (21) Kwangho Park and In-mook Kim, Phys. Rev. E 66, 027106 (2002).
- (22) R. Gupta, J. G. Brenner, C. L. Henry, J. Y. Kim, S. Shin, M. Espinal, M. C. Raviglione, WHO 276, 1-20 (1999), and references therein.
- (23) P. E. A. da Silva, M. Osório, M. C. Reinhardt, L. S. Fonseca and O. A. Dellagostin, Microbes and Infection 3, 1111 (2001).
- (24) J. J. Ferraroni, F. H. Alencar and R. Shrimpton, T. Roy. Soc. Trop. Med. Hyg. 77, 138, (1983); J. J. Ferraroni, Rev. Saude Publ. 17, 328, (1983); F. H. Alencar, J. J. Ferraroni and R. Shrimpton, Rev. Saude Publ. 16, 299, (1982).
- (25) P. G. Kremsner, G. M. Zotter, W. Grainger and H. Feldmeier, Lancet 2, 684, (1987); P. G. Kremsner, H. Feldmeier, R. M. Rocha and W. Grainger, Rev. I. Med. Trop. 30, 118, (1988)
- (26) F. E. C. de Alencar, C. Cerutti, R. R. Durlacher, M. Boulos, F. P. Alves, W. Milhous and L. W. Pang, J. Infect Dis. 175, 1544, (1997).
- (27) C. Cerutti, R. R. Durlacher, F. E. C. de Alencar, A. A. C Segurado and L. W. Pang, J. Infect Dis. 180, 2077, (1999).
- (28) E. C. Duarte, L. W. Pang, L. C. Ribeiro and C. J. F. Fontes, Am. J. Trop. Med. Hyg. 65, 471, (2001).
- (29) S. M. Dammer and H. Hinrichsen, Phys. Rev. E 68, 016114 (2003).
- (30) R. Kree, B. Schaub, and B. Schmittmann, Phys. Rev. A 39, 2214 (1989).
- (31) K. Oerding, F. van Wijland, J.P. Leroy, and H.J. Hilhorst, J. Stat. Phys. 99, 1365 (2000).
- (32) R. B. Schinazi, J. Stat. Phys. 97, 409, (1999).
- (33) T. E. Harris, Ann. Prob. 2, 969 (1974).
- (34) U. Alon, M. R. Evans, H. Hinrichsen and D. Mukamel, Phys. Rev. Lett. 76, 2746 (1996).
- (35) R. Dickman, J. K. L. da Silva, Phys. Rev. E 58, 4266 (1998).
- (36) P. Bak, K. Chen, and C. Tang, Phys. Lett. A 147, 297 (1990).
- (37) B. Drossel and F. Schwabl, Phys. Rev. Lett. 69, 1629 (1992); for a review, see S. Clar, B. Drossel, and F. Schwabl, J. Phys.: Condens. Matter 8, 6803 (1996).
- (38) C. L. Henley, Bull. Am. Phys. Soc. 34, 838 (1989); Phys. Rev. Lett. 71, 2741 (1993).
| EVENT | EFFECT | TRANSITION RATE |
|---|---|---|
| Birth | ||
| Infected by contact | ||
| Infected by contact | ||
| Mutation | ||
| Cure | ||
| Death |