First order isotropic - smectic-A transition in liquid crystal-aerosil gels
Abstract
The short-range order which remains when the isotropic to smectic-A transition is perturbed by a gel of silica nanoparticles (aerosils) has been studied using high-resolution synchrotron x-ray diffraction. The gels have been created in situ in decylcyanobiphenyl (10CB), which has a strongly first-order isotropic to smectic-A transition. The effects are determined by detailed analysis of the temperature and gel density dependence of the smectic structure factor. In previous studies of the continuous nematic to smectic-A transition in a variety of thermotropic liquid crystals the aerosil gel appeared to pin, at random, the phase of the smectic density modulation. For the isotropic to smectic-A transition the same gel perturbation yields different results. The smectic correlation length decreases more slowly with increasing random field variance in good quantitative agreement with the effect of a random pinning field at a transition from a uniform phase directly to a phase with one-dimensional translational order. We thus compare the influence of random fields on a freezing transition with and without an intervening orientationally ordered phase.
pacs:
64.70.Md,61.30.Eb,61.10.-iI Introduction
The formation of the smectic-A (SmA) phase is intriguing because the resulting one-dimensional density modulation lacks true long-range order Peierls ; L_and_L . Much effort has been devoted to experimental characterization and theoretical description of the SmA phase of thermotropic liquid crystals G_and_N ; N_and_T . More recently, the effects of quenched random disorder on the nematic (N) - SmA transition have been studied. The interplay between the thermal fluctuations which disrupt the long-range order and static fluctuations due to quenched randomness is fascinating. Experimentally, quenched randomness can be introduced via a porous random environment such as aerogel. In order to probe weaker disorder the rigid aerogel has been replaced by a hydrogen-bonded gel of aerosil particles. In both cases the N - SmA transition has been studied using calorimetry Aerogel_Cp ; Aerosil_Cp , deuterium NMR Aerogel_DNMR ; Aerosil_DNMR and x-ray diffraction Aerogel_X ; Aerosil_X . In addition, results have been presented for the isotropic (I) - SmA transition for a liquid crystal confined in an aerogel Aerogel_IA . Here we present a comprehensive x-ray diffraction study for an aerosil gel.
For many liquid crystals the SmA phase forms from the orientationally ordered N phase. There is coupling between the order parameters and fluctuations of the two phases. As the SmA phase becomes more favorable at higher temperatures, due to changes in the molecule or mixture composition, the N-SmA transition occurs while the N order parameter is less and less saturated. The transition into the SmA phase enhances the N order. This coupling between order parameters leads to a tricritical point in the phase diagram dG_and_P . As the stability of the SmA phase is further enhanced a triple point occurs in the phase diagram and the N phase ceases to be stable. Beyond this point, orientational order occurs along with positional order in the SmA structure. The pretransitional fluctuations of the SmA order in the I phase occur over a sphere of ordering wave vectors corresponding to the layer spacing. The transition is thought to be first order due to the contribution of these fluctuations as described by Brazovskii Brazovskii ; Anisimov . The observation that the I-SmA transition is strongly first order for 10CB Marynissen ; Thoen_p may well be due to the de Gennes coupling between smectic and nematic order parameters in the isotropic phase Gohin .
The cyanobiphenyls are a well-studied family of thermotropic liquid crystals Thoen . These molecules have a flexible aliphatic tail the length of which influences the stability of the SmA phase. Both decylcyanobiphenyl (10CB) and dodecylcyanobiphenyl (12CB) exhibit transitions directly from the I phase to the SmA phase. Since, in establishing the SmA order, both orientational and positional order must be developed, one might expect this transition to be especially strongly perturbed by quenched random disorder. Thixotropic (hydrogen bonded) gels can be created by dispersing fine, hydrophilic aerosil particles in the liquid crystal. These silica nanoparticles hydrogen bond together creating a flexible structure which can substantially perturb the interpenetrating liquid crystal material. The pore volume fractions range from 0.77 to 0.99.
Previous studies of the N-SmA transition in liquid crystal-aerosil gels have implied that the main effect of the aerosils is to pin the phase of the SmA density wave Aerosil_X ; Germano2 ; Clegg1 . Specifically, both the size of the SmA domains and the detailed wave vector dependence of the x-ray structure factor have been in quantitative agreement with the predictions of a random pinning field model. In this paper we are reporting the results of a study of the random field model at a first-order transition. As first articulated by Imry and Ma, the simplest understanding of the effects of random fields comes from considering a balance between the benefit of aligning with the local random field and the cost of forming a domain wall I_and_M . This model predicts differing responses for transitions which break discrete and continuous symmetries. The situation becomes more complicated for first-order transitions due to the possibility of two-phase coexistence I_and_W . Domain walls can exist between ordered and disordered regions as well as between ordered domains. A guide to the likelihood of two-phase coexistence is whether the disorder causes a substantial suppression of the phase transition temperature. Should it do so, it is likely that large variations of transition temperatures will occur locally giving two-phase coexistence so that the sharp transition will then be smeared out. Two-phase coexistence will alter the penalty for forming domain walls. Substantial two-phase coexistence results in sharp boundaries between ordered and disordered regions. This has similarities to a transition which breaks a discrete symmetry with random fields. One might speculate that long-range order could be observed for sufficiently weak disorder in . Without significant two-phase coexistence the domain walls will be broad and the response should correspond to expectations for a transition which breaks a continuous symmetry in the presence of random fields.
In reference Aerogel_IA a silica aerogel is used to impose quenched disorder on 10CB, and similar previous studies of the liquid crystal 650BC are also discussed. Both of these materials exhibit transitions directly from the I to the SmA phase. The correlation lengths are observed to increase discontinuously at the transition temperature and to saturate quickly. Meanwhile, the scattering intensity increases only slowly with decreasing temperature. The transition is observed to remain first order under this strong confinement and this is confirmed via optical microscopy of the coexisting phases. It is surprising that the correlation length remains almost constant as the SmA order goes from the two phase coexistence region to the uniform phase region. The transition temperature is found to remain roughly unchanged.
Here we show that the liquid crystal-aerosil gel also retains only short-range SmA order deep into the SmA phase temperature region. In common with previous studies, a range of gel densities have been prepared and characterized using high-resolution x-ray diffraction. The results demonstrate that our quantitative understanding of the N-SmA transition naturally extends to this new class of transition. In Sec. II we outline preliminary details including the differences for x-ray diffraction between the I-SmA transition and the N-SmA transition and the experimental techniques employed. Section III gives the results and analysis. The quantitative comparison between these results and existing theoretical models is discussed in Sec. IV and conclusions are drawn.
II Preliminary Details
II.1 X-ray Structure Factor
The x-ray scattering line shape approaching the N-SmA transition Ocko and deep within the SmA phase Als-Nielsen have been characterized in great detail. In the former case the data for a wide range of liquid crystalline materials have been found to be described by the structure factor
| (1) |
where is the wave vector where the SmA peak occurs corresponding to a layer spacing . The correlation length and wave vector components are parallel (perpendicular) to the nematic director. The susceptibility is , while ranges between 0.25 and 0 and gives the scale of the fourth-order correction. The second-order contribution to the line shape arises due to the influence of nematic fluctuations on the formation of the SmA state Litster . Far below the N-SmA transition these fluctuations are constrained to be perpendicular to the smectic layers. In the case of finite correlation lengths, and , the structure factor then can be written approximately as
| (2) |
In the case of infinite correlation lengths, the structure factor has been described by Caillé Caille and varies with and respectively ( depends on the elastic constants) Als-Nielsen .
Experimental determination of these structure factors for pure liquid crystals was carried out in an applied magnetic field. In the N phase all regions of the sample become aligned allowing detailed characterization of the pretransitional smectic fluctuations or the algebraic decay within the SmA state. Equivalent studies are not possible for the I-SmA transition since there is no possibility of magnetic field alignment in the N state. Hence, only very preliminary studies have been made of the line shape for 12CB C_and_S . In what follows, we analyze our results assuming that the SmA fluctuations are either similar to those in nonylcyanobiphenyl (9CB) as given by Eq.(1) or that the scattering is described by Eq.(2). At the I-SmA transition the orientational order is caused by the formation of the SmA state. As a result, we anticipate that the nematic director will be constrained to lie perpendicular to the smectic layers. By this argument Eq.(2) appears to be a good approximation to the structure factor.
II.2 Experimental Techniques
The 10CB was synthesized at Kent State University. Type-300 aerosil was supplied by Degussa Degussa and was dried prior to use. The amount of aerosil in each sample was quantified by the parameter , the mass of aerosil divided by the volume of liquid crystal. X-ray diffraction experiments were carried out at the National Synchrotron Light Source at Brookhaven National Laboratory. The beam lines used were X20A, X20C and X22A. Liquid crystal samples containing dispersed aerosils were in the solid phase following long periods at room temperature and so prior to study were remixed with pure ethanol, sonicated and then dried for several days on a hot plate. The gel samples were placed in 5-mm radius disks which have kapton windows Park . The kapton x-ray diffraction signal has a powder peak outside the range of interest for these experiments. Temperature control is via a PI controller to within K. Each sample was kept in the I phase at a temperature around 30 K above the I-SmA transition for 6 hours after being transferred to the holder. The number of scans for each sample was kept limited to avoid undue x-ray damage.
III Results and analysis
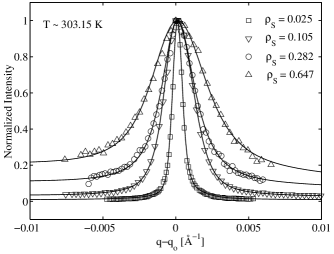
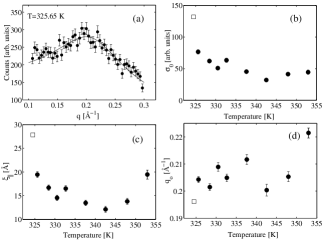
Figure 1 presents our measurements and analysis of the pretransitional fluctuations in the isotropic phase of 10CB. Pretransitional smectic fluctuations are extremely weak in the pure material and were never evident in the gel samples. Figure 1(a) shows a typical scan; the peak is very broad and the solid line is the result of a fit to Eq.(1) varying , , and and using the known 9CB characteristics for and . The parameters from such fits are displayed in panels b,c,d of Fig. 1. There is no indication that the susceptibility, , or the parallel correlation length, are about to diverge. The weakness of the fluctuations immediately prior to the transition strongly suggest that this is not a typical fluctuation driven first-order transition. The observed behavior is likely due to the de Gennes coupling between nematic and smectic order parameters.
The 10CB-aerosil sample compositions studied are listed in Table 1. Measurements were made from a temperature ( K) well above the I-SmA transition ( K). However, the SmA line shape for 10CB-aerosil samples only appeared at a pseudotransition temperature with a substantial correlation length already established. Typical scans are presented in Fig. 2. The peaks are all broader than the instrumental resolution. The width increases with increasing gel density but varies little with temperature. Data were taken down to K, which is well below the bulk material crystallization temperature BDH ( K). The lines in Fig. 2 corresponds to a model that will be described below. Two samples, and , were measured on beam-line X22A where slightly higher instrumental resolution could be achieved. Typically, the peak position in the SmA phase was Å-1, rising just below the transition and dropping slightly at lower temperatures.
For previous x-ray studies of the N-SmA transition in aerosil gels, the line shape was taken to be composed of two contributions Aerosil_X ; Clegg1 ; Park ; Clegg2 . The first part is the thermal term, Eq.(1), which is identical to that of the pure material, while the second part is the random-field term, which has the form of the thermal term squared. The total structure factor is
| (3) | |||||
where corresponds to Eq.(1) for the N-SmA transition with the numerator set equal to 1 and the denominator of is the square of the denominator of . and are the amplitudes for the thermal and random-field terms respectively. Since the samples are comprised of a random arrangement of ordered domains this structure factor has to be averaged over all orientations. Prior to comparing the model with the data this spherically averaged line shape must be convoluted with the measured instrumental resolution function. Both the integral over orientations and the convolution were performed numerically using commercially available routines.
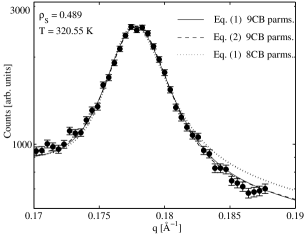
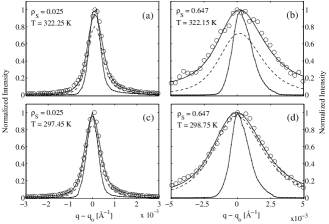
Figure 3 shows the results of fits to a typical profile. The dotted and solid lines result from applying Eq.(3) to the 10CB-aerosil data using the form of Eq.(1) for . Here, as elsewhere Aerosil_X ; Park ; Clegg1 ; Clegg2 , we take as a parameter to be fitted and we assume that and remain the same as for the pure material Leheny_p . The behavior of , and for 10CB are not known. The dotted and the solid line in Fig. 3 assume that 8CB behavior and 9CB behavior for and are followed respectively Ocko_Thesis . It is evident that either fit gives a reasonable description of the data, with the use of 9CB parameters yielding a somewhat better fit. This model using the 9CB relationships for and has been used to analyze all of the 10CB-aerosil results. The fit parameters are , and , whose optimum values are determined using a least-squares fitting procedure. The dashed line in Fig. 3 shows the result of a fit with Eq.(3) to the 10CB-aerosil data using the form of Eq.(2) for . Again is assumed to remain the same as in bulk 9CB; however in this case the transverse tails of the peak are assumed to have changed. This model also gives a good correspondence to the data. Use of a model based on Eq.(2) for the form of systematically modifies the fit parameters compared to those presented here. There is a small shift in favor of the thermal term and the correlation length decreases. The latter feature is returned to in more detail below.
| (g cm-3) | (Å) | (Å-3) | (K) | ||
|---|---|---|---|---|---|
| 0.0 | 1 | - | - | 324.49 | - |
| 0.025 | 0.99 | ||||
| 0.051 | 0.98 | ||||
| 0.105 | 0.95 | ||||
| 0.226 | 0.91 | ||||
| 0.282 | 0.89 | ||||
| 0.355 | 0.86 | ||||
| 0.489 | 0.82 | ||||
| 0.647 | 0.77 |
The variation of the two components of the line shape, with temperature and is shown in Fig. 4. Panels Fig. 4(a & b) are for high temperature and Fig. 4(c & d) are for low temperature. While Fig. 4(a & c) are for low and Fig. 4(b & d) are for high . The second term in Eq.(3) dominates the scattering for all temperatures studied (dashed line). The full model Eq.(3) using Eq.(1) for is the solid line. The peak width varies little with temperature but is seen to be broader than the instrumental resolution (Fig. 4).
Figures 5 and 6 show parameters determined by the fit procedure versus temperature while Figs. 7 and 8 show parameters versus . In the latter case, the results are compared to those from other liquid crystal-aerosil gels at temperatures below the N-SmA transition.
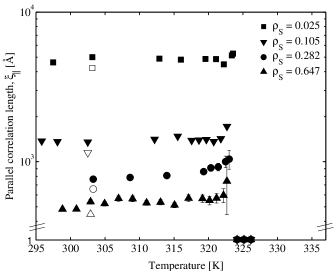
The behavior of the parallel correlation length, , as a function of temperature is shown for a selection of samples in Fig. 5 (solid symbols). The fact that these are all finite shows that the quasi long-range SmA state has been destroyed by the gel. The pseudotransition to short-range smectic order remains sharp and the correlation length jumps directly to its low temperature value with no pretransitional fluctuations. This behavior strongly suggests that the transition remains first order in the gels. As the gel density is increased the correlation length systematically decreases. The open symbols in Fig. 5 show the values for determined using Eq.(3) with Eq.(2) for . The systematic decrease in results from the narrower transverse profile of Eq.(2) for a particular value. Since the shifts are approximately equal on a logarithmic scale this result does not modify any of the power law relationships discussed in Sec. IV.
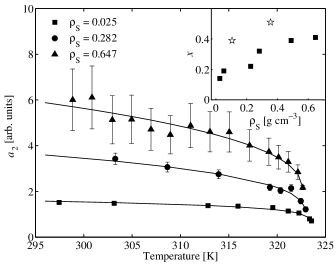
The corresponding temperature dependence of the amplitude of the random-field term, , is shown in Fig. 6 for three samples. The temperature dependence is consistent with the random field fluctuations increasingly dominating the scattering at low temperatures. In Sec. IV we will discuss the difference between the behaviors of and . In contrast to the correlation length behavior, the growth of this amplitude parameter becomes increasingly more gradual as increases. As with N-SmA transitions in aerosil gels Park , can be compared to an order parameter squared for the pseudotransition. The lines in Fig. 6 are the results of fits with the form . We emphasize that this form, which is normally used at a second-order transition with , is used here to provide a strictly phenomenological description of the data. The inset in Fig. 6 shows the values, and both they and the resulting pseudotransition temperatures, , are presented in Table 1. Although there is substantial scatter, the values indicate that is growing more gradually with increasing .
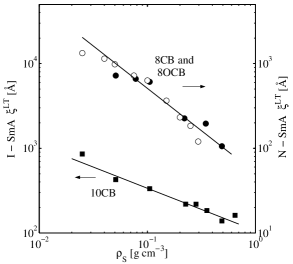
Figure 7 shows a log-log plot of the variation of the smectic domain size with the gel density, . The smectic domain size is quantified by an isotropic correlation length and the low-temperature average of this quantity is shown. The line through the 10CB-aerosil data corresponds to . Also plotted in Fig. 7 are results for 8CB-aerosil Aerosil_X and 8OCB-aerosil Clegg1 samples, for which . This contrast will be discussed in Sec. IV.
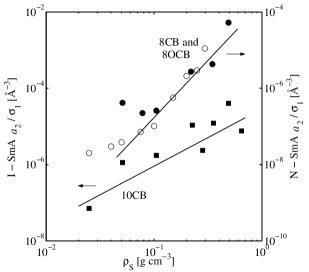
Figure 8 is a log-log plot of versus the disorder strength as represented by . This ratio gives the strength of the random-field contribution to the scattering and is independent of x-ray intensity normalization. Equivalent values are plotted for 8CB-aerosil Aerosil_X and 8OCB-aerosil Clegg1 samples. While the scatter is rather large, the results are consistent with power law behavior with for N-SmA and for the I-SmA. The low temperature values of and are included in Table 1. These are the mean values below K.
IV Discussion and Conclusions
Our results show that an aerosil gel reduces the SmA state to short-range order with random-field characteristics. At first sight, the temperature dependencies in Fig. 5 and 6 are a little surprising. The behavior of the correlation length, , suggests a first-order transition for all while the random-field amplitude, , suggests an increasingly gradual transition with increasing . For pure 10CB the pretransitional fluctuations are very weak and short range, Fig. 1. While the correlation lengths are short the liquid crystal is unlikely to be strongly perturbed by the aerosil gel environment. The perturbation will only become effective when the correlation length grows to length scales comparable with the distance between gel strands. Hence the correlation length grows quickly until the disorder becomes apparent. As increases and decreases, the order parameter behavior changes from rising rapidly at low disorder to developing gradually for high gel densities. The values inset to Fig. 6 are consistent with a gradual crossover from strongly first order to tricritical with increasing aerosil density. As shown in Table 1 the pseudotransition temperature, , varies little with for 10CB-aerosil. This suggests that local variations in are unlikely to lead to two-phase coexistence for this material. Hence the transition is not observed to be substantially smeared. The correlation length, , is characterizing short-range SmA domains within a predominantly SmA sample.
Here we are interpreting our results as if two-phase coexistence over a range of temperatures were not an important issue. This is because of the discontinuous behavior of at . By contrast, Bellini and coworkers Aerogel_IA interpreted their x-ray results on an 10CB-aerogel sample in terms of coexisting phases - indeed they observed coexistence via optical microscopy. The 10CB-aerogel sample they studied had and Å, roughly comparable with our highest aerosil sample. The temperature dependence of the peak intensity and correlation lengths are similar. One important and unusual feature of a fluctuation driven first order transition is that the disordered phase remains metastable at all temperatures Brazovskii ; F_and_B . It may well be the case that this leads to the observed coexistence. This phenomena is also true of the bulk material and it is unlikely to have given rise to the change in with that we have presented. The ratio of the volume of individual ordered domains to the volume of the complete SmA region is roughly 1:125000 and hence it is no surprise that the remaining I phase plays little role in determining and only a very small role in the temperature dependence of the intensity.
The observed trend in (Fig. 6) together with previous results on other cyanobiphenyls Aerosil_Cp ; Park ; Clegg1 suggests that the disorder introduces a systematic change in transition properties. For 8CB-aerosil Aerosil_Cp ; Park and other N-SmA transitions the aerosils change the transition characteristics away from an anisotropic critical point and toward 3D-XY behavior. The liquid crystal begins to behave as though the N order parameter is becoming increasingly saturated. Here 10CB-aerosil appears to move toward tricritical properties () as aerosil is added. For the isotropic - nematic - smectic-A phase diagram this change is also equivalent to a shift toward the regime where the N phase is stable. For 8CB-aerosil and 10CB-aerosil the disorder has some effects which are equivalent to shortening the length of the molecule.
Up to this point the response of the I-SmA transition to the aerosil gel is very similar to that of the N-SmA transition in aerosil gels Park ; Clegg1 . However, Figs. 7 and 8 show that there are systematic differences in the dependence for and associated with these two transitions. In the case of N-SmA, it was argued that , the mass of aerosil divided by the volume of liquid crystal, corresponds to the variance of the random field Aerosil_X ; Germano2 . The dependence of and on the random field variance has been determined by Aharony and Pytte A_and_P ; Germano2
| (4) |
| (5) |
where is the lower marginal dimensionality in the presence of random fields. For transitions which break a continuous symmetry, random fields are found to shift the lower marginal dimensionality to two higher dimensions. For experimentally achievable resolutions the N-SmA transition has 3D-XY characteristics, hence . This is in full agreement with results for 8CB-aerosil Aerosil_X and 8OCB-aerosil Clegg1 as shown in Figs. 7 and 8. These log-log plots strongly suggest that for 10CB-aerosil. Two-phase coexistence on the scale of the individual ordered domains is predicted to give rise to more abrupt domain walls than occur within an single-phase sample I_and_W . By the Imry-Ma argument I_and_M this would tend to reduce below 4. This is the opposite trend to our observations.
The observed appears consistent with the absence of the orientationally ordered N phase. The formation of SmA order in 10CB gives rise to nematic order and hence the director is constrained to lie along the layer normal. Director fluctuations no longer influence the range of smectic correlations. As a result the line shape has the form anticipated for the Landau-Peierls instability Eq.(2) albeit with finite-range order. This is consistent with the use of Eq.(2) as the thermal structure factor for Eq.(3) and its square as the random-field term. The lower marginal dimensionality is general for a transition from a uniform phase to one with translational order in a single direction. Golubović and Kulić G_and_K have made a theoretical analysis of a similar random-field problem. They studied a system with a continuous set of energy minima in q-space, having the form of a ring as opposed to the sphere for the I-SmA transition. Following Imry and Ma I_and_M they determined the dimensionalities for which the correlation function for transverse fluctuations of the order parameter would diverge. The lower marginal dimensionality depends on how the inverse susceptibility varies with the wave vector. For the XY model the inverse susceptibility varies quadratically with the wave vector components I_and_M . For a ring of energy minima the inverse susceptibility varies quartically with one of the wave vector components and quadratically with the others G_and_K . For a sphere of energy minima the inverse susceptibility varies quartically with two of the components and quadratically with the others. For the correlation function in the presence of quenched random fields diverges and in these cases respectively I_and_M ; G_and_K .
The series of studies on 8CB-aerosil Aerosil_Cp ; Park ; Aerosil_X ; Germano2 , 8OCB-aerosil Clegg1 and 10CB-aerosil samples provide a detailed picture of the effect of quenched random fields on the formation of the SmA phase. The first two examples relate to the case where an orientationally ordered (N) phase intervenes between the I and the SmA while the results presented here relate to the direct transition from I to SmA. The interaction between nematic fluctuations away from the smectic layer normal and the SmA order results in transverse smectic correlations which die out with . Our results suggest that, at the I-SmA transition, the molecules are constrained to be perpendicular to the layers and hence the SmA correlations die out with . There is a concomitant change in the lower marginal dimensionality. We have presented high resolution x-ray diffraction results for 10CB-aerosil samples with a range of gel densities. We have shown that an aerosil gel perturbs the I-SmA transition as though it were a random field pinning the phase of the density wave. The transition remains first order for all gel densities studied while the line shape and correlation length evolve systematically. The line shape analysis reveals reasonable agreement with a Landau-Peierls system with quenched random fields. It would be of very great interest to study the effect of aerosils at the tricritical point close to the boundary between N-SmA and I-SmA regimes.
V Acknowledgments
Funding in Toronto was provided by the Natural Science and Engineering Research Council. The National Synchrotron Light Source, Brookhaven National Laboratory, is supported by the US Department of Energy under Contract No. DE-AC02-98CH10886.
References
- (1) R.E. Peierls, Helv. Phys. Acta Suppl. 7, 81 (1934).
- (2) L.D. Landau and E.M. Liftshitz, Statistical Physics, 2nd ed. (Pergamon Press, New York, 1980).
- (3) C.W. Garland and G. Nounesis, Phys. Rev. E 49, 2964 (1994) and references cited therein.
- (4) D.R. Nelson and J. Toner, Phys. Rev. B 24, 363 (1981) and references cited therein.
- (5) L. Wu, B. Zhou, C.W. Garland, T. Bellini, and D.W. Schaefer, Phys. Rev. E 51, 2157 (1995).
- (6) G.S. Iannacchione, C.W. Garland, J.T. Mang, and T.P. Rieker, Phys. Rev. E 58, 5966 (1998).
- (7) H. Zeng, B. Zalar, G.S. Iannacchione, and D. Finotello, Phys. Rev. E 60, 5607 (1999).
- (8) T. Jin and D. Finotello, Phys. Rev. Lett. 86, 818 (2001).
- (9) T. Bellini, L. Radzihovsky, J. Toner, and N.A. Clark, Science 294, 1074 (2001).
- (10) R.L. Leheny, S. Park, R.J. Birgeneau, J.-L. Gallani, C.W. Garland, and G.S. Iannacchione, Phys. Rev. E 67, 011708 (2003).
- (11) T. Bellini, N.A. Clark, and D.R. Link, J. Phys.: Condens. Matter 15, S175 (2003).
- (12) P.G. de Gennes and J. Prost, The Physics of Liquid Crystals, 2nd ed. (Oxford University Press, New York, 1993).
- (13) S.A. Brazovskii, Sov. Phys. JETP 41, 85 (1975).
- (14) M.A. Anisimov, Critical Phenomena in Liquids and Liquid Crystals (Gordon and Breach, Philadelphia, 1991).
- (15) H. Marynissen, J. Thoen, and W. Van Dael, Mol. Cryst. Liq. Cryst., 97, 149 (1983).
- (16) The I-SmA first-order latent heat for 10CB is J mol-1 and the integrated area of the pretransitional wings above and below TIA is only J mol-1. J. Thoen (private communication).
- (17) A. Gohin, C. Destrade, H. Gasparoux, and J. Prost, J. Phys. (France), 44, 427 (1983).
- (18) J. Thoen, H. Marynissen, and W. Van Dael, Phys. Rev. Lett. 52, 204 (1984).
- (19) G.S. Iannacchione, S. Park, C.W. Garland, R.J. Birgeneau, and R.L. Leheny, Phys. Rev. E 67, 011709 (2003).
- (20) P.S. Clegg, C. Stock, R.J. Birgeneau, C.W. Garland, A. Roshi, and G.S. Iannacchione, Phys. Rev. E 67, 021703 (2003).
- (21) Y. Imry and S.-K. Ma, Phys. Rev. Lett. 35, 1399 (1975).
- (22) Y. Imry and M. Wortis, Phys. Rev. B 19, 3580 (1979).
- (23) B.M. Ocko, R.J. Birgeneau, J.D. Litster, and M.E. Neubert, Phys. Rev. Lett. 52, 208 (1984).
- (24) J. Als-Nielsen, J.D. Litster, R.J. Birgeneau, M. Kaplan, C.R. Safinya, A. Lindegaard-Andersen, and S. Mathiesen, Phys. Rev. B 22, 312 (1980).
- (25) J.D. Litster, R.J. Birgeneau, M. Kaplan, C.R. Safinya, and J. Als-Nielsen, in Ordering in Strongly Fluctuating Condensed Matter Systems, edited by T. Riste (NATO ASI, Volume 50, 1979).
- (26) A. Caillé, C. R. Acad. Sci. Ser. B 274, 891 (1972).
- (27) H.J. Coles and C. Strazielle, Mol. Cryst. Liq. Cryst. 49, 259 (1979).
- (28) Degussa Corp., Silica Devision, 65 Challenger Road, Ridgefield Park, NY 07660.
- (29) S. Park, R.L. Leheny, R.J. Birgeneau, J.-L.Gallani, C.W. Garland, and G.S. Iannacchione, Phys. Rev. E 65, 050703(R) (2002).
- (30) BDH, Product Information (1986).
- (31) P.S. Clegg, R.J. Birgeneau, S. Park, C.W. Garland, G.S. Iannacchione, R.L. Leheny, and M.E. Neubert, Phys. Rev. E 68, 031706 (2003).
- (32) Recent studies by Leheny and coworkers show that, for anisotropic 8CB-aerosil and -aerosil gels, the relationships and change compared to those for the pure liquid crystal materials. The same type of variation, if it were to occur here, would give rise to very subtle changes in parameter values.
- (33) B.M. Ocko, Ph.D. thesis, Massachusetts Institute of Technology, 1984 (unpublished).
- (34) G.H. Fredrickson and K. Binder, J. Chem. Phys. 91, 7265 (1989).
- (35) A. Aharony and E. Pytte, Phys. Rev. B, 27, 5872 (1983).
- (36) L. Golubović and M. Kulić, Phys. Rev. B 37, 7582 (1988).