Structure of crystals grown by CVT
Abstract
Single crystals of were grown by the chemical vapour phase transport (CVT) technique. Through X-rays powder diffraction patterns and Laue diagrams of single crystals we studied the transformation from the layered rhombohedral structure of to the tetragonal structure of . On the side, we observe single-phase, solid solution samples for and , as is the case for the side with and . For the intermediate concentrations , and we observe our samples to be two-phase mixtures.
pacs:
61.12.Ld, 71.20.Nr, 81.15.Kk1 Introduction
While much is known about II–VI diluted magnetic semiconductors (DMS) containing manganese[1], the structurally and magnetically more complex ternary and quaternary systems have recently begun to be studied[2], in the expectation of exploring and manipulating the interactions between the electronic, magnetic and structural degrees of freedom. An example is cation disorder, which can be studied by its effect on the magnetic properties[3, 4]. Spin-glass behaviour was observed in [5] and in [6], end-point of the series we investigate here. The low concentration side of the series is structurally similar to the II-VI DMS, in which extensive investigation of the exchange interactions between ions has been performed[7]. To extend these investigations to , an important first question is for what substitution concentrations it is possible to obtain homogeneous solid solutions, since in this series the two endpoint compounds are in different crystal systems.
The structures of the ternary compounds of the family (II: bivalent metal, III: trivalent metal and VI: chalcogen atom) are found in three major types: a cubic structure (spinel), a tetragonal defective zinc blende structure and a rhombohedral structure [8]. The latter two structures are realized by the end-points of the series.
crystallizes in a tetragonal cell of space group with parameters and . This structure is a defective chalcopyrite with the metal atoms randomly distributed within the cationic sub-lattice[9, 10]. exhibits a rhombohedral structure with space group and lattice constants and . In this layered structure, the unit cell consists of three van der Waals coupled slabs, each slab consisting of four layers in the sequence . Between these layers there are octahedral and tetrahedral sites, which are again thought to be randomly filled by the and atoms[11, 12].
In this paper we report the growth of single crystals as well as the structural characterization of the series. We used X-ray techniques to study the transformation from the tetragonal structure of to the rhombohedral structure of .
2 Experimental
2.1 Sample preparation
Single crystals of with nominal concentrations were prepared by a vapour phase chemical transport technique in an evacuated and sealed quartz tube of length and diameter. The best single crystals were obtained using for high concentration compounds ()[12] and for low concentration ()[13, 14] as transporting agents in the reaction. About of ( ) was added into the ampoules together with of reactants. The starting materials for the growth were polycrystalline samples prepared in a vertical furnace at .
The transport reaction was carried out in a two temperature zone furnace in temperature gradients between and for and between and for . The temperatures were ramped up at per day. The reaction periods were two or three days, after which the temperature was lowered during a period of about five days. The resulting crystals were layered, had black and bright faces and were very flexible. Their dimensions were up to , with thicknesses between and .
The resulting concentrations, , were obtained from the Curie constant, extracted from high temperature magnetic susceptibility measurements. Their precision was around 5%, but the method assumes stoichiometric amounts of the other elements. Additional composition analysis of the crystals was carried out with a Shimadzu EDX-900 energy dispersive X-Ray fluorescence spectrometer. The assumed stoichiometry and the concentrations obtained from magnetic measurements were confirmed within 10%.
2.2 X-Ray measurements
X-Ray Powder Diffraction (XRPD) patterns of the powdered samples were recorded using a Rigaku powder diffractometer utilizing -filtered - radiation ( , ) in step scanning mode (). Data collection was done for between and degrees.
Single crystal Laue diagrams were registered using radiation ( , ), in transmission mode, recorded on an image plate ( ) with imaging distance of from the crystal. The exposition time was minutes.
3 Results and discussion
3.1 XRPD profiles
Figure 1 shows the experimental XRPD profiles for all the samples studied. Peaks for the pure and samples, as well as for the with and samples could be indexed assuming the expected crystal structures described in the introduction. For the intermediate concentration samples, peaks from both structures could be discerned, from which we infer a two-phase mixture. In what follows, we will refer to the structure as the “rhombohedral” phase, and the structure as the “tetragonal” phase.
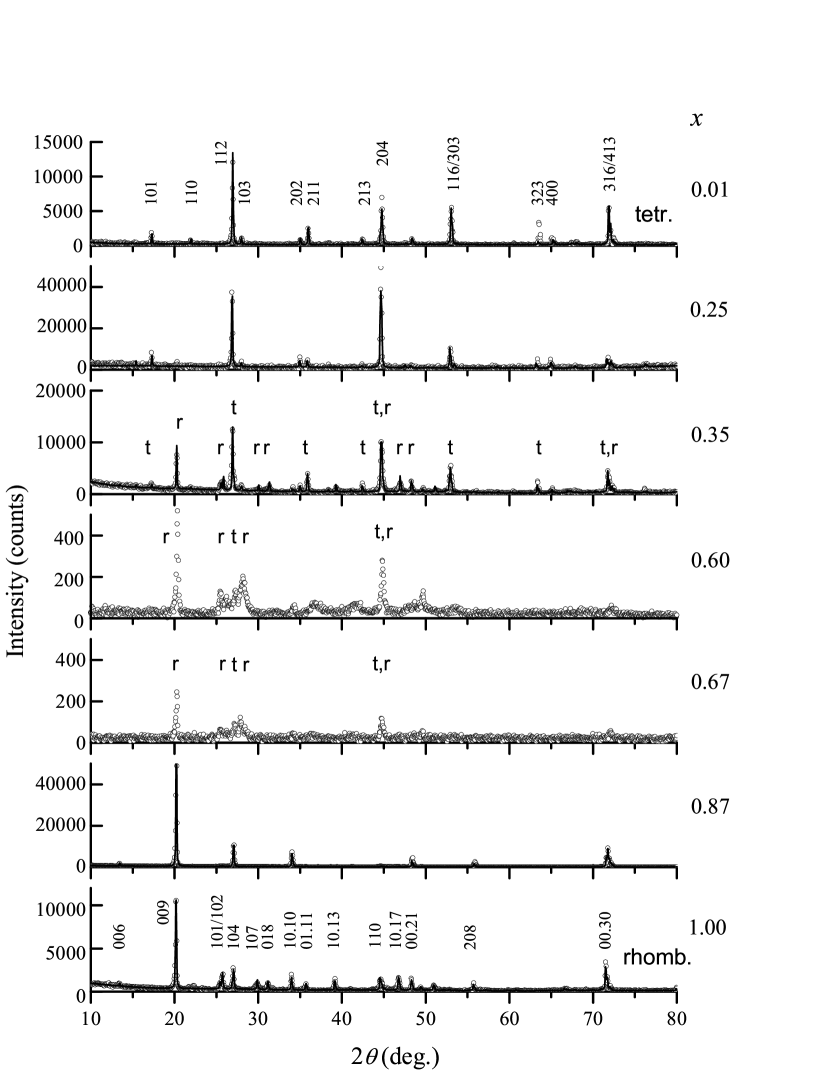
Starting from (), a substitution of 13% of the ions by ions results in the disappearance of reflections from some crystallographic directions, while only the strongest reflections are observed. Assuming the rhombohedral structure is not completely destroyed, the surviving reflections are mostly due to the hexagonal planes, perpendicular to the -direction of the unit cell. Since the Laue-diagram (see below) still indicates a rhombohedral symmetry, we believe that at this concentration we can still speak of a solid solution, albeit with a decrease of the long range order in the structure.
The substitution with leads to an even more drastic reduction of the number and intensities of the peaks, and to a broadening of the profiles. This observation indicates that, at this concentration, the presence of zinc affects the crystallization of the compound even more. This is the least crystalline of the samples we have investigated. Zinc substituting in the rhombohedral phase causes strains in the crystal network, which can lead to broaden reflections. Furthermore, one observes that signs of the presence of a tetragonal phase begin to appear. In Figure 1, the peaks corresponding to the tetragonal and rhombohedral phases are labelled, respectively, “t” and “r” above each observed reflection. We suggest that in this sample the concentration has reached its limit of solubility in the rhombohedral phase, and that the tetragonal phase begins to segregate.
However, the sample becomes more crystalline, as one can verify by the narrower peaks and their higher intensities. More reflections due to the tetragonal phase begin to emerge, and we now have clearly a two-phase system. This process is continued with the sample, where one can notice the presence of narrow and intense reflections corresponding to both the rhombohedral and the tetragonal phases. This sample is more crystalline than that with , but now, one can infer the segregation of the rhombohedral phase in a predominantly tetragonal phase, since the sample is richer in atoms. When the concentration increases to (), only the tetragonal phase is observed in the diffraction profiles. One can suppose that the atoms are in solid solution within the tetragonal phase. Finally, the crystal rich in zinc presents all the peaks expected for the compound [8].
3.2 Lattice parameters
The XRPD patterns allowed the determination of the lattice parameters. They were determined using single reflection peaks, when possible, and pairs of peaks identified for each sample[15]. The averages and error bars were calculated. The results are shown in Table 1, together with literature data for comparison.
-
crystalline phase tetragonal rhombohedral x (%) (Å) (Å) (Å) (Å) (standard)∗ (standard)∗∗
∗(, ICSD collection code 256470)
∗∗(, ICSD collection code 69696)

For the samples with an average concentration , which contain the rhombohedral phase, the parameter does not change considering the error bars. On the other hand, the parameter decreases with the decrease of concentration down to (See Figure 2). The decrease of the parameter can be associated with the substitution of atoms in the rhombohedral structure by atoms, since the ionic radius of zinc is smaller than that of manganese. For the even higher dilution , the parameter increases. We interpret this fact as due to the segregation of the more stable tetragonal phase, leaving a smaller amount of atoms to go into the rhombohedral phase. The cell parameters obtained for the tetragonal phase for ranging from to are practically constant considering the uncertainties.
The XRPD profiles were compared with Rietveld simulations using the program PowderCell v2.4 [16]. In the simulations the previously obtained lattice parameters were introduced as constants. The simulation procedure was carried out considering the crystallites in the shape of plates and preferential directions and , respectively, for the tetragonal and rhombohedral phases. The results are shown in Figure 1 as continuous lines over the experimental data points. The results are in good agreement with the experimental data, indicating the consistency of the interpretation.
3.3 Laue Patterns
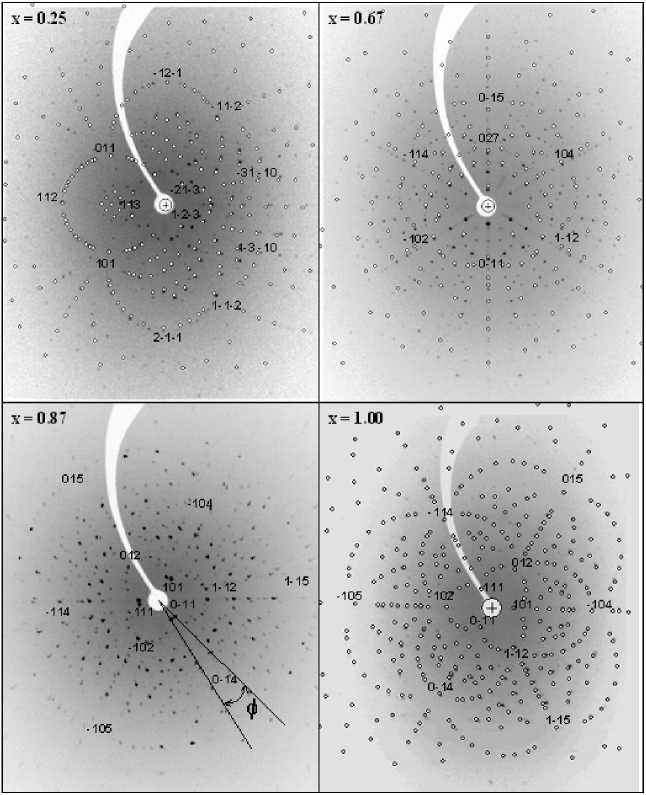
To further evaluate the phase transformation and the crystal quality we measured Laue diagrams for the samples. It was possible to collect the Laue patterns of the samples with and , which sizes were bigger than the cross-section of the X-ray beam. The images were treated using OrientExpress 3.3[17]. The lattice parameters given in Table 1 were introduced in the data input files for the simulations. The method used, based on the indexing of a small set of selected reflections, proposes one or a small number of solutions. The program computes and displays the corresponding simulated Laue patterns (all reflections) or set of patterns. The best solution is easily and unambiguously obtained through the visual comparison of the experimental pattern with the set of simulated ones. Once the correct solution is found, the program makes it possible to compute the rotations which, applied to the sample holder axes, will set the crystal to any desired new orientation. The experimental images are displayed in Figure 3. For comparison, the simulated Laue patterns and the indexes of some reflecting planes are superposed over each image.
The sample () presents the rhombohedral structure and the data indicate that the crystal was grown towards the -axis, the preferential direction observed by XRPD. The good agreement between the experimental and the simulated Laue patterns points to a good crystal quality.
Consistent with our interpretation of the XRPD pattern, the sample with also exhibits the rhombohedral structure. However, this sample presents double reflections, which are rotated by around the beam direction. This fact can be associated with rotated planes (around the -axis), probably caused by distortions induced by zinc atoms substituting the manganese atoms in the structure.
The Laue diagram of the sample with again shows the symmetry expected for the rhombohedral phase and confirms the interpretation of the XRPD data. However, the observed Laue pattern cannot be reproduced by using a single orientation of the crystal. For the displayed simulated pattern, the -axis was considered as the direction of the X-ray beam. The experimental pattern can be simulated as the superposition of several crystals, each with a different orientation for the -axis. The relative tilting of different crystals was up to about . This observation points to a distortion of the rhombohedral crystal structure along this axis in agreement with the line broadening observed by XRPD[18, 19]. Simulations considering the presence of the tetragonal phase (as detected in the XRPD spectrum) were made, but no signs of such a phase were seen in the experimental Laue image. Apparently the minority tetragonal phase segregates in a rhombohedral matrix, in the form of small crystallites. They are not oriented coherently enough to form a Laue image.
For the sample with the Laue pattern shows only the tetragonal structure and the simulation indicates that the crystal grew along the crystallographic direction. Accordingly, the XRPD presents a more intense peak for this direction. The crystal plane was oriented perpendicular to the X-ray beam to obtain the Laue diagram for this sample.
4 Conclusions
X-ray diffraction measurements were performed on CVT grown crystals of , with ranging from to . The results indicate that the crystals present a purely rhombohedral phase for and a purely tetragonal phase for . For the samples with between and , a mixture of rhombohedral and tetragonal phases was observed. These results represent approximate limits on the range of concentrations for which single phase solid solutions can be grown. Furthermore, substitution of even small amounts of () or () leads to a distortion of the original structures and degraded crystallinity.
References
References
- [1] Dietl T 1994 Handbook on Semiconductors vol 3b ed T S Moss (Amsterdam: North-Holland) p 1251
- [2] Nikiforov K G 1999 Progr. Crystal Growth and Charact. 39 1
- [3] Woolley J C et al1995 J. Magn. Magn. Mater. 150 353
- [4] Morón M C and Hull S 2001 Phys. Rev. B 64 220402
- [5] Goya G F and Sagredo V 2001 Phys. Rev. B 64 235208
- [6] Mantilla J C et al2004 J. Magn. Magn. Mater. 272-276P2 1308
- [7] Shapira Y and Bindilatti V 2002 J. Appl. Phys. 92 4155
- [8] Fiorani D et al1983 Solid State Commun. 48 865
- [9] Gastaldi L et al1987 J. Solid State Chem. 66 251
- [10] Marsh R E and Robinson W R 1988 J. Solid State Chem. 73 591
- [11] Range K-J et al1991 Z. Naturforsch. B 46 1122
- [12] Döll G et al1990 J. Cryst. Growth 104 593
- [13] Sagredo V et al1998 Inst. Phys. Conf. Ser. 152 861
- [14] Schäfer H, 1964 Chemical Transport Reactions Academic Press (London)
- [15] J S Kasper and K Lonsdale, editors 1972 International Tables for X-Ray Crystallography vol II - Mathematical Tables (Birmingham, England: The Kynoch Press) p 225
- [16] Kraus W and Nolze G 1998 Powder Diffr. 13 256
- [17] Laugier J and Bochu B OrientExpress (http://www.inpg.fr/LMGP)
- [18] Warren B E and Averbach B L 1950 J. Appl. Phys. 21 595
- [19] Harrison J W 1965 Acta Cryst. 20 390