Absolute values of the London penetration depth in YBa2Cu3O6+y measured by zero field ESR spectroscopy on Gd doped single crystals
Abstract
Zero-field electron spin resonance (ESR) of dilute Gd ions substituted for Y in the cuprate superconductor YBa2Cu3O6+y is used as a novel technique for measuring the absolute value of the low temperature magnetic penetration depth . The Gd ESR spectrum of samples with substitution was obtained with a broadband microwave technique that measures power absorption bolometrically from 0.5 GHz to 21 GHz. This ESR spectrum is determined by the crystal field that lifts the level degeneracy of the spin Gd3+ ion and details of this spectrum provide information concerning oxygen ordering in the samples. The magnetic penetration depth is obtained by relating the number of Gd ions exposed to the microwave magnetic field to the frequency-integrated intensity of the observed ESR transitions. This technique has allowed us to determine precise values of for screening currents flowing in the three crystallographic orientations (, and ) in samples of GdxY1-xBa2Cu3O6+y of three different oxygen contents ( K), ( K) and ( K). The in-plane values are found to depart substantially from the widely reported relation .
I Introduction
The magnetic penetration depth figures prominently in many aspects of superconductivity. It is the length scale over which an external magnetic field is screened by a superconductor in the Meissner state, it sets the size of vortices in the mixed state, and it is a controlling factor in many other properties such as microwave and far infrared absorption. The fundamental importance of the penetration depth is that it provides a rather direct measure of the superfluid phase stiffness , or what is often referred to as superfluid density , which can be a tensor quantity due to effects such as an anisotropic effective mass . In the cuprates, the dependence of on temperature and hole-doping have provided major pieces of the cuprate puzzle. Microwave measurements of at low revealed a linear dependence providing some of the first key evidence of the presence of line nodes in the superconducting gap in the cupratesWalter and the temperature dependence of near suggested that the transition is governed by 3DXY critical fluctuations.Saeid3dxy Evidence that the low temperature value of the phase stiffness depends linearly on , has been obtained from muon spin relaxation measurements of .Uemura ; Sonier1
Accurate and precise measurements of the absolute value of are particularly important for understanding superconductivity in the cuprates, and are critical for broad studies of doping dependence. Having an absolute value of is also crucial in the interpretation of other experiments that involve superfluid screening, with examples including the microwave conductivity, the lower critical field , and the conversion of measurements of to the temperature dependent superfluid density . However, the absolute value of has proven to be particularly difficult to measure. A wide variety of techniques exist for doing so, but each has important drawbacks that must be acknowledged. One class of techniques takes place in the mixed state, probing the length scale over which fields decay away from a magnetic vortex.Sonier1 Muon spin relaxation () falls into this class and suffers from the difficulty that the screening length scale obtained from a mixed state measurement in relatively high fields can differ from the penetration depth in the Meissner state because of non-linear and non-local effects.Sonier1 Vortex state measurements are also unable to directly resolve the anisotropy in in orthorhombic materials because the screening currents circulate around a vortex. A second class of techniques measures magnetic flux exclusion from a sample in the Meissner state, essentially by measuring the magnetic susceptibility at DC, radio or microwave frequencies.Krusin ; Carrington ; Walter These can precisely determine the temperature dependence relative to a base temperature . However, a measurement of the absolute value amounts to a comparison between the physical volume of the sample and a susceptibility determination of the volume that is field-free, the difference being the small volume at the surface that is penetrated by the field. Such a measurement is most sensitive if the ratio of surface area to volume is large, which can be achieved by working with powders. However, difficulties in aligning powders and modelling the shape and size distribution of grains introduce substantial uncertainties in the absolute value of .Panagopoulos For a macroscopic, high quality crystal of a cuprate superconductor, it is nearly impossible to measure sample dimensions precisely enough to achieve an absolute measurement of this way, except in geometries dominated by the very large values of for screening currents running in the -direction.
A very direct measurement of the penetration depth has been achieved by measuring the transmission of low frequency fields through very thin films using mutual inductance techniques. While this is a very sensitive method, its chief drawbacks are the need to work with films and the difficulty of measuring anisotropy.Lemberger1 Techniques that can resolve the anisotropy include far infrared and optical measurements that determine the inductive response of the superfluid at high frequencies.Homes ; Basov Such measurements are difficult because of their need for spectra over a very wide frequency range in order to perform Kramers-Krönig transforms and are also susceptible to error because the measured response can also include screening by uncondensed carriers in addition to the superfluid. However, this approach can be used to determine the anisotropy of simply by polarizing the light and measuring optical properties along all of the principal axes. Such infrared determinations of the absolute value of at low temperature have been combined with microwave measurements of to produce the anisotropic in YBa2Cu3O6+y at y=0.60 and 0.95,BonnCzech but it would be far preferable to have a more direct microwave measurement that gives the absolute value of , measured on the same sample as that used to determine the temperature dependence.
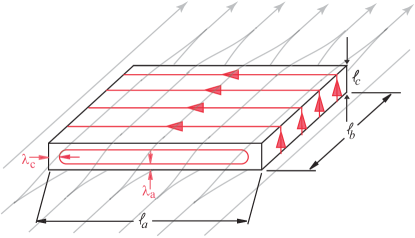
This paper describes a microwave technique that directly measures the small volume near the surface that is field-penetrated in the Meissner state, rather than inferring from a measurement of the very large volume that is field-free (see Fig. 1). We use this technique here to measure the absolute value of for all three principal axes in YBa2Cu3O6+y. The key to the method is to embed a randomly distributed low concentration of magnetic moments in the superconductor in such a way that they will act as local field probes and yet will minimally affect the transport properties. The magnetic moments will serve as a non-interacting spin system whose electron spin resonance (ESR) spectrum is a sum of one-particle ESR transitions. The energy levels of a single spin are determined by its crystallographic environment, i.e. the charge distribution around the magnetic ion, and the resulting susceptibility is that of a single spin multiplied by the number of spins that participate in the ESR process. If the moments are evenly distributed in the sample, the number of spins that participate in the process is proportional to the fraction of the sample’s volume that is exposed to the field, i.e. the volume within a penetration depth of the surface. In order to count the number of spins exposed, we measure the zero field ESR absorption spectrum with a microwave frequency magnetic field applied perpendicular to the principal spin axis acting as a small perturbation.
In the next section of this paper we describe the samples, the broadband microwave apparatus and the measurements of the apparent microwave surface resistance that ultimately yield values of the penetration depth. The third section describes how the theoretical ESR spectrum was calculated using an effective crystal field Hamiltonian, which is a necessary prerequisite for extracting . In the fourth section we examine the issue of oxygen ordering in the CuO chains of YBa2Cu3O6+y and comment upon the sensitivity of our measurements to this ordering. Finally, we summarize our results and present new values for in all three directions, for three different dopings in the YBa2Cu3O6+y system. These results indicate a substantial departure from , the so-called Uemura scaling.
II Sample Preparation and Experimental Techniques
The objective of this work is to provide accurate measurements of the intrinsic absolute value of the magnetic penetration depth in the limit . It is well-known that impurity doping can have a strong influence on the low energy density of states in a -wave superconductor,hirschfeld-atkinson ; bonnZn and for the present work care must be taken to ensure that the introduction of the spin-probe impurity does not alter . This constrains the Gd concentration x, but conversely we wish to maximize the amplitude of the ESR response, which scales as x. We have found a good compromise at a nominal value of x which results in an easily resolved ESR spectrum and does not significantly alter the intrinsic low temperature properties of the material.
In GdxY1-xBa2Cu3O6+y, the dopant Gd3+ ion substitutes for the Y3+ ion which is sandwiched between the two CuO2 planes in the YBa2Cu3O6+y unit cell that support the bulk of the electronic transport. The energy cost for cross-substitution of the Gd on the Ba site is prohibitive and such cation substitution occurs only for the lighter and larger members of the rare earth series. The ESR spectrum is determined completely by the crystal field environment of the Gd3+ ion and therefore knowing that there is only one site for substitution means that changes in the ESR spectrum from sample-to-sample can only be due to changes of the oxygen order in the CuO chains. Another important feature of substitution on the Y site is that the Gd impurities are expected to be weak (Born) limit quasiparticle scattering centers as was found to be the case for Ca2+ substitution on the same site.BonnCzech Born scatterers have little effect on the superfluid density in the low temperature limit. This is in contrast, for instance, to the case of the non-magnetic impurity Zn2+ which substitutes into the CuO2 plane, and is known to be strongly pair-breaking.
The GdxY1-xBa2Cu3O6+y samples were grown using a self-flux method in BaZrO3 crucibles as described elsewhere.Ruixing The starting materials had at least 99.999 at. % purity with the nominal concentration of Gd ions set by the ratio of oxide precursor substitution Gd2O3:Y2O3. The as-grown platelet single crystals were mechanically detwinned, annealed in flowing oxygen to set the oxygen content, and given a final anneal at lower temperature for oxygen ordering. The annealing parameters have been previously published for the slightly overdoped (nearly full CuO chains, y=0.993)Ruixing and ortho-II ordered (alternating full and empty chains, y=0.52)RuixingII crystals. Other ordered phases at intermediate doping can also be produced with larger chain-ordered superlattices, namely ortho-IIIManca and ortho-VIII.Zimmermann Crystals at these doping levels were produced using procedures very similar to that used to produce the ortho-II samples, however the initial temperatures for setting the oxygen content were different (668 ∘C for ortho-VIII and 609 ∘C for ortho-III) as were the final low temperature annealing temperatures used to establish oxygen ordering in the CuO chain layers (35 ∘C for ortho-VIII (y=0.67) order and 60 ∘C for ortho-III (y=0.77) order).
A critical parameter in our data analysis is the absolute concentration of Gd ions x, which was measured using electron-probe micro-analysis (EPMA). We used a fully-automated CAMECA SX-50 instrument, operated in the wavelength-dispersion mode with the following operating conditions: excitation voltage, 15 kV; beam current, 20 nA; peak count time (240 s for Gd), 20 s; background count-time, 10 s each side of peak (120 s for Gd); spot diameter, 5 m. Data reduction was done using the “PAP” (Z) method.EPMA For the elements considered, the following standards, X-ray lines and crystals were used: Ga3Gd5O12, GdL, LiF; YBa2Cu3O6.95, BaL, PET; YBa2Cu3O6.95, CuK, LiF; YBa2Cu3O6.95, OK, W/Si multilayer dispersion element. For the present study, we found it to be important that each GdxY1-xBa2Cu3O6+y crystal was examined individually. Because the sample must be embedded in epoxy for EPMA, this was done following all microwave measurements. For a nominal Gd concentration of x in the growth flux, the resulting concentration in the crystals was found vary to over the range from x to x. At least 10 locations were measured on each crystal surface as a means of ensuring that the stoichiometry was homogeneous. In all but one sample, the uniformity was within the statistical limitations of the measurement. For one sample it was necessary to examine 54 different locations covering the crystal surface to map out and take account of a small region, approximately 5 of the total surface, having an elevated Gd concentration of x. Measurements on the cut edges of a 100 thick sample confirmed that there was no gradient through the thickness of the sample. If the Gd concentration in the melt were to drift with time during the crystal growth, then a resulting Gd gradient in the crystal would be problematic for the following analysis.
The broadband microwave absorption spectrum (0.5 GHz to 21 GHz) was measured using a novel spectrometer based on a bolometric method of detection, described in detail elsewhere.PatRSI In essence, the single crystal GdxY1-xBa2Cu3O6+y sample is exposed to a spatially uniform microwave magnetic field that is amplitude modulated at low frequency. The corresponding temperature oscillations of the sample are detected synchronously, and absolute calibration of the thermal stage sensitivity allows us to infer the magnitude of the power absorbed by the sample. A critical ingredient of the method is a well-characterized normal-metal reference sample that is mounted on a second thermal stage and placed in a symmetric location in the microwave transmission line. This allows us to monitor the strength of the applied microwave field which varies strongly with frequency due to standing waves in the microwave circuit.
At microwave frequencies in the limit of local electrodynamics,Ahmad the experimentally measurable quantity is the surface impedance Zs which is related to the complex conductivity via
| (1) |
For a superconductor well-below measured at low frequency, the high superfluid density ensures that the response is mainly reactive (i.e. ) and Eq. 1 simplifies to
| (2) | |||||
(The appearance of in both of the above expressions highlights its important role in determining the conductivity from measurements of and .) The power absorption is determined by the surface resistance RZ according to
| (3) |
where is the root-mean-square (rms) magnitude of the uniform, tangential magnetic field at the surface of the sample. At low temperatures, absorption in a superconductor is due to quasiparticles thermally excited from the condensate, and the study of the quasiparticle conductivity spectrum has been the central focus of other recent work.PatPRL ; Ahmad In the present case of magnetic impurities in a superconductor, the imaginary part of the magnetic susceptibility, , provides another mechanism for power absorption. Formally, the magnetic response can be included by a modification of the vacuum permeability in Eq. 1 to include a dimensionless complex susceptibility , written as . For the case of a sufficiently low concentration of magnetic impurities, , and the apparent surface impedance expressions can then be rewritten as
| (4) | |||||
Thus, a frequency scanned measurement of the power absorption will provide an apparent surface resistance with two separate contributions: one from the quasiparticle conductivity and one from the ESR spectrum contained in .
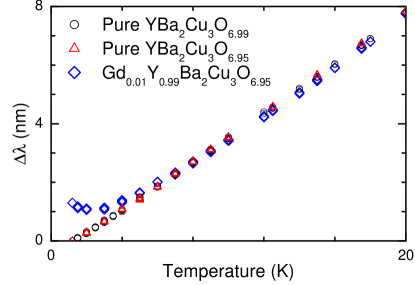
Equation 4 reveals that a measurement of the surface reactance will contain a contribution from in addition to probing . This is evident in the comparison of our measurements of in pure and Gd doped YBa2Cu3O6.99, presented in Fig. 2. In fact, at the outset of this work we considered the possibility of fitting the curvature arising from in a low frequency measurement of as a means of extracting the absolute value of . However, it was decided that this method was not practical as it lacked the necessary sensitivity and also required knowing a priori. A further complication to this approach is that it has been well-established that a variety of paramagnetic impurities can generate a low temperature upturn in a low frequency measurement,prozorov which would produce systematic errors in the extraction of an absolute value of .
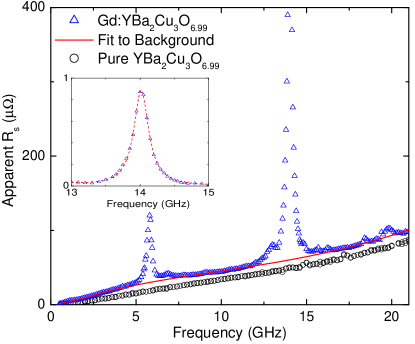
Fortunately, the broadband spectroscopy apparatus provides a means of accessing the ESR spectrum in much greater detail. Figure 3 shows a measurement of R from 0.5 GHz to 21 GHz at 1.3 Kelvin for a Gd0.01Y0.99Ba2Cu3O6.99 sample. The quasiparticle absorption spectrum is known to be a slowly varying, monotonically increasing function of frequency, and the sharp ESR absorption lines ( 0.5 GHz) are superposed. We have shown previously that the low temperature microwave conductivity extracted from measurements of can be interpreted as that of weak-limit quasiparticle scattering from impurities,PatPRL and here we attribute the small changes in the spectrum of Fig. 3 to a slight increase in scattering due to the increased density of out-of-plane defects in the Gd doped samples. In order to separate the ESR contribution from the quasiparticle conductivity, we fit to the smooth background away from the ESR peaks using a second order polynomial, shown as a solid line in Fig. 3. After subtracting the polynomial, the remaining quantity is equal to (from Eq. 4). In the subsequent section, we discuss the calculation of the quantity from the effective spin Hamiltonian. With the theoretical curve for the susceptibility of one Gd spin in hand, we are able to fit to the experimentally determined quantity with an overall multiplicative fit parameter .
YBa2Cu3O6+y single crystals grow naturally as platelets having broad -plane crystal faces and thin -axis dimensions. All of our microwave measurements involve a uniform radio frequency magnetic field applied parallel to the broad face of the crystal in order to minimize the effects of demagnetization, as shown schematically in Fig. 1. It is also known that the crystal -axis is the principal spin axis of the Gd ions, so that the ESR response is maximized in this configuration. The number of Gd spins that are exposed to the microwave field is governed by the effective penetration depth and, for our geometry, will always contain contributions from or and . In the cuprates, the two-dimensionality of the CuO2 planes results in a large anisotropy in the penetration depth: for all doping levels. In practice, this means that despite working with thin crystals having the in-plane dimension , the -axis contribution to can be large. In some cases it was also necessary to account for a small fraction of the crystal which remained twinned (14% at most), introducing the third component of into the measurement. Since is small compared to any crystal dimension, it suffices to use a simple linearized relation for ,
| (5) |
where is the in-plane crystal dimension parallel to the flow of diamagnetic screening currents (the geometry is that of Fig. 1). Each component of can be isolated by combining measurements performed on the same crystal but with its geometry altered in a controlled manner as attained by rotating and cleaving the crystal. This matter is discussed in detail in Appendix A.
III The Crystal Field Hamiltonian
In this section, the way in which the magnetic penetration depth is obtained from our measurements of the ESR absorption spectrum is explained. This amounts to the treatment of a dilute random array of Gd3+ ions, each having an electron spin of , that contribute to the measured quantity . We point out that in this work the small splitting due to the Gd isotopes with non-zero nuclear spin can be ignored.comment The spectrum is a result of the energy level configuration determined by the splitting of the degenerate Gd spin levels by the crystalline field. Because the spin system is dilute, it can be described by a non-interacting single-spin effective crystal field (CF) Hamiltonian. The application of a microwave field, oriented perpendicular to the principal spin axis of the system, is a time dependent perturbation that induces transitions between the spin levels. When the frequency of the applied field is tuned to the splitting between two levels, a maximum in the ESR absorption is observed. The intensity of the transition is found through the application of Fermi’s golden rule for the two levels that define the transition, and , which allows the transition’s contribution to the susceptibility to be written as
| (6) |
In this expression, the eigenstates and correspond to the energies and . The level occupation number is , where is the number of spins per unit volume, is the partition function and is the inverse temperature. The time dependent perturbation induced by the microwave field, , is proportional to the or operator and the matrix element between the two states is , where is the Landé factor and is the Bohr magneton.
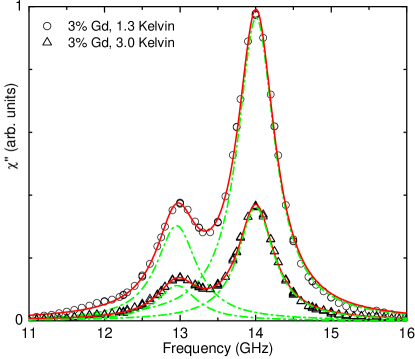
In real materials the ESR transitions are broadened by various relaxation processes such as spin-spin interactions, lattice disorder and spin-lattice interactions. This broadening, however, does not change the overall intensity of the ESR line, but merely replaces the delta function by some line shape function (in our case it is close to Lorentzian) whose integrated intensity is unity. In the initial stages of this work we examined optimally doped (y=0.93) crystals having three different concentrations of Gd ions; x, x, and x. From these measurements, we were able to conclude that the width of the Lorentzian-shaped ESR peaks ( GHz for x%) scaled approximately linearly with the nominal Gd concentration x, but with a substantial x=0 intercept of about 0.30 GHz. Although we did not perform the detailed EPMA analysis to measure x of the nominally 0.5% and 3% samples, it seems clear that at x% there is a dominant contribution to the broadening that is concentration independent. Since a dilute spin-spin interaction is expected to provide a relaxation rate that is linearly proportional to the concentration,AB our results suggest that some other process is responsible for much of the line broadening. The line width was also measured in the optimally doped samples at two different temperatures as shown in Fig. 4. The line widths decrease slightly upon increasing the temperature from 1 K to 3 K, indicating that spin-lattice relaxation is not likely to be the dominant process since typical relaxation mechanisms would be strongly temperature dependent. It remains unclear what the main spin relaxation mechanism responsible for the ESR line width is here. A final point is that no power dependence of the spectra were ever observed verifying that saturation effects were negligible and that the assumption of thermal equilibrium implicit in the Boltzmann factors used in Eq. 6 is well-founded.
For the purpose of extracting , the quantity of interest is the effective number of spins exposed to the field . This requires a knowledge of the energy levels, their population and the corresponding matrix elements. This in turn requires knowing the Hamiltonian of the system. The Gd atom has the electron configuration of and ionization number of three in GdxY1-xBa2Cu3O6+y. This implies that the outer shell of the ion remains exactly half filled (seven electrons in fourteen states) and the system behaves like a spin with no mixing with other multiplets due to Hund’s rule. The construction of an effective Hamiltonian for a spin system is based on the expansion of the crystal field around the magnetic ion in terms of Stevens operators. These are the operator analogues of the spherical harmonics and are functions of , and , given, for example, by Abragam and Bleaney.AB Due to the lattice symmetries and the finite spin of the magnetic ion, the expansion reduces to a finite sum of operators where the are numerical coefficients called the crystal field parameters. The highest order of Stevens operator allowed for a spin of in a crystal field is 6 since the matrix elements of the Stevens operators between two spin states are zero unless . The order is restricted to even values by the required time reversal symmetry of the Hamiltonian. Furthermore, the -plane anisotropy is so small that for most purposes one can assume rotation symmetry about the -axis; orthorhombicity is most significant in the overdoped samples. In the case of tetragonal symmetry, the relevant operators in order of significance are , and . The sixth order terms are difficult to resolve in our measured spectra and we simply adopt those of previous authors.Janossy ; Pekker ; Rockenbauer When the tetragonal ordering is slightly distorted, as will be discussed in the next section, three more Stevens operators can contribute to the Hamiltonian. For the present work, the largest and only significant one of them is .
The spin system discussed herein has four doubly degenerate energy levels with four eigenstates that are roughly the eigenstates of the operator. The three allowed ESR transitions correspond to . Small off-diagonal terms in the Hamiltonian, such as the and , induce small level mixing that allow the otherwise forbidden transitions corresponding to , and to occur, albeit with relatively low intensities. The resulting energy levels for different CF Hamiltonians are shown in Fig. 5.
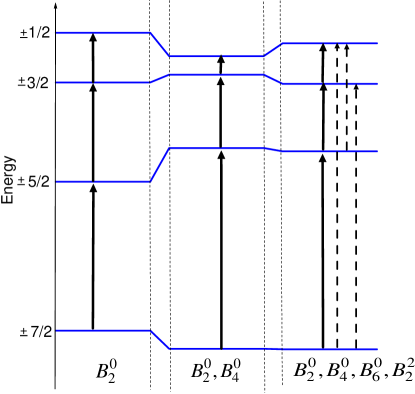
Due to the oxygen ordering in chains, which we discuss in detail in the next section, most samples have more than one inequivalent site for the Gd ions. Therefore, two or three sets of CF parameters are needed to fit the spectrum. Following Jánossy et al.,Janossy ; Pekker ; Rockenbauer we label the spectra corresponding to a particular site by a band index using the notation shown in Fig. 7.
We begin our fitting procedure by first constructing an effective spin Hamiltonian using the measured CF parameters reported by Jánossy et al. Janossy and then adjusting the parameters to best fit our data. We focus on the main transition ( for each band) because it is the strongest and consequently least susceptible to experimental uncertainty. As a final step, a multiplicative factor representing the effective number of spins that have participated in the ESR process is then used to scale the overall amplitude of the model spectrum to match the measured data. This number is the effective penetration depth , combined with the measured Gd concentration x in the crystal.
IV Dependence of ESR spectra on oxygen configuration
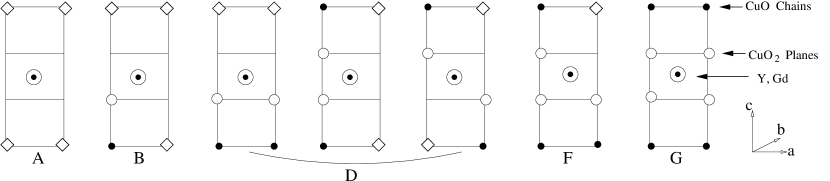
The presence of a chain layer breaks the tetragonal symmetry and the Stevens operator expansion of the foregoing section is then no longer exact. However, the chains are far from the Gd sites and this effect can be treated as a perturbation, leading to line broadening or line splitting. Here we will consider line splitting associated with distinct Gd environments and simply handle the line width as a parameter in a Lorentzian fit. Different types of Gd sites are encountered because hole doping in this system is controlled by manipulating the oxygen content and ordering of the CuOy chains in GdxY1-xBa2Cu3O6+y. The oxygen content is set by annealing in controlled oxygen partial pressure at high temperatures and then the oxygen ions tend to organize into lengths of CuO chain fragments which are able to promote holes to the CuO2 planes.Zaanen The strong tendency to form chain fragments means that there are 7 probable Gd environments corresponding to anything from 0 to 4 nearest neighbor chains. These different crystallographic environments have been identified in ESR experiments on magnetically aligned GdxY1-xBa2Cu3O6+y powdersJanossy ; Rockenbauer ; Pekker and are illustrated in Fig. 7.
The chains also tend to form ordered periodic superlattices consisting of arrangements of full and empty CuOy chains. The structures can be particularly well-ordered for special values of y. In the case of full oxygen doping, the CuO chains are nearly completely full with every Gd ion having four nearest neighbor chains. This results in the simplest of the spectra observed in the five crystals studied. It involves one primary set of CF parameters, denoted the G-band by Jánossey et al., and generates three dominant ESR transitions. A secondary contribution of much lower intensity is also present in these measurements, resulting from a configuration where one of the four chains is missing oxygen, denoted the F-band. In the overdoped sample, the largest transition () of this latter band is barely discernable, but as the oxygen concentration is reduced to optimal doping, the intensity of the F-band builds, as seen in Fig. 7.
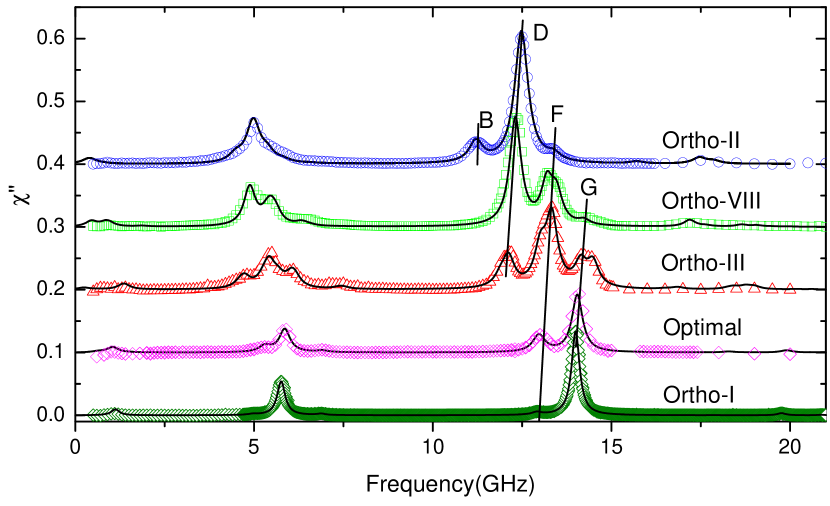
At lower doping, the next best-ordered phase occurs near y , where the chains form an ortho-II structure of alternating full and empty chains.RuixingII Other ordered phases are: ortho-III with FFE (full, full, empty) chains and ortho-VIII with FFEFFEFE chains. In each of these phases there is more than one possible chain configuration around the Gd ions. Having detailed spectra at each doping allows us to identify the different bands and fit each spectrum with a set of crystal field parameters for each band. The fitted spectra are shown in Fig. 7. In each spectrum, the relative intensities of the different bands is a measure of the relative number of Gd ions in each configuration. This information can be used as a measure of the amount of oxygen in the sample:
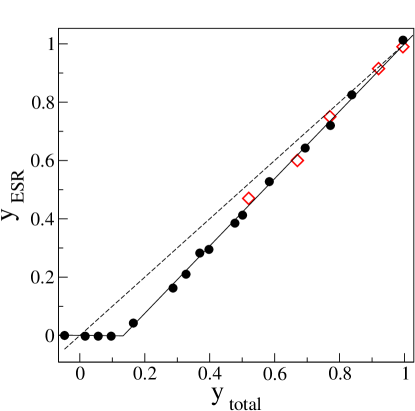
| (7) |
where is the number of full nearest neighbor CuO chains in the band and is the observed relative intensity of the line associated with a particular band. The oxygen content is given by . The ESR measured oxygen content versus the chemically measured content is presented in Fig. 8. Note that the ESR points consistently underestimate the amount of oxygen in the crystals. This is likely due to the inefficiency of isolated oxygens in empty chains in promoting a hole into the CuO2 planes. The above oxygen content analysis assumes maximal length of chains, i.e. all chains are either full or missing with no isolated oxygens or vacancies. Since the Gd ions are likely to be sensing the presence of chains through their influence on the charge distribution on the much nearer CuO2 planes, an isolated oxygen ion hardly affects the crystal field environment since it does not promote a hole into the planes.Zaanen Thus a Gd ion near an isolated oxygen in an otherwise empty chain will experience the crystal field of an empty chain. This will lead to an underestimate of the oxygen content, but will not affect the overall counting of Gd ions.
It is also interesting to note that the ESR analysis provides a good measure of the chain disorder. For example, perfect three dimensional ortho-II ordering should produce only one band, corresponding to two full chains, the D-band. However, our ortho-II spectrum displays two additional bands (the B- and F- bands) resulting from imperfections in the ortho-II ordering.RuixingII These deviations can be interpreted as ortho-II phase boundaries. Our ortho-III and ortho-VIII spectra are consistent with long range ortho-III and ortho-VIII order along the plane but random stacking along the -direction.
V Results
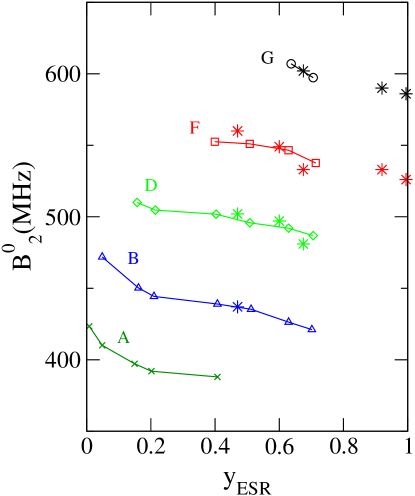
We have performed detailed measurements of the ZF ESR absorption spectrum in high quality samples of Gd0.01Y0.99Ba2Cu3O6+y at five different values of y. As noted above, four of these are chosen to be in ranges with particularly well-ordered CuO chain structures, denoted by the periodicity of their chain superlattices (ortho-I,II,III,VIII). The optimally doped sample, with the maximum attainable of 93 K (y=0.93) is also in the ortho-I phase, but has a substantial number of oxygen vacancies on the chains. The ESR spectrum at each doping was fitted with a spectrum generated by an effective CF Hamiltonian, with initial guesses for the CF parameters taken from Rockenbauer et al.Rockenbauer Subsequently, the CF parameters were adjusted to best describe our measured spectra, and the best fit values are presented in Table 1. The evolution of the dominant CF parameter () as a function of the ESR measured oxygen content is shown in Fig. 9. The values and systematic trends of our fit values compare well to those of the conventional ESR studies on powders.Janossy ; Rockenbauer ; Pekker
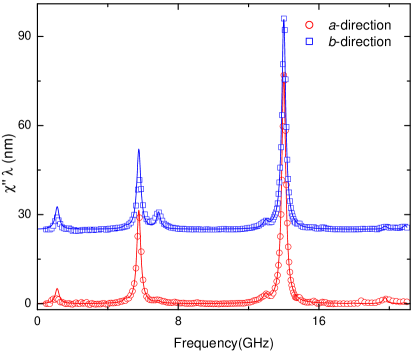
The ESR spectrum is a sensitive probe of the crystallographic structure and the crystal symmetry in particular. This high sensitivity is demonstrated at its best in the spectrum of our overdoped sample. This is the most ordered and most orthorhombic phase, with four full CuO chains around virtually every Gd ion. The lines are very sharp and the main band, G, corresponds to 96% of the total spectral weight. As seen in Fig. 11, the orthorhombicity of the crystal is manifested as an additional line in the spectrum that appears only when the measurement is performed with screening currents flowing along the -direction. The spectra for both directions can be fit with a single set of CF parameters by introducing an orthorhombic term in the CF Hamiltonian. This term is , where is the measured coefficient and . The inclusion of this term allows the otherwise forbidden transitions of only when the magnetic field is applied in the -direction, and reveals the slight orthorhombicity of the crystal (the difference between the and -dimensions of the unit cell is less than 2%).
The measured ortho-III spectrum is indicative of some disorder in the chain structure. First, the substantial amount of spectral weight in the F-band, which corresponds to three full chains, indicates that even if the ordering is perfect in the planes, the stacking along the -direction is disordered, i.e. that the ortho-III structure may shift between adjacent chain layers. Second, we find that each ESR peak is composed of two closely spaced lines that together produce a non-Lorentzian shape. Since the measured ESR oxygen level is consistent with the other crystals (see y in Fig. 8), we are confident in the band identification and do not interpret the minor splitting as a change of chain configuration. The splitting implies a small variation of CF parameters within the same band. This might be the result of inhomogeneity in the oxygen concentration, which is consistent with a measured transition temperature broadening T1 K. However, we do not think that the sample is macroscopically phase separated since the line shapes were not affected by cleaving the sample into smaller pieces.
Our ortho-II spectra suggest fairly good ordering within the chain layers with a somewhat shorter correlation length in the -direction. This is in agreement with X-ray analysis.RuixingII The extraction of in this sample was done by comparing two measurements in the -direction, where the first measurement was done on the whole sample and the second one on two pieces resulting from a cleave along the -direction. The effective penetration depth, was observed to increase by about 210 nm due to the introduction of two more sample -faces, where currents flow along the -direction.
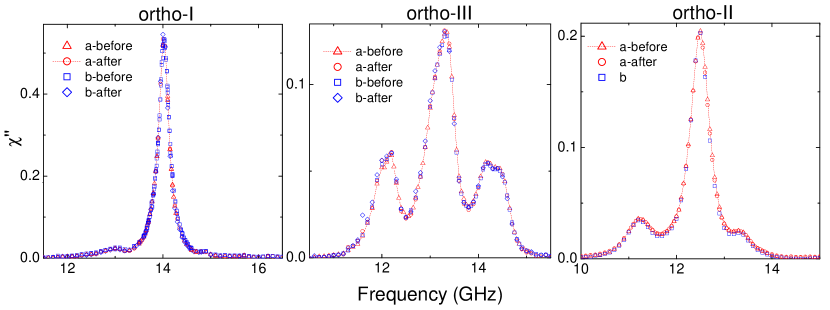
We have obtained enough data in order to reliably extract the absolute values of the penetration depth in all three crystallographic directions for three of the five doping levels studied: fully doped, ortho-II and ortho-III. Our measurements at the remaining two doping levels were made using samples that were not amenable to the cleaving procedure required to extract absolute values of . Our final results for were derived as described in the previous sections with the emphasis on performing enough measurements on the same sample in order to eliminate sample-dependent effects and to overdetermine the values of for error control. The penetration depth results are presented in Table 2. The error estimates account for uncertainties arising from measurements of the sample dimensions, calibration of the microwave absorption experimentPatRSI and the estimation of the ESR fit parameters. Since the extraction of the penetration depth in the three crystallographic directions depends sensitively on the sample’s dimensions, it is important to work with crystals that have smooth parallel well defined faces whose area is easy to measure. This was most easily achieved by choosing a single sample having a nice platelet geometry for each doping. If we restrict our analysis to measurements made on the same crystal where the geometry of the sample can be altered in a controlled fashion by cleaving, we obtain a high degree of internal consistency between different measurements. In all cases we performed an extra measurement that overdetermines the penetration depth values and found agreement ranging from 0.5% to 6%. In the case of the ortho-II doping we measured a second sample having a 30% higher Gd concentration, and the results agreed to within 12% of the first sample. The high reproducibility of our measurements is demonstrated in Fig. 10 where we present data for the same crystal before and after cleaving the sample. Despite changing the aspect ratio of the crystal by approximately 50%, the spectra are identical, modulo the overall multiplicative factor of .
| Sample | Band | Intensity | |||||||
| (Gd%) | (MHz) | (MHz) | (MHz) | (MHz) | (GHz) | (GHz) | (GHz) | ||
| ortho-I | G-band | 96% | -587 (-598) | 26.7 (-) | -3.1 (-3.1) | 12.5 (13.2) | 14.0 | 5.8 | 1.12 |
| F-band | 4% | -526 (-541) | 26.7 (-) | -3.1 (-3.1) | 12.5 (17.2) | 12.9 | 5.0 | 0.9 | |
| optimal | G-band | 75% | -590(-598) | 0 | -3.1 (-3.1) | 12.7 (13.2) | 14.04 | 5.86 | 1.05 |
| F-band | 25% | -533(-541) | 0 | -3.1 (-3.1) | 12.5 (17.2) | 13.02 | 5.2 | ||
| ortho-III | G-band | 21% | -617,-604,-585(-598) | 30 (-) | -3.0 (-3.1) | 12.5 (13.1) | 14.4,14.1 | 6.13,6.03 | 1.4,1.3 |
| F-band | 56% | -533,-517 (-541) | 6.7 (-) | -3.5 (-3.1) | 17.1 (17.2) | 13.3,13.0 | 5.4,5.45 | 0.2,0.3 | |
| D-band | 23% | -481,-475 (-497) | 26.7 (-) | -3.1 (-3.1) | 14.6 (14.7) | 12.1,11.9 | 4.7,4.6 | 0.6 | |
| ortho-VIII | G-band | 2% | -630 (-598) | 1.6 (-) | -2.5 (-3.1) | 9 (13.1) | 14.2 | 6.3 | 1.9 |
| F-band | 36% | -549 (-541) | 1.6 (-) | -3.0 (-3.1) | 12.5 (17.2) | 13.2 | 5.5 | 0.8 | |
| D-band | 62% | -497 (-497) | 1.6 (-) | -3.1 (-3.1) | 12.5 (14.7) | 12.3 | 4.9 | 0.8 | |
| ortho-II | F-band | 4% | -560 (-541) | 5 (-) | -3.1 (-3.1) | 17.2 (17.2) | 13.4 | 5.8 | 0.8 |
| D-band | 81% | -502 (-497) | 5 (-) | -3.2 (-3.1) | 14.7 (14.7) | 12.5 | 5.0 | 0.4 | |
| B-band | 15% | -437 (-445) | 5 (-) | -3.2 (-3.1) | 15.5 (17.2) | 11.2 | 4.5 | 0.2 |
| Crystal Structure | (K) | Oxygen Content | (nm) | (nm) | (nm) | |
|---|---|---|---|---|---|---|
| Ortho-I | 89 | 6.995 | ||||
| Ortho-III | 75 | 6.77 | ||||
| Ortho-II | 56 | 6.52 |
VI discussion
The results presented here have impact in two areas. First, we have provided detailed information about the GdxY1-xBa2Cu3O6+y system, namely the crystal field parameters at the yttrium site and the way in which oxygen orders into CuO chains. We have shown that our crystal field parameters agree very well with those obtained by previous authors using the completely different method of high field ESR on powdered samples. Our results also support the conclusions of the same work which found that isolated oxygens in vacant chains do not influence the CF configuration around the magnetic ion and therefore cannot be distinguished from a vacant chain via ESR spectroscopy. This is in accord with the fact that isolated oxygens do not promote holes from the copper-oxygen planes.Zaanen
The principal result of this work is a set of new values for the penetration depth in all three crystallographic directions for three oxygen-ordered phases of YBa2Cu3O6+y which are summarized in Table II. The -axis penetration depth is large and increases very rapidly with decreasing doping, as observed previously in infrared measurements of by Homes et al.Homes The in-plane measurements are in accord with the results of Sonier et al.Sonier1 ; Sonier2 who performed measurements on mosaics of high-purity, detwinned single crystals at two other oxygen dopings. The muon measurements are unable to directly determine anisotropies, but they compare well with the geometric mean of the -plane values reported here. A sample of YBa2Cu3O6.60 with = 59 K was found to have = 170 nm,Sonier2 very close to the geometric mean = 16826 nm of the = 56 K sample studied here. An optimally doped sample of YBa2Cu3O6.95 with = 93 K had = 112 nm,Sonier1 which lies between the means of the = 75 K sample (12512 nm) and the overdoped = 89 K sample (916 nm) studied here. The agreement reflects the particular care taken in these measurements to cover a wide range of applied magnetic fields in order to ascertain the low field limiting values and thus minimize the non-linear, non-local, and other effects that can arise in the vortex state. It must also be noted that the measurements hinge on a detailed model of the vortex lattice that provides a fit to the field distribution detected by the muons.
These absolute values of penetration depth obtained in single crystals are smaller than many measurements found in the existing literature on YBa2Cu3O6+y. Magnetization studies of aligned powders by Panagopoulos et al.Panagopoulos gave 140 nm for =92, 210 nm for =66 and 280 nm for =56 (all 25%), which are longer than the values presented here. The origin of this discrepancy is not clear, but might be due to assumptions made in the analysis of the powder data or problems with the surfaces of grains embedded in epoxy. Our absolute values of and are also smaller than those obtained by far infrared measurements near optimal dopingBasov (=160 nm, =100nm). However, the infrared measurements did point out the importance of the in-plane anisotropy in these materials, an anisotropy that becomes very large in the YBa2Cu3O6.99 sample studied here. This anisotropy has been attributed to the presence of a nearly one-dimensional Fermi sheet derived mainly from the bands associated with the CuO chains.Atkinson Although measurements cannot directly measure this anisotropy, Tallon et al.Tallon also inferred such a contribution by noting the very large increase in muon depolarization rates as the chain oxygen sites become filled near YBa2Cu3O7. The interpretation of the polycrystalline data suggested values of = 155 nm and = 80 nm for samples with fully doped CuO chains, which overestimates both the overall magnitude and the anisotropy of the in-plane penetration depth. However, the basic picture of chain-driven anisotropy is supported by our new microwave measurements, which also show substantial anisotropy in the ortho-II ordered sample, but rather less in the ortho-III sample, a sensible trend since the ortho-III ordering is much poorer, leading to more fragmented chains.
Much of the work on the doping-dependence of has relied on muon spin relaxation measurements on polycrystalline samples. In these measurements, the field inhomogeneity in the vortex state gives rise to dephasing of the precessing spins of implanted muons. A Gaussian fit is often used to extract a relaxation rate which is deemed proportional to . As long as the material is nearly two dimensional, the constant of proportionality can be calculated to be , with in and in nm.Bernhard ; Bardford In the YBa2Cu3O6+y system, this very simple treatment of muon data gives values of that are typically 20% or more larger than the single crystal data reported here.Bernhard ; Uemura ; Tallon2003 ; Pumpin The resulting underestimate of the superfluid density, together with the problematic -plane anisotropy, mean that the single crystal penetration depths reported here can offer a clearer picture of the doping dependence of the superfluid density in the CuO2 planes.
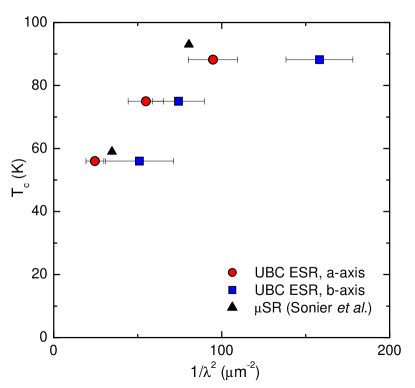
Figure 12 displays versus , a plot first suggested by Uemura et al.Uemura A long-accepted result has been a linear relationship between these two quantities at low doping, followed by a plateau at higher doping that varies from one cuprate system to another, inferred mainly from measurements on ceramics.Uemura The data in Fig. 12 confirms the overall feature that increases with . However, the linear regime at low doping, which implied a superfluid phase stiffness proportional to on the underdoped side of the cuprate phase diagram, is not supported by the new data presented here, at least for 56 K. The measurements on , which is slightly past optimal doping, are certainly up in the “plateau” regime for this material and would not be expected to follow . However, even for the lower two dopings with = 56 K and = 75 K the -axis phase stiffness, which avoids contributions associated with the CuO chains, is still far from a relationship of the form . The plot instead suggests a sublinear dependence of on , since must fall to zero when does. Further data at low doping will be needed to clarify the relationship over the entire doping range. Interestingly, the latest muon spin relaxation studies by Tallon et al.Tallon2003 also suggest a sublinear relationship, although the values of in that study are significantly larger than the single crystal data presented here. In the past, has been seen as evidence that phase fluctuations play a central role in setting on the underdoped side of the cuprate phase diagram.Kivelson Indeed, the relatively low values of phase stiffness in the cuprates, plus the observation of critical fluctuations near the superconducting transistion,Kamal ; Meingast do indicate that phase fluctuations play a role in determining . However, the deviation from a linear relationship seen in Fig. 12 suggests that other factors must also contribute to the critical temperature. The obvious candidate is thermal excitation of nodal quasiparticles,Scalapino ; Carbotte ; Lee which give rise to the linear temperature dependence of and rapidly deplete the superfluid density as temperature rises. However, the central puzzle regarding the correlation between superfluid density and still remains in such a scenario. As the doping decreases, the zero temperature value of the superfluid density becomes much smaller, so that it becomes easy for quasiparticle excitations, in addition to fluctuations, to drive the material normal at a lower . The mystery still lies in understanding why the superfluid density becomes so small with decreasing hole doping.
Acknowledgements.
The authors are grateful to P. Dosanjh for his technical assistance, and are particularly indebted to A. Jánossy for sharing his knowledge of Gd ESR and providing figures 8 and 9. We are also grateful for useful discussions with D. M. Broun, J. Sonier, I. Herbut, K. Moler, J. Guikema and S. Kivelson. This work was supported by the Natural Science and Engineering Research Council of Canada and the Canadian Institute for Advanced Research.Appendix A Extracting anisotropic values from multiple measurements
YBa2Cu3O6+y single crystals have strong natural cleave planes perpendicular to both the [100] and [010] directions. Using this fact, previous studies of the temperature dependence of have been successful at separating the out-of-plane response from the in-plane response by measuring a sample, cleaving it times, and then repeating the measurement with all of the pieces together. The second measurement contains the same in-plane contribution, but has the -axis contribution enhanced by a factor of .Ahmad For practical reasons, in the present work it was not possible to measure all of the crystal fragments together following cleaving in all cases, instead we successively measured each crystal after reducing the in-plane area. The -axis thickness of the crystal was unchanged for all measurements, but the measurement of retains the largest relative uncertainty because . Since is also rather large, care must be taken when combining measurements in order to minimize the impact of the large relative uncertainty in the quantity in Eq. 5. The method we use here is to combine measurements of the same crystal in both -axis and -axis directions before and after cleaving where the crystal’s aspect ratio has changed by approximately 50%, providing an overdetermination of the three unknown values. For example, before and after cleaving the sample we measure
which sum to give
| (8) |
A second measurement with new dimensions and provide a second expression having the same form as Eq. 8, and subtracting the two eliminates and , leaving only in terms of measured quantities. The values of and are then calculated from the above expressions.
References
- (1) W. N. Hardy, D. A. Bonn, D. C. Morgan, Ruixing Liang and Kuan Zhang, Phys. Rev. Lett. 70, 3999 (1993).
- (2) S. Kamal, D. A. Bonn, Nigel Goldenfeld, P. J. Hirschfeld, R. Liang, W. N. Hardy, Phys. Rev. Lett. 73, 1845 (1994).
- (3) Y. J. Uemura, G. M. Luke, B. J. Sternlieb, J. H. Brewer, J. F. Carolan, W. N. Hardy, R. Kadono, J. R. Kempton, R. F. Kiefl, S. R. Kreitzman, P. Mulhern, T. M. Riseman, D. Ll. Williams, B. X. Yang, S. Uchida, H. Takagi, J. Gopalakrishnan, A. W. Sleight, M. A. Subramanian, C. L. Chien, M. Z. Cieplak, Gang Xiao, V. Y. Lee, B. W. Statt, C. E. Stronach, W. J. Kossler, and X. H. Yu, Phys. Rev. Lett. 62, 2317 (1989).
- (4) J. E. Sonier, J. H. Brewer and R. F. Kiefl, Rev. Mod. Phys. 72, 769 (2000).
- (5) J. W. Guikema, J. H. Bluhm, D. A. Bonn, Ruixing Liang, W. N. Hardy and K. A. Moler submitted to Phys. Rev. Lett. , 2003.
- (6) L. Krusin-Elbaum, R. L. Greene, F. Holtzberg, A. P. Malozemoff and Y. Yeshurun, Phys. Rev. Lett. 62, 217 (1989).
- (7) A. Carrington, R.W. Giannetta, J. T. Kim and J. Giapintzakis, Phys. Rev. B59, 14173 (1999).
- (8) C. Panagopoulos, J. R. Cooper and T. Xiang Phys. Rev. B 57, 13422 (1998).
- (9) Ju Young Lee, Kathleen M. Paget, Thomas R. Lemberger, S. R. Foltyn and Xindi Wu, Phys. Rev. B 50, 3337 (1994).
- (10) C. C. Homes, T. Timusk, D. A. Bonn, R. Liang, W. N. Hardy Physica (Amsterdam) 254C, 265 (1995).
- (11) D. N. Basov, R. Liang, D. A. Bonn, W. N. Hardy, B. Dabrowski, M. Quijada, D. B. Tanner, J. P. Rice, D. M. Ginsberg and T. Timusk, Phys. Rev. Lett. 74, 598 (1995).
- (12) P. J. Hirschfeld and W. A. Atkinson, J. Low Temp. Phys. 127, 289 (2002).
- (13) D. A. Bonn, S. Kamal, Kuan Zhang, Ruixing Liang, D. J. Baar, E. Klein, and W. N. Hardy, Phys. Rev. B50, 4051 (1994).
- (14) D. A. Bonn, S. Kamal, A. Bonakdarpour, R. Liang, W. N. Hardy, C. C. Homes, D. N. Basov, and T. Timusk, Czech. J. Phys. 46 3195 (1996).
- (15) Ruixing Liang, W. N. Hardy, and D. A. Bonn, Physica (Amsterdam) 304C, 105 (1998).
- (16) Ruixing Liang, W. N. Hardy, and D. A. Bonn, Physica (Amsterdam) 336C, 57 (2000).
- (17) P. Manca, S. Sanna, G. Calestani, A. Migliori, S. Lapinskas and E. E. Tornau, Phys. Rev. B63, 134512 (2001).
- (18) M. v. Zimmermann, J. R. Schneider, T. Frello, N. H. Andersen, J. Madsen, M. Kall, H. F. Poulsen, R. Liang, P. Dosanjh and W. N. Hardy, Phys. Rev. B68, 104515 (2003).
- (19) J. L. Pouchou, F. Pichoir Microbeam Analysis, 20, 105 (1985).
- (20) P. J. Turner, D. M. Broun, Saeid Kamal, M. E. Hayden, J. S. Bobowski, R. Harris, D. C. Morgan, J. S. Preston, D. A. Bonn and W. N. Hardy, cond-mat/0307340, Accepted in Rev. Sci. Instrum.
- (21) A. Hosseini, R. Harris, Saeid Kamal, P. Dosanjh, J. Preston, Ruixing Liang, W. N. Hardy, and D. A. Bonn, Phys. Rev. B60, 1349 (1999).
- (22) P. J. Turner, R. Harris, Saeid Kamal, M. E. Hayden, D. M. Broun, D. C. Morgan, A. Hosseini, P. Dosanjh, G. K. Mullins, J. S. Preston, Ruixing Liang, D. A. Bonn and W. N. Hardy, Phys. Rev. Lett. 90, 237005 (2003).
- (23) R. Prozorov, R. W. Giannetta, P. Fournier, and R. L. Greene, Phys. Rev. Lett. 85, 3700 (2000).
- (24) 155Gd and 157Gd each have nuclear spin and natural abandances of 14.80% and 15.65% respectively. Typical values of the isotropic hyperfine coupling are 12 and 15 MHz, which are much smaller than our observed ZF ESR line width of about 300 MHz. A. Jánossy, private communication.
- (25) A. Abragam and B. Bleaney, Electron Paramagnetic Resonance of Transition Ions, Clarendon press, Oxford, 1970.
- (26) A. Jánossy, A. Rockenbauer, S. Pekker, G. Oszlanyi, G. Faigel and L. Korecz, Physica (Amsterdam) 171C, 457 (1990).
- (27) S. Pekker, A. Jánossy and A. Rockenbauer Physica (Amsterdam) 181C, 11 (1991).
- (28) A. Rockenbauer, A. Jánossy, L. Krecz and S. Pekker J. Mag. Res. 97, 540 (1992).
- (29) J. Zaanen, A. T. Paxton, O. Jepsen, and O. K. Andersen Phys. Rev. Lett. 60 2685(1988)
- (30) J. E. Sonier, J. H. Brewer, R. F. Kiefl, D. A. Bonn, S. R. Dunsiger, W. N. Hardy, Ruixing Liang, W. A. MacFarlane, R. I. Miller, and T. M. Riseman, D. R. Noakes, C. E. Stronach and M. F. White Jr., Phys. Rev. Lett. 79, 2875 (1997).
- (31) W. A. Atkinson, Phys. Rev. B 59, 3377 (1999).
- (32) J. L. Tallon, C. Bernhard, U. Binninger, A. Hofer, G. V. M. Williams, E. J. Ansaldo, J. I. Budnick and Ch. Niedermayer, Phys. Rev. Lett. 74, 1008 (1995).
- (33) C. Bernhard, Ch. Niedermayer, U. Binninger, A. Hofer, Ch. Wenger, J. L. Tallon, G. V. M. Williams, E. J. Ansaldo, J. I. Budnick, C. E. Stronach, D. R. Noakes and M. A. Blankson-Mills, Phys. Rev. B 52, 10488 (1995).
- (34) W. Bardford and J. M. F. Gunn, Physica C 156, 515 (1988).
- (35) B. Pumpin, H. Keller, W. Kundig, W. Odermatt, I. M. Savic, J. W. Schneider, H. Simmler, P. Zimmermann, E. Kaldis, S. Rusiecki, Y. Maeno and C. Rossel, Phys. Rev. B 42, 8019 (1990).
- (36) J. L. Tallon, J. W. Loram, J. R. Cooper, C. Panagopoulos and C. Bernhard, Phys. Rev. B 68, 180501 (2003).
- (37) V. Emery and S. Kivelson, Nature (London) 374, 434 (1995).
- (38) S. Kamal, D. A. Bonn,N. Goldenfeld, P. J. Hirschfeld, Ruixing Liang and W. N. Hardy, Phys. Rev. Lett. 73, 1845 (1994).
- (39) V. Pasler, P. Schweiss, C. Meingast, P. Obst, H. Wuhl, A. I. Rykov and S. Tajima, Phys. Rev. Lett. 81, 1094 (1998).
- (40) D. J. Scalapino, Phys. Rep. 250, 329 (1995).
- (41) M. Prohammer and J. P. Carbotte, Phys. Rev. B 43, 5370 (1991).
- (42) Patrick A. Lee and Xiao-Gang Wen, Phys. Rev. Lett. 78, 4111 (1997).