Diffusion and mixing in gravity-driven dense granular flows
Abstract
We study the transport properties of particles draining from a silo using imaging and direct particle tracking. The particle displacements show a universal transition from super-diffusion to normal diffusion, as a function of the distance fallen, independent of the flow speed. In the super-diffusive (but sub-ballistic) regime, which occurs before a particle falls through its diameter, the displacements have fat-tailed and anisotropic distributions. In the diffusive regime, we observe very slow cage breaking and Péclet numbers of order 100, contrary to the only previous microscopic model (based on diffusing voids). Overall, our experiments show that diffusion and mixing are dominated by geometry, consistent with fluctuating contact networks but not thermal collisions, as in normal fluids.
pacs:
PACS number(s): 45.70.-n, 45.70.Mg, 66.30.-hGranular flow is an attractively simple and yet surprisingly complex subject jaeger96 . Fast, dilute flows are known to obey classical hydrodynamics (with inelastic collisions), but slow, dense flows pose a considerable challenge to theorists, due to many-body interactions and non-thermal fluctuations. Beyond their fundamental scientific interest, such flows have important engineering applications ottino02 , e.g. to new pebble-bed nuclear reactors talbot02 , whose efficiency and safety depend on the degree of mixing in very slow granular drainage ( pebble/min).
Although dense granular drainage is very familiar (e.g. sand in an hourglass), it is far from fully understood. Over the past forty years, a number of theoretical approaches have been proposed for steady state flow lit63 ; mullins72 ; nedderman79 ; prakash91 ; nedderman91 . Continuum approaches are based on the critical-state theory of soil mechanics and yield only mean velocity fields prakash91 ; nedderman91 . On the other hand, the diffusive void model lit63 ; mullins72 takes a particle approach, in which ‘voids’ injected at the orifice cause drainage by diffusing upward and exchanging position with particles along the way. Averaging over the void trajectories yields the same continuum velocity field for particles as the ‘kinematic model’ nedderman79 ; nedderman91 , which provides a reasonable fit to experimental data with only one fitting parameter (the diffusion length, ) mullins72 ; mullins74 ; nedderman79 ; samadani99 , although the void model on a regular lattice (as in Ref. caram91 ) underpredicts its value bazant03 . Remarkably, these models depend only on geometry and not on momentum, energy, etc.
In spite of the success of the kinematic model, however, its only microscopic basis, the void model, greatly overpredicts diffusion. To see this, consider the Péclet number, , the dimensionless ratio of advection in uniform downward flow of speed, , to diffusion with a horizontal diffusivity, , at the scale of a particle diameter, . In the void model, when a particle falls a distance , , is of order one for any conceivable packing since , and therefore it diffuses horizontally by roughly . This prediction is contradicted by everyday experience and our experiments below, which exhibit far less mixing. An attempt to resolve this paradox with a new model appears in a companion paper bazant03 .
(a)
(b)
(c)
In this Letter, we describe particle-tracking experiments on silo drainage using similar techniques as in a recent (lower-resolution) study of the velocity field medina98 . We focus on the statistical evolution of particle displacements and topological “cages”, which should aid in developing new microscopic models. Our data may also have implications for recent attempts to apply thermodynamic approaches from glassy dynamics to granular flows edwards94 ; barrat00 ; makse02 . Although we do not define a “granular temperature”, we observe the presumably related effect of varying the flow rate in all of our measurements.
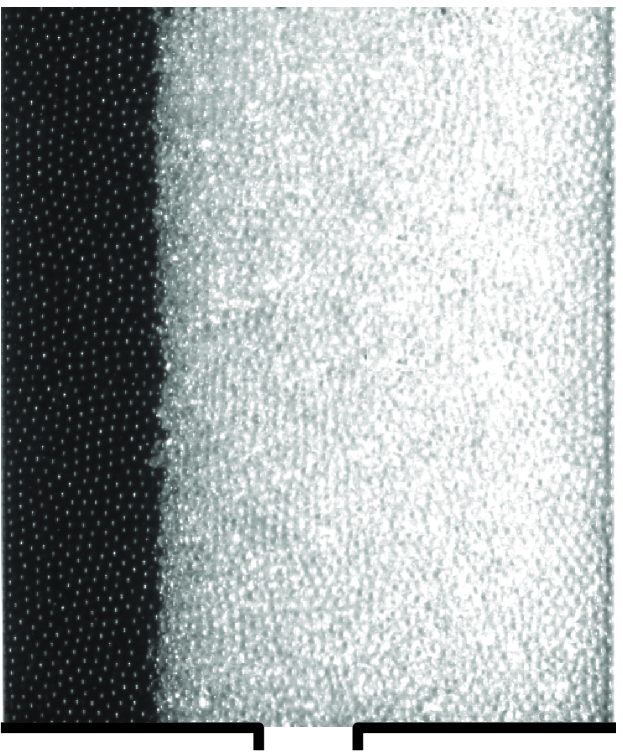
Our experimental apparatus involves glass beads ( mm) in a quasi-two dimensional silo ( cm ). The particles are observed near the front wall made of transparent glass, where the slight polydispersity reduces the tendency for hexagonal packing. (As seen in Fig. 1, there is no long-range order, although the wall induces some short-range order that may affect our results.) We find that varying the thickness of the silo has insignificant effect on the diffusion properties and therefore we report our data for a single thickness. We track individual particles using a high-speed digital camera with a maximum resolution of pixels at 1000 frames/sec. Particle positions are obtained to sub-pixel accuracy using a centroid technique (, pixels).
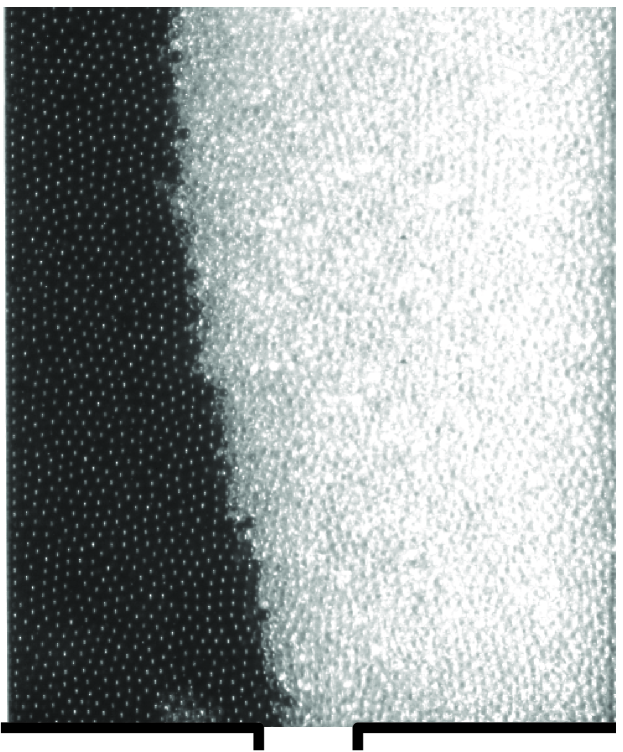
Our first experiment provides a visual demonstration that particles mix much less than predicted by the void model. We load the silo with black and white (but otherwise identical) glass beads, forming two separate columns, as shown Fig. 1(a). From Fig. 1(b), where half of the particles have drained (in 30 sec), it is clear that the black-white interface has not smeared significantly, although it has roughened. The small degree of mixing is consistent with the segregation of bi-disperse beads in a similar apparatus samadani99 .
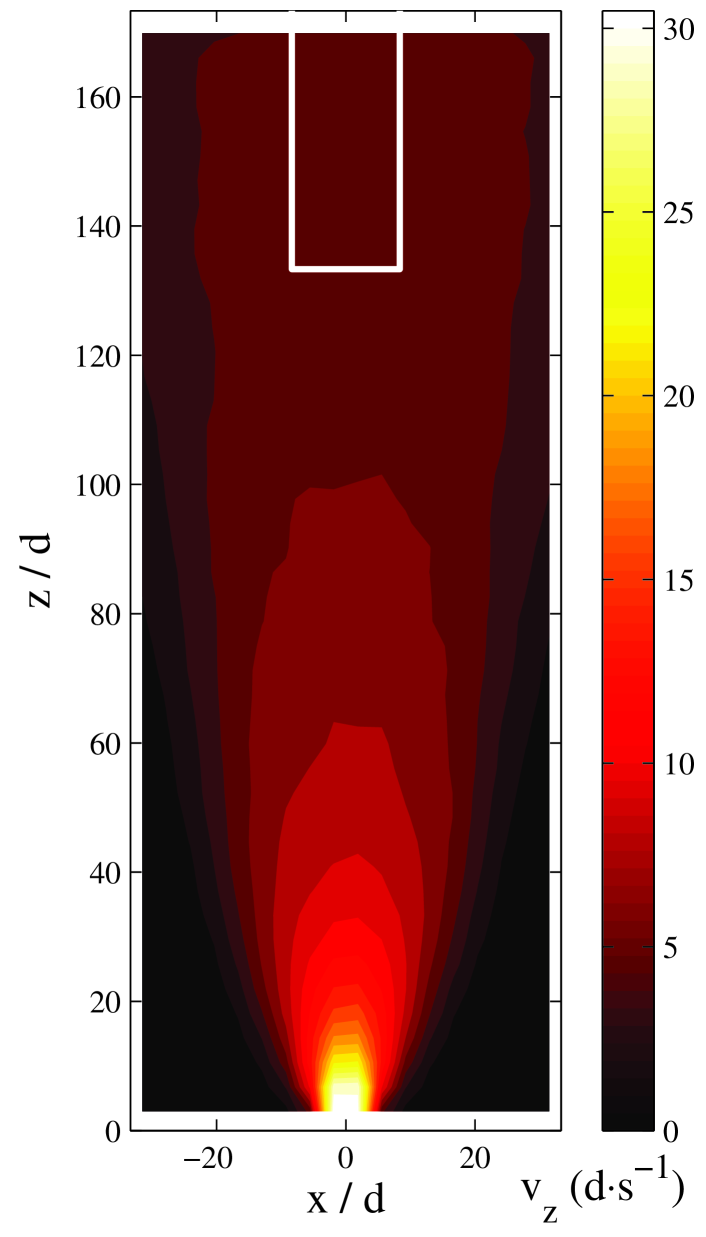
The mean downward velocity field, , is shown in Fig. 1(c) throughout the silo, as measured by direct particle tracking. A distributed filling procedure similar to that in Ref. zhong01 was used to add grains to the silo. Then the orifice was opened and steady state flow was allowed to develop before acquiring the data used for subsequent analysis. The flow speed is highest at the center-line, with a maximum near the orifice, and decays to zero toward the sides. Fairly good agreement with the kinematic model is obtained with .
In order to investigate particle dynamics in a simple setting, we focus on a small region of nearly uniform flow, the white box in Fig. 1(c). For the measurements below, we track about 1370 particles through this window for 4 seconds in steps of 1 ms. The average flow speed , the only control parameter in this study, is varied by changing the width of the orifice, . The flow is fairly smooth for mm (about ) and nearly continuous for mm. For simplicity, we vary in the range 8 mm 32 mm, in increments of 4 mm, to avoid the complicated regime of intermittent flow liu98 . This corresponds to , and data is consistent with . We compile statistics from all tracked particles in six experiments per flow speed (except two for mm).
(a)
 (b)
(b)
 (c)
(c)
 (d)
(d)
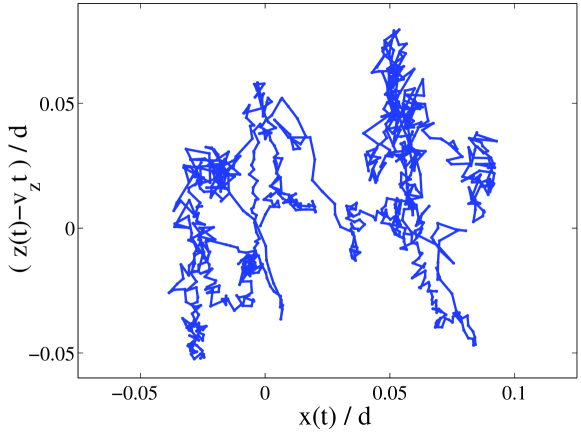
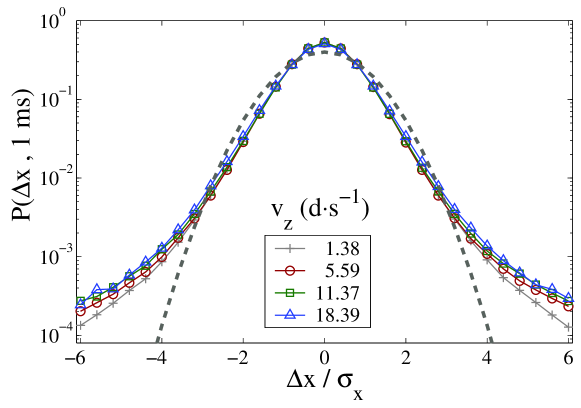
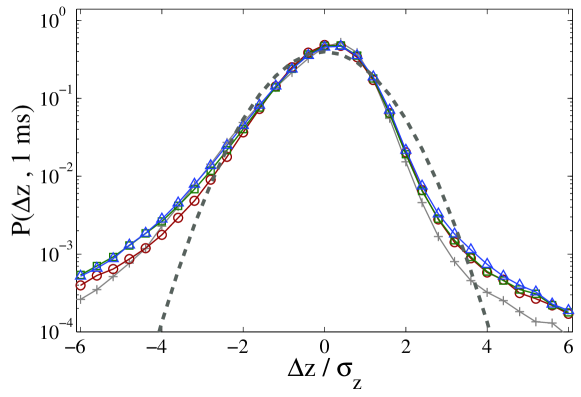
From the positions of the particles sampled at 1 ms intervals, we calculate the horizontal and vertical displacements, and , relative to a frame moving with the mean speed of the flow. A typical trajectory computed in this way in Fig. 2(a) shows periods of small fluctuations with occasional, much larger steps. This suggests that the probability density functions (PDFs) for and (for ms) should have fat tails compared to a Gaussian, which is confirmed in Fig. 2(b)–(c).
Fat-tailed PDFs have also been observed in colloidal glasses and attributed to cage-breaking weeks02 , but a special feature here is the asymmetry of the PDF for in Fig. 2(c). Downward fluctuations () are larger than both upward () and horizontal () fluctuations. We attribute this to the fact that particles are accelerated downward by gravity while being scattered in other directions by dissipative interactions with neighbors.
(a)
 (b)
(b)
 (c)
(c)
 (d)
(d)
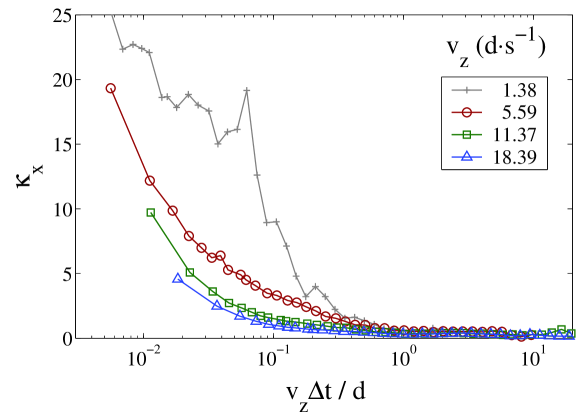
Looking again at Fig. 2(a), it seems that the large fluctuations in particle displacements would be reduced by coarse-graining in time, perhaps enough to recover standard Gaussian statistics. Indeed, as shown in Fig. 2(d), the normalized kurtosis, , which measures how the shape of the distribution of differs from a Gaussian, decreases toward zero as increases. (The data fluctuates somewhat for sec, presumably due to intermittency.) This suggests a transition from super to normal diffusion.
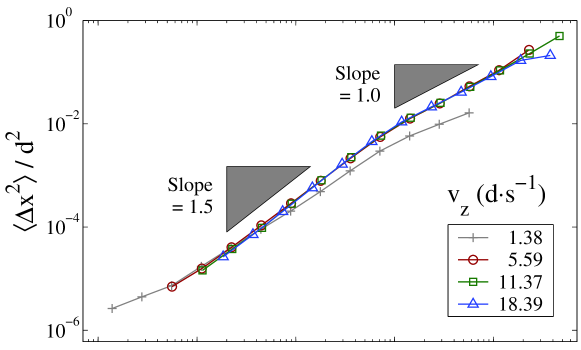
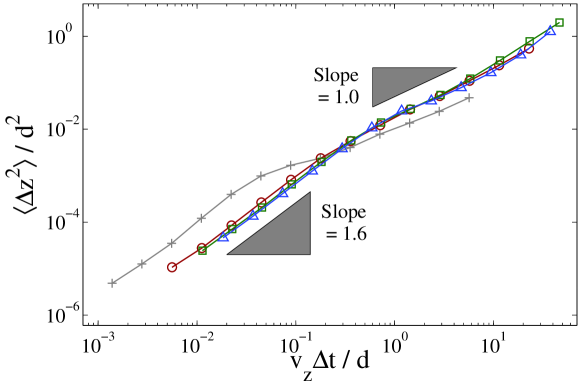
As shown in Fig. 3(a)–(b), the scaling of the mean-square displacements does, in fact, change from super-diffusive, and , to diffusive, . The normal diffusion in long time scales is consistent with previous studies of dense drainage where particles were tracked with lower time resolution hsiau93 ; natarajan95 . Curiously, the super-diffusion is slower than in the usual case of ballistic transport in fluids, , where particles move freely between collisions. Sub-ballistic scaling and non-Gaussian statistics at short times suggest that dense granular flows differ from classical fluid flows.
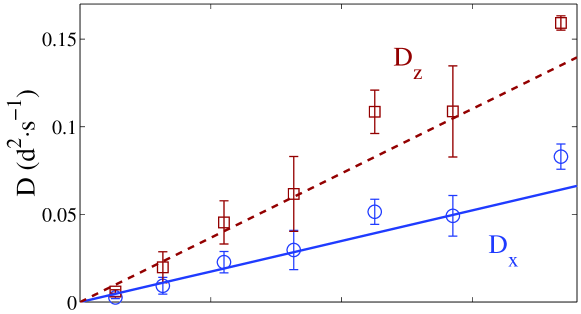
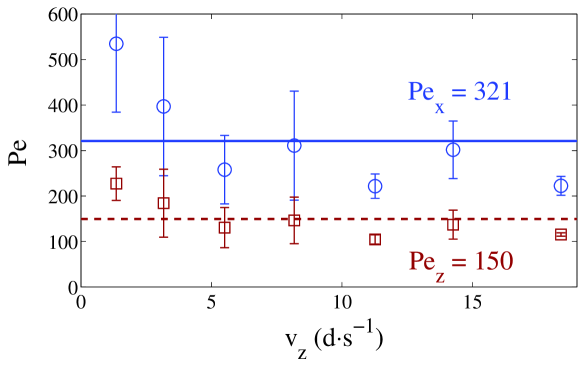
The differences become even more obvious upon varying the flow rate. In a fluid, this causes a linear increase in Pe because the mean flow has no affect on molecular diffusion due to thermal fluctuations. Here, as shown in Fig. 3(c)–(d), the measured diffusion coefficients, e.g. , are actually proportional to the flow speed (with , consistent with the discussion above), so the Péclet numbers, and , are roughly constant. This suggests that diffusion and advection are caused by the same physical mechanism, such as a passing void. The measured Péclet numbers, however, are two orders of magnitude larger than predicted by the void model.
Since , we plot the mean square displacements versus the mean distance dropped in the laboratory frame, . Remarkably, as shown in Fig. 3(a)–(b), this collapses all of our data for different flow speeds onto a single curve, not only in the diffusive regime, but also in the super-diffusive regime. (The data for the smallest flow speed again differs somewhat.) A smooth crossover from super to normal diffusion occurs after particles have fallen roughly one particle diameter.
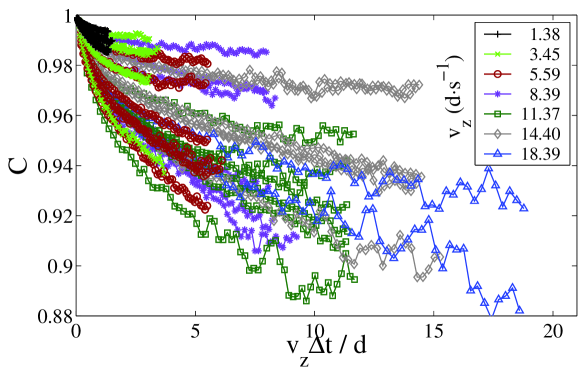
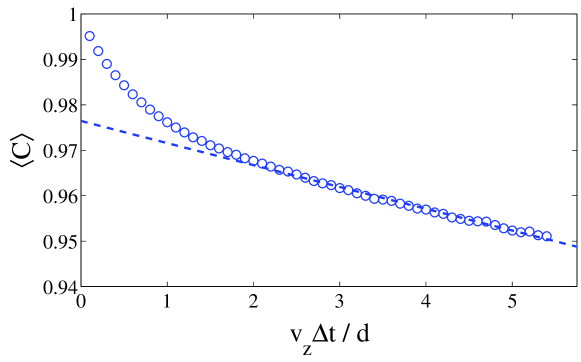
Although advection dominates particle dynamics (), diffusion causes a gradual rearrangement of the ‘cage’ of nearest neighbors. To investigate this mixing directly, we measure the topological correlation function, , defined as the fraction of nearest neighbor pairs preserved from times to , averaged over all . We chose the cutoff for a nearest neighbor, , as the first minimum of the radial distribution function. (which yields coordinations near 0.59). As shown in Fig. 4(a), the data for collapses when plotted versus , in the sense that no systematic dependence on is observed (except perhaps for the smallest orifice widths), so in Fig. 4(b) we plot the average over all experiments in the continuous flow regime ( or ).
The cage correlation function in Fig. 4(b) exhibits a clear crossover, which closely parallels the ones for mean displacements in Fig. 3(a)–(b). In the superdiffusive regime, decreases fairly quickly (with a decay length of roughly ), but after falling more than one particle diameter the rate of decrease (neighbor loss) slows considerably. Since the topology remains more than intact within the observation window, the precise form of the long-distance decay is uncertain, but a least-squares exponential fit, , yields a “cage breaking length” of . This gives direct evidence that the flow is characterized by long-lasting contacts, as is obvious to the naked eye. It also firmly rejects the void model because any void-particle exchange removes roughly half of the neighbors of a particle as it falls by only one diameter.
(a)
 (b)
(b)
To counter the argument that a collisional regime may exist below the experimental resolution ( ms), we show that this is inconsistent with the fact that diffusion and mixing depend only on geometry (Figs. 3–4). In the standard model of a collisional gas, a particle dropping a distance, , experiences an average of collisions which must dissipate its gravitational potential energy: , where is the mass, the gravitational acceleration, the restitution coefficient, and the mean relative velocity. To be consistent with our data, should depend on , but not the flow speed, . Although is unknown, we can make two estimates — both of which lead to a contradiction. The first starts from the natural formula, with fixed ms, which suggests by looking at the initial slope of in Fig. 3(b). The second follows from direct measurements menon97 of yielding . In either case, would not be constant. (Note that would typically correlate with , so velocity-dependent restitution cannot compensate for the changes in .)
More generally, in slow granular flows it seems that “granular temperature” may not be a useful concept. Figures 3 and 4 clearly show that fluctuations depend only on the distance fallen, and yet any notion of temperature should increase with the flow speed. The fact that the nearest-neighbor topology persists for distances comparable to the system size also seems to cast doubt on the assumption of ergodicity.
Instead, our experimental data suggests that cage rearrangements are caused by the relaxation of contact networks, as are believed to occur in Couette cells howell99 . Such networks could absorb potential energy via rolling and sliding neighbors. The breaking of a contact could cause non-Gaussian fluctuations and small-scale superdiffusion among the particles in a network, while the gradual destruction of a network (and reformation of a new one) as a particle falls farther than its own diameter could cause the observed transition to normal diffusion. All of these effects are dominated by the geometry of random close packings, which is not fully understood, even without any dynamics torquato00 .
In summary, we have experimentally investigated particle dynamics in dense granular flows — as they occur in silo drainage. Consistent with the void model, we observe diffusion after drainage by more than a particle diameter and Péclet numbers which are independent of the flow rate, suggesting that advection and diffusion have the same physical source. The Péclet numbers and cage-breaking lengths, however, are much larger than predicted, so the question of an appropriate microscopic model is left open.
Acknowledgements.
We thank A. Samadani and D. Blair for helpful discussions. This work was supported by the Department of Energy (grant #DE-FG02-02ER25530), the Norbert Weiner Research Fund, and NEC Fund at MIT and by the National Science Foundation (grant #DMR-9983659) at Clark.References
- (1) H. M. Jaeger, S. R. Naegel, and R. P. Behringer, Rev. Mod. Phys. 68, 4, 1259 (1996).
- (2) J. M. Ottino and D. V. Khakhar, Annu. Rev. Fluid Mech. 32, 55 (2000).
- (3) D. Talbot, MIT Technology Review 105, 54 (2002).
- (4) J. Litwiniszyn, Bull. Acad. Pol. Sci. 11, 593 (1963).
- (5) J. Mullins, J. Appl. Phys. 43, 665 (1972).
- (6) R. M. Nedderman and U. Tuzun, Powder Tech. 22, 243 (1979); 23, 257 (1979).
- (7) J. R. Prakash and K. K. Rao, J. Fluid Mech. 225, 21 (1991).
- (8) R. M. Nedderman, Statics and Kinematics of Granular Materials, 241 (Cambridge University Press, 1992).
- (9) J. Mullins, Powder Tech. 9, 29 (1974); 23, 115 (1979).
- (10) A. Samadani, A. Pradhan, and A. Kudrolli, Phys. Rev. E 60, 7203 (1999).
- (11) H. Caram and D. C. Hong, Phys. Rev. Lett. 67, 828 (1991).
- (12) M. Z. Bazant, http://arxiv.org/abs/cond-mat/0307379.
- (13) A. Medina, J. A. Córdova, E. Luna, and C. Treviño, Phys. Lett. A 250, 111 (1998).
- (14) S. F. Edwards, Granular Matter: An Interdisciplinary Approach, Ed. by A. Mehta, 121 (Springer, 1994).
- (15) A. Barrat, J. Kurchan, V. Loreto, and M. Sellitto, Phys. Rev. Lett. 85, 5034 (2000).
- (16) H. A. Makse and J. Kurchan, Nature 415, 614 (2002).
- (17) Z. Zhong, J. Y. Ooi, and J. M. Rotter, Engineering Structure 23, 756 (2001).
- (18) A. J. Liu and S. R. Nagel, Nature 396, 21 (1998).
- (19) E. R. Weeks and D. A. Weitz, Phys. Rev. Lett. 89, 095704 (2002).
- (20) S. S. Hsiau and M. L. Hunt, J. Fluid Mech. 251, 299 (1993).
- (21) V. V. R. Natarajan, M. L. Hunt, and E. D. Taylor, J. Fluid Mech. 304, 1 (1995).
- (22) N. Menon and D. J. Durian, Science 275, 1920 (1997).
- (23) D. Howell , R. P. Behringer, and C. Veje, Phys. Rev. Lett. 82, 5241 (1999).
- (24) S. Torquato, T. M. Truskett, and P. G. Debenedetti, Phys. Rev. Lett. 84, 2064 (2000).