Scaling of dynamics in 2d semi-dilute polymer solutions
Abstract
We study the viscoelasticity of surface polymer monolayers by measuring the dynamics of thermal concentration fluctuations with surface light scattering. For various systems of proteins and synthetic polymers we find a semi-dilute regime in which both the elastic and viscous components of the dilational modulus show power law dependencies on the concentration. Surprisingly there is a universal relationship between the exponents for the two components: the viscosity scales with a power double that of the elasticity. These results cannot be explained on the basis of theory developed for bulk systems, and a simple explanation for the singular 2d behavior is suggested.
pacs:
68.03.Cd, 87.14.EePolymers are flexible long chain molecules, of outstanding importance in diverse fields from processing of materials to biological activity. It is well known that it is possible to effectively confine some polymers to two dimensions, for example by anchoring each monomer to the interface between immiscible fluids Gaines (1960). Polymer dynamics in two dimensions (2d) has remained relatively unexplored compared to bulk solutions, despite there being important examples both in life sciences and in technology where polymer molecules are confined to a plane. We consider the simplest situation where the chains lie flat and are free to move only in a 2d space. Such a surface layer exerts a lateral osmotic pressure , which is the amount by which the surface tension is reduced compared to the free interface tension . This pressure becomes significant above overlap of single chains, where it has a power-law dependence on the concentration that has been known for some time Vilanove and Rondelez (1980). Like its counterpart in 3d bulk solutions, this equilibrium property is well explained within the picture of the polymer semi-dilute regime as an ensemble of independent “blobs” de Gennes (1979). Despite a few decades of experiments, very little is known instead about the physical nature of the divergence of viscosity and elasticity in 2d. These dynamical properties control important processes like foam drainage Stone et al. (2003) and stabilization and flow in emulsions Buzza et al. (1995) when polymers are used as surfactants. The theoretical framework to describe complex non-Newtonian flow and the dynamics of chains is well understood in 3d Doi and Edwards (1986), but cannot be applied straightforwardly in 2d. How does the confinement to the surface, specifically a 2d effect, affect the dynamics of the system?
This Letter presents a study of the dynamics of concentration fluctuations in a wide range of polymer monolayers, performed with surface dynamic light scattering. Polymers are spread onto an interface in dilute conditions, and cannot subsequently submerge and re-surface. Under these conditions polymer chains are unable to cross each other. This is the case for many monolayer systems studied in the literature. The technique used in this work, developed by Langevin and others, see the monograph Langevin (1992), is the only existing probe of thermal concentration fluctuations in monolayers. Despite its use on polymer monolayers by various groups various , some issues concerning the data analysis have been resolved only recently, hence the data which is available for a quantitative comparison is very limited.
Isolated polymer chains are usually modelled as random walks with potential interactions de Gennes (1979). The Flory exponent relates the number of monomers to the radius of gyration: . When the concentration in a polymer solution is increased so that individual chains are forced to overlap, the system enters a semi-dilute regime that lasts until the monomer fraction is very high. The semi-dilute region is important because for sufficiently long chains it covers a wide range of concentrations. The equilibrium properties of polymers in this regime are given both in 2d and 3d by scaling laws, with exponents related to . In particular, fluctuations of the density of monomers are correlated over a length , defining a region known as a “blob” de Gennes (1979). Inside the blob the chain has the same statistics as an isolated single chain, but different blobs are statistically independent. In 2d scales with the concentration as:
| (1) |
decreasing from a value of the order of at the overlap concentration to the monomer size. Scaling of the osmotic pressure in a monolayer was first shown experimentally in ref. Vilanove and Rondelez (1980):
| (2) |
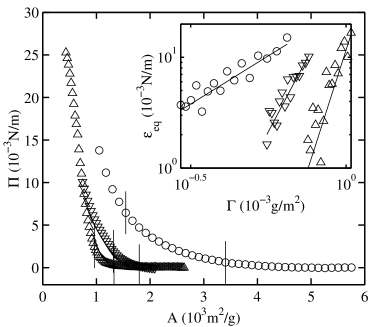
Figure 1 shows equilibrium data for some of the systems studied in this work. In 2d there are well known limiting regimes: The “good solvent”, in which the chain behaves as a self-avoiding random walk, hence and , and the “ conditions” where the effects of excluded volume balance the monomer-monomer preferential attraction. Here the Flory exponent is predicted to be Coniglio et al. (1987) and the power law exponent increases to , making this isotherm much steeper and compact. In contrast to the bulk, where the polymer chains can interpenetrate, in the planar 2d geometry the polymers are segregated and attain disk-like configurations de Gennes (1979). Chains are corralled by their neighbors, as was observed with DNA molecules confined to a plane in ref. Maier and Rädler (1999).
In general, the response to a deformation in an isotropic 2d material is characterized by two elastic moduli: changes in area are controlled by the dilation modulus and changes in shape by the shear modulus Miller et al. (1996). Polymer monolayers in the semi-dilute regime are fluid-like and the shear modulus is negligible Cicuta et al. (2003). In these conditions it is common practice to determine the equilibrium dilational modulus (the 2d analog of the bulk modulus) from measurements of pressure as a function of area: . By definition, has the same scaling properties as the osmotic pressure, described in Eq. 2. Power laws of as a function of concentration are shown in Fig. 1.
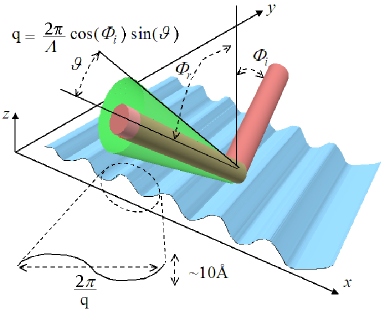
The dilational modulus can also be measured dynamically, in an experiment where the surface area oscillates in time with a frequency . Then the dynamic complex modulus is probed, where is the elastic component of the response modulus and is the dilational viscosity. can be accessed with the surface quasi-elastic light scattering (SQELS) technique, shown in Fig. 2. SQELS measures the time correlation function of light scattered from thermal surface roughness, which acts as a phase grating Langevin (1992). These out of plane fluctuations are underdamped waves with a frequency , and their motion is affected by the presence of a surface film. To recover surface viscoelaticity, the surface wave dispersion relation that relates the wave frequency to the wavelength has to be known:
| (3) |
is the subphase Newtonian viscosity and is the subphase density. Buzza Buzza (2002) recently proved that the model Eq. 3, which is commonly found in the literature Lucassen-Reynders and Lucassen (1969); Langevin (1992), is correct but that even under dynamical conditions the surface tension should be considered as a real quantity, equal to the equilibrium static surface tension 111 The model often used in the literature is over-parametrized. Data analysis with the correct physical parameters is very robust.. As derived in ref. Langevin and Bouchiat (1971), the spectrum of light scattered by thermal roughness is given by:
| (4) |
SQELS data is fitted with Eq. 3 and Eq. 4, with only three physical parameters to be determined. Details of our experimental methods, including calibration, data analysis and limits of the technique, are described in ref. Cicuta and Hopkinson (2003).
In polymer systems, different models are appropriate depending on the lengthscales and timescales that are being observed. The lengthscales probed with SQELS satisfy , so the semidilute solution is expected to be in a “macroscopic” regime where it behaves like a gel de Gennes (1976). The gel’s response is characterized by a rigidity modulus, , scaling like the number of contacts, hence proportional to the osmotic pressure, and by a viscous dissipation modulus describing the friction involving the monomers and the solvent. This is well established in three dimensional solutions, where both a fast and a slow relaxation mode can be probed simultaneously, for example with dynamic light scattering Brown (1993). The fast relaxation can be described within the Rouse model and is related to a cooperative diffusion timescale de Gennes (1976). This describes fluctuations that become faster as the concentration increases and the correlation length decreases. The slow relaxation is related to the self diffusion coefficient for reptation and is determined by the time required for the chain to diffuse along its length. is an increasing function of the concentration. The approach of directly measuring the frequency spectrum of light scattered by concentration fluctuations is not possible in monolayers because there is insufficient optical contrast, and dynamics can be probed only by indirect methods such as SQELS.
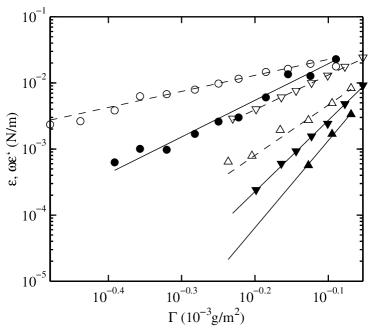
Figure 3 shows the components of the monolayer viscoelatic moduli, measured with SQELS for different polymer monolayers. Both the elastic and viscous components of exhibit a power law dependence on the concentration:
| (5) |
A similar scaling behavior was recently reported by Monroy et al. Monroy et al. (1999) but has not been explained 222An attempt in ref. Monroy et al. (1999) to understand the scaling of within the Rouse model predictions for gave a dimensionally wrong result, which clearly has no physical meaning.. Results for all the systems considered in this work are summarized in Table 1. Monolayers of very different compositions, comprising both synthetic polymers and proteins, have been studied, to cover the widest possible range of values of . The temperature, ionic strength and H of the liquid subphase are all controlled, as they affect the chain configuration at the surface.
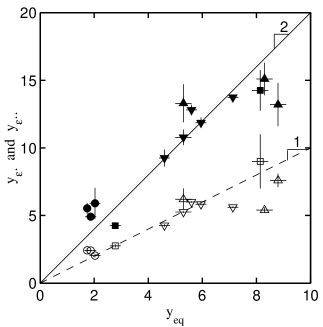
This data contains a wealth of information. Looking at Fig. 3, it can be clearly seen that for each monolayer the viscosity scales with a higher power than the elastic modulus. On general dimensionality terms, the viscosity can be regarded as the product of the modulus driving the relaxation and a characteristic time de Gennes (1979): . From this it immediately follows that the timescale of these relaxations becomes longer the higher the concentration, hence a slow mode is being probed. The character of this mode can be read from Figure 4, where the power law exponents for defined in Eq. 5 are plotted against the equilibrium exponent. It is not surprising to find that , since the thermal fluctuations probed with SQELS fall within linear response theory. What is of interest is the apparently universally valid relation between the exponents for the elastic and the viscous components of : . It finally follows that the timescale of these fluctuations, which we shall call , scales like .
| Polymer | Conditions | Ref. | |||
|---|---|---|---|---|---|
| PVAc | T=45oC | Cicuta and Hopkinson (2003) | 2.0 | 2.0 | 5.9 |
| PVAc | T=25oC | Cicuta and Hopkinson (2003) | 1.9 | 2.4 | 5.5 |
| PVAc | T=6oC | Cicuta and Hopkinson (2003) | 1.7 | 2.4 | 5.5 |
| PVAc | T=25oC | Monroy et al. (1999) | 2.8 | 2.8 | 4.3 |
| -casein | H=5.3, 0.01M | Cicuta and Hopkinson (2001) | 7.1 | 5.6 | 13.7 |
| -casein | H=7.2, 0.01M | Cicuta and Hopkinson (2001) | 6.0 | 5.8 | 11.9 |
| -casein | H=8.3, 0.001M | Cicuta and Hopkinson (2001) | 5.6 | 6.0 | 12.8 |
| -casein | H=8.3, 0.01M | Cicuta and Hopkinson (2001) | 5.3 | 5.3 | 10.8 |
| -casein | H=7.6, 1.1M | Cicuta and Hopkinson (2001) | 4.6 | 4.3 | 9.3 |
| -lg | H=6.0, 0.02M | cicutaphd | 8.3 | 5.4 | 15.1 |
| -lg | H=8.3, 0.02M | cicutaphd | 5.3 | 6.2 | 13.3 |
| -lg | H=5.9, 0.1M | cicutaphd | 8.8 | 7.6 | 13.2 |
| P4HS | H=2, T=25oC | Monroy et al. (1999) | 8.1 | 9.0 | 14.3 |
We are only able to speculate on the physical origin of this timescale. A simple explanation is that the slowing down of as the concentration increases is due to friction between the increased number of statistically independent blobs. The number of contacts in between blobs is proportional to , giving:
| (6) |
which describes the data of Fig. 4 very well. An analogy can be drawn between the diverging viscosity of the close-packed arrangement of blobs in the semi-dilute regime and the case of diverging viscosity of spheres at high packing density Brady (1993), both being determined by the number of contacts.
A question that arises is why this mode is not seen in 3d. In bulk solutions in a good solvent a dynamical mode analogous to that just described for 2d would have a characteristic relaxation time scaling with the concentration like . This is a higher power of the concentration compared to reptation ()de Gennes (1979), in agreement with the well known result that in 3d solutions the fluctuations relax via the self diffusion of the polymer chain and not the mechanism outlined above. In 2d relaxation by reptation is hindered by an effective confinement provided by neighboring chains.
In summary, it has been shown that the thermal concentration fluctuations in the semi-dilute regime of polymer monolayers reported in the present paper and in ref. Monroy et al. (1999) have a slow mode of decay with a timescale that had not been previously considered and that describes a specifically 2d process.
Acknowledgements.
We thank E.M.Terentjev for very useful comments and discussions.References
- Gaines (1960) G. L. Gaines, Insoluble Monolayers at Liquid-Gas Interfaces (Wiley, New York, 1960).
- Vilanove and Rondelez (1980) R. Vilanove and F. Rondelez, Phys. Rev. Lett. 45, 1502 (1980).
- de Gennes (1979) P.-G. de Gennes, Scaling Concepts in Polymer Physics (Cornell University Press, Ithaca, 1979).
- Stone et al. (2003) H. A. Stone, S. A. Koehler, S. Hilgenfeldt, and M. Durand, J. Phys.: Condens. Matter 15, 283 (2003).
- Buzza et al. (1995) D. M. A. Buzza, C.-Y. D. Lu, and M. E. Cates, J. Phys. II France 5, 37 (1995).
- Doi and Edwards (1986) M. Doi and S. F. Edwards, The Theory of Polymer Dynamics (Oxford University Press, New York, 1986).
- Langevin (1992) D. Langevin, Light Scattering by Liquid Surfaces and Complementary Techniques (Dekker, New York, 1992).
- (8) see these papers and references within: D. Langevin, J. Coll. and Interface Sci. 80, 412 (1981); A. J. Milling, R. W. Richards, R. C. Hiorns, and R. G. Jones, Macromolecules 33, 2651 (2000); J. C. Earnshaw, Adv. Coll. Interface Sci. 68, 1 (1996); J. C. Earnshaw, R. C. McGivern, A. C. McLaughlin, and P. J. Winch, Langmuir 6, 649 (1990); A. R. Esker, L. Zhang, B. B. Sauer, W. Lee, and H. Yu, Colloids and Surfaces A 171, 131 (2000) and M. Kawaguchi, B. S. Sauer, and H. Yu, Macromolecules 22, 1735 (1989).
- Coniglio et al. (1987) A. Coniglio, N. Jan, I. Majid, and H. E. Stanley, Phys. Rev. B 35, 3617 (1987).
- Maier and Rädler (1999) B. Maier and J. O. Rädler, Phys. Rev. Lett. 82, 1911 (1999).
- Miller et al. (1996) R. Miller, R. Wüstneck, J. Krägel, and G. Kretzschmar, Colloids and Surfaces A 111, 75 (1996).
- Cicuta et al. (2003) P. Cicuta, E. J. Stancik, and G. G. Fuller, Phys. Rev. Lett. 90, 236101 (2003).
- Buzza (2002) D. M. A. Buzza, Langmuir 18, 8418 (2002).
- Lucassen-Reynders and Lucassen (1969) E. H. Lucassen-Reynders and J. Lucassen, Advances Coll. and Interface Sci. 2, 347 (1969).
- Langevin and Bouchiat (1971) D. Langevin and M. A. Bouchiat, Comptes Rendus Acad. Sci. 272B, 1422 (1971).
- Cicuta and Hopkinson (2003) P. Cicuta and I. Hopkinson, submitted 00, 00 (2003).
- de Gennes (1976) P.-G. de Gennes, Macromolecules 9, 587 (1976).
- Brown (1993) W. Brown, Dynamic light scattering. The methods and some applications (Clarendon Press, Oxford, 1993).
- Monroy et al. (1999) F. Monroy, F. Ortega, and R. G. Rubio, J. Phys. Chem. B 103, 2061 (1999).
- Cicuta and Hopkinson (2001) P. Cicuta and I. Hopkinson, J. Chem. Phys. 114, 8659 (2001).
- Brady (1993) J. F. Brady, J. Chem. Phys. 99, 567 (1993).
- (22) P. Cicuta, Ph.D. Thesis, Univ.Cambridge, (2003).