Pressure induced suppression of the singlet insulator phase in BaVS3: infrared optical study
Abstract
The metal-insulator (MI) transition in BaVS3 has been studied at ambient pressure and under hydrostatic pressure up to kbar in the frequency range of cm-1. The charge gap determined from the optical reflectivity is enhanced, . This ratio is independent of pressure indicating that the character of the transition does not vary along the phase boundary. Above the critical pressure, kbar, metallic spectra were recorded in the whole temperature range, as expected from the shape of the phase diagram. Our results exclude the opening of a pseudogap above at any pressure. Below an unusually strong temperature dependence of the charge gap was observed, resulting in a deviating strongly from the mean field-like variation of the structural order parameter.
pacs:
A class of symmetry breaking phase transitions, characterized by an anomalously large gap parameter, has recently attracted much attention and has been investigated intensely in the wider framework of strongly correlated electron systems. Though in some manganites and nickelates the huge enhancement of the ratio, sometimes as large as , is accompanied by the opening of a pseudogap above Katsufuji ; Kim , in most cases a mean-field-like temperature dependence of is observed. In contrast, in first order metal-insulator transitions a more drastic, often discontinuous opening of the charge gap is seen. On the other hand, the transition in the inorganic spin-Peierls system CuGeO3 looks almost like a first order one, as the opening of the singlet-triplet gap is much sharper than the BCS functional form and follows with instead of Michael . In BaVS3, the detailed temperature dependence of neither the spin gap nor the charge gap has been measured so far. The present study of the infrared (IR) optical properties demonstrates that electron correlations play crucial role in BaVS3: they lead to a large enhancement of the ratio and simultaneously give rise to an abrupt temperature dependence of .
At ambient pressure BaVS3 exhibits a phase transition from a high-temperature paramagnetic “bad metal” phase to a low-temperature singlet insulator state at K Mihaly . This is a second order phase transition, as it has been pointed out recently by the comparison of the anomalies observed in different thermodynamic properties Kezsmarki . The observation of the crystal symmetry lowering Inami in more recent X-ray experiments provided direct evidence for the second order character of the transition at K.
The metallic nature of the compound is enhanced by the application of hydrostatic pressure and the transition temperature is suppressed at an average rate of kbar Graf ; Forro . The critical pressure above which the metallic phase extends over the whole temperature range is kbar Forro . The suppression of the insulating phase is accompanied by a monotonic decrease of the spin gap Kezsmarki . Moreover, the phenomenon occurring at K at ambient pressure has been described as a spin-Peierls-like transition. Its order parameter, , scales with the transition temperature as a function of pressure according to thesis . This indicates that the character of the phase transition does not change under pressure.
Dc conductivity measurements clearly demonstrate the opening of a charge gap () note . However, the magnitude and temperature dependence of can not be determined unambiguously: the purity of the sample has a strong influence on the transport in the insulating phase, and the activation energy obtained from the dc conductivity is temperature dependent. The results vary between K and K Nakamura ; Graf . The photoemission threshold energy obtained by Nakamura et al. Nakamura corresponds to an intermediate value, K.
The present IR optical study reveals the magnitude and temperature dependence of the charge gap at ambient pressure. We also find that the ratio is independent of pressure. However, in contrast to , that is very close to the BCS ratio, the measured is times larger. The charge gap represents a higher energy scale in the system.
Infrared reflectivity of BaVS3 single crystals has been measured in the frequency range of cm-1, between room temperature and K, at several pressures up to kbar. The incident light was unpolarized, and nearly perpendicular to the rectangular (, cleaved surface of the sample. Since the small spotsize of the beam and the high intensity in the FIR range were crucial requirements for this study most of the measurements were done at the U10A beamline of the National Synchrotron Light Source of the Brookhaven National Laboratory, with a Bruker 66v/S spectrometer. At ambient pressure the sample was mounted on the cold finger of a helium flow cryostat. The reflectivity data were referenced to the reflectivity of a gold mirror, also mounted on the cryostat. Some of the data below cm-1 were taken in a Bruker 113v spectrometer, using the internal source, with a Au film evaporated to the surface of the sample to act as a reference. The same crystal was also studied in a custom designed self-clamping pressure cell. Optical access was achieved through a cylindrical natural diamond, with wedged plane surfaces to eliminate interference fringes, and to facilitate reference measurements. The large (mm) window size and the absence of low-frequency absorption allowed investigations down to cm-1. We used the light reflected from the outer surface of the diamond (vacuum-diamond boundary) as a reference signal. The sample was mounted on the inner surface of the diamond, and the angle of wedging between the two surfaces allowed for a clean separation of the reference and sample reflection. Besides the optical access, an electrical leadthrough was also implemented, and the pressure was monitored in situ by an InSb sensor. The pressure cell was also cooled by the He flow cryostat.
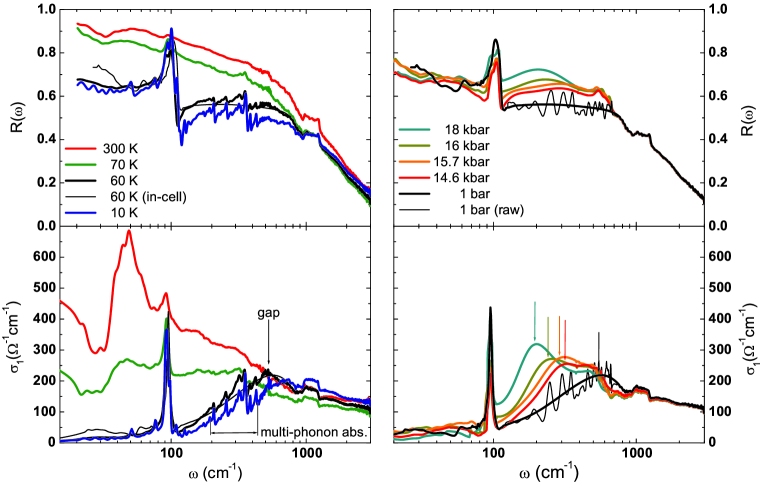
The left panel in Fig. 1 summarizes the evolution of the optical spectra as a function of temperature at ambient pressure. The evaluation of the spectra in the pressure cell, shown in the right panel of Fig. 1, was done the following way thesis . In order to eliminate interference fringes due to the thin film of the pressure medium formed between the sample and the diamond, at each pressure we calculated the ratio of the insulating and metallic phase reflectivity measured usually with K below and above the transition. At kbar this ratio, obtained as the quotient of the K and K spectra, is in the whole range verifying the lack of the metal-insulator transition. At pressures smaller than we then evaluated the absolute reflectivity of the insulator according to
| (1) |
where and are the raw data obtained at a given pressure below and above , respectively and is the out-of-cell ambient pressure metallic curve, which served as a standard. This evaluation does not influence the structure of the spectra since, (i) in the metallic state of BaVS3 the reflectivity has a weak and monotonic temperature dependence with a relative change % at any of the investigated pressures, and (ii) the high-temperature dc conductivity is not very sensitive to the pressure as at room temperature Forro . After calculating the reflectivity by Eq. 1 some remains of the interference fringes are still superimposed on the data. In order to better visualize the results, we smoothed out this oscillation in the reflectivity by interpolation and then applied the Kramers-Kronig transformation as it is shown in case of the “1 bar”, low temperature measurement in the right panel of Fig. 1. This step effectively lowers the frequency resolution, and it results in the smearing out of the phonon peaks in the range of cm-1; however, it also allows a better determination of the charge gap. The agreement between the ambient pressure insulating spectra obtained inside and out of the pressure cell is demonstrated in the left panel of Fig. 1.
Above the raw data clearly correspond to metallic behavior: the reflectivity tends approaching zero frequency, as clearly and directly shown in the ambient pressure measurements. In contrast, below the low-frequency reflectivity is constant. Due to the vanishing electronic screening the phonon resonances sharpen. The dominant phonon peak around cm-1 is clearly observable below K at ambient pressure and at every pressure as long as the metal to insulator transition takes place. Similarly to the isostructural BaTiS3 and BaNbS3 Ishii , this peak is due to two, closely centered, modes. Both of them correspond to the motion of the barium relative to the sulfur octahedron and the embedded atom (in our case the vanadium). In terms of the optical conductivity, the key finding is the complete suppression of the low-frequency spectral weight below , due to the development of the charge gap. At high frequencies the difference between the metal and the insulator disappears and above cm-1 all the curves essentially converge. At lower frequency the conductivity goes through a gradual increase and reaches a maximum whose frequency is identified with the gap value (pointed by arrows in Fig. 1). The value of the low-temperature gap at ambient pressure agrees well with the gap derived from the photoemission data of Ref. Nakamura, .
The single particle excitations below the gap, if exist, cannot be distinguished from the contribution of a multi-phonon absorption in the cm-1 range. The dominance of this phonon branch is visible in case of the ambient pressure measurement note2 . Note that in the same energy scale in-gap impurity states may also give rise to an enhancement of the conductivity.
The charge gap is cmK at ambient pressure and it is reduced by the applied pressure as the maximum is shifted to lower frequencies. At kbar neither the opening of the gap nor the sharpening of the cm-1 phonons can be detected indicating that the material remains metallic. This is in agreement with the shape of the phase boundary and the value of the critical pressure kbar determined by resistivity measurements Forro .
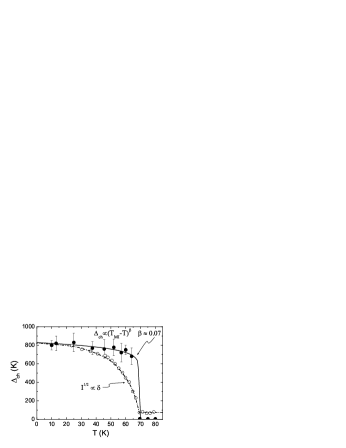
As the temperature is lowered, the onset of the insulating state is rather abrupt, and we observed only a weak change in the reflectivity spectra of the insulator between and K at any pressure. The temperature dependence of the charge gap is shown in Fig. 2. The opening of the gap can be contrasted with the temperature dependence of the structural distortion, measured by Inami et al. Inami . Below the transition temperature the intensity of the superlattice reflection was found to linear in , suggesting that the structural order parameter has a BCS-like temperature dependence, i.e. . The onset of the insulating state much more sharp in the charge excitations; % of the zero temperature gap is already reached at . In a wide range below the temperature variation can be described by with .
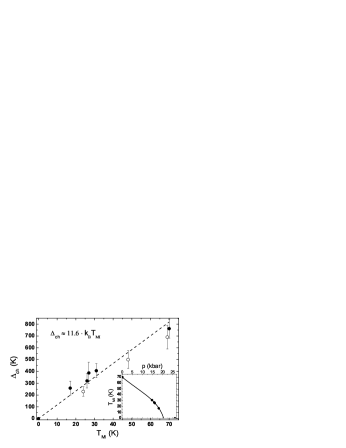
In contrast to the optical gap, the activation energy derived from the dc conductivity experiments is influenced by the impurity concentration. In a separate study we have investigated the dc transport of the several samples under pressure. The resistivity of the cleanest sample increased nine order of magnitude from down to K at ambient pressure. Although its temperature dependence slightly deviates from the Arrhenius law one can estimate the gap within % error and find K. The magnitude and the pressure dependence of the charge gap determined by IR spectroscopy and dc transport agree fairly well as shown in Fig. 3. In the kbar range the following scaling relation holds:
| (2) |
Finally, we shortly discuss two basic effects which could be responsible for the large value of the gap parameter, . One possibility is that the transition temperature could be much larger, but strong fluctuations suppress the development of the ordered state. When the insulating state develops, the gap rapidly reaches the large value corresponding the the ”mean field” transition temperature. In BaVS3 such fluctuations may be induced by the competition of different orderings like in La1-xCaxMnO3 () where ferromagnetic and charge order (CO) coexist in a limited region of the phase diagram Kim . A wide precursor range can also arise from the low dimensionality of the system as it is the case in many CDW or SDW compounds or in La1.67Sr0.33NiO4 where the presence of fluctuating charge stripes are observed well above Katsufuji . However, the dynamical fluctuations due to the preexisting short range order are usually manifested in the formation of a pseudogap; this possibility may be excluded by our IR study.
Another explanation is that the charge gap is affected by the electron-electron interaction. Such a correlation-driven enhancement of the gap is though to be present in several manganites like Bi1-xCaxMnO3 () Liu , Pr0.6CaMnO3 Okimoto and La1-xCaxMnO3 () and in the nickelate NdNiO3 Katsufuji2 where the gap parameter is , , and , respectively. The temperature dependence of the gap in all of the above cited compounds fairly follows the BCS functional form while in BaVS3 the transition appears in in a much sharper manner. In this sense BaVS3 can rather be related to the spin-Peierls system CuGeO3, where a similarly strong temperature dependence of the singlet-triplet gap with an exponent of is detected by neutron scattering Michael . A microscopic theory describing the metal to insulator transition and the “pressure-magnetic field-temperature” phase diagram Kezsmarki ; Forro ; thesis of BaVS3 is highly desirable.
In conclusion, our FIR optical study supplied a detailed experimental description of the evolution of the charge gap in BaVS3 as a function of pressure and temperature. We have shown the lack of a pseudogap above the phase transition and a strong deviation of from the BCS-type structural order parameter has been found. These results show that BaVS3 belongs to a novel class of correlated systems where the onset of transition appears in a remarkable different way in the lattice structure and the electron system.
The authors are grateful to P. Fazekas for several indispensable discussions. This work was supported by the Hungarian Research Funds OTKA TS040878, T037451. A part of this work has been carried out at the National Synchrotron Light Source at Brookhaven National Laboratory, which is supported by the U.S. Department of Energy, Division of Materials Sciences and Division of Chemical Sciences, under Contract No. DE-AC02-98CH10886.
References
- (1) K. H. Kim, S. Lee, T. W. Noh, and S.-W. Cheong, Phys. Rev. Lett. 88, 167204 (2002).
- (2) T. Katsufuji, T. Tanabe, T. Ishikawa, Y. Fukuda, T. Arima, and Y. Tokura, Phys. Rev. B54, 14230 (1996).
- (3) Michael C. Martin, G. Shirane, Y. Fujii, M. Nishi, O. Fujita, J. Akimitsu, M. Hase, and K. Uchinokura, Phys. Rev. B53, R14713 (1996).
- (4) G. Mihály, I. Kézsmárki, F. Zámborszky, M. Miljak, K. Penc, P. Fazekas, H. Berger, and L. Forró, Phys. Rev. B61, R7831 (2000).
- (5) I. Kézsmárki, Sz. Csonka, H. Berger, L. Forró, P. Fazekas, and G. Mihály, Phys. Rev. B63, R81106 (2001).
- (6) T. Inami, K. Ohwada, H. Kimura, M. Watanabe, Y. Noda, H. Nakamura, T. Yamasaki, M. Shiga, N. Ikeda, and Y. Murakami, Phys. Rev. B66, 73108 (2002).
- (7) T. Graf, D. Mandrus, J. M. Lawrence, J. D. Thompson, P. C. Canfield, S. W. Cheong, and L. W. Rupp, Phys. Rev. B51, 2037 (1995).
- (8) L. Forró, R. Gaál, H. Berger, P. Fazekas, K. Penc, I. Kézsmárki, and G. Mihály, Phys. Rev. Lett. 85, 1938 (2000).
- (9) A more elaborated discussion revealing the analogy with spin-Peierls systems and a detailed analysis of the optical spectra measured under pressure is given in I. Kézsmárki, Ph.D. Thesis (2003), http://dept.phy.bme.hu/∼kezsmark/thesis.pdf.
- (10) In our notation is the entire energy needed for the charge excitation, not its half. The same convention is followed in case of the spin gap, .
- (11) M. Nakamura, A. Sekiyama, H. Namatame, A. Fujimori, H. Yoshihara, T. Ohtani, A. Misu, and M. Takano, Phys. Rev. B49, 16191 (1994).
- (12) M. Ishii and M. Saeki, Phys. Status Solidi B 170, K49 (1992).
- (13) In contrast to the vibrations at cm-1, only the vanadium and the surrounding sulfur octahedron are involved in these excitations. The highest energy phonon in this branch (appearing at cm-1 in BaVS3) has the largest oscillatory strength. In the two isostructural materials the spectrum are even more dominated by this mode.
- (14) H. L. Liu, S. L. Cooper, and S-W. Cheong, Phys. Rev. Lett. 81, 4684 (1998).
- (15) Y. Okimoto, Y. Tomioka, Y. Onose and Y. Otsuka, and Y. Tokura, Phys. Rev. B57, R9377 (1998).
- (16) T. Katsufuji, Y. Okimoto, T. Arima, Y. Tokura, and J. B. Torrance, Phys. Rev. B51, 4830 (1995).