Attraction between DNA molecules mediated by multivalent ions
Abstract
The effective force between two parallel DNA molecules is calculated as a function of their mutual separation for different valencies of counter- and salt ions and different salt concentrations. Computer simulations of the primitive model are used and the shape of the DNA molecules is accurately modelled using different geometrical shapes. We find that multivalent ions induce a significant attraction between the DNA molecules whose strength can be tuned by the averaged valency of the ions. The physical origin of the attraction is traced back either to electrostatics or to entropic contributions. For multivalent counter- and monovalent salt ions, we find a salt-induced stabilization effect: the force is first attractive but gets repulsive for increasing salt concentration. Furthermore, we show that the multivalent-ion-induced attraction does not necessarily correlate with DNA overcharging.
PACS: 87.15.Kg, 61.20.Ja, 82.70.Dd, 87.10.+e
I Introduction
During the last decade the question that concerns the possible existence of long-ranged attractive interactions between similarly charged objects in electrolyte solutions has been intensely debated. Experimental evidence of such an attraction is seen for deoxyribose nucleic acid (DNA) molecules [1, 2, 3, 4, 5, 6], colloidal rods [7], charged clay particles [8], charged microspheres [9, 10, 11] and charged plates [12, 13]. In particular, DNA molecules in solution are a paradigm for negatively charged polyelectrolytes due to ionization of its acidic phosphate groups [14]. The DNA conformations display a considerable sensitivity to the ionic surrounding. The mutual repulsion of DNA polyions has to be overcome to form compact or condensed DNA bundles. Experiments show that DNA condensation occurs when about 90 percent of its charge is neutralized by condensed counterions [1, 3, 15, 16]. Such a strong neutralization of the DNA charge could be achieved by divalent and higher-valent counterions [17, 18]. Besides of the phosphate neutralization, the multivalent ions induce an additional attraction between the DNA macroions mediated by strong correlation effects [16, 19, 20, 21, 22, 23, 24, 25, 26]. Thus the small ions play a complex role in DNA-DNA interactions and are not simply agents to screen the long-range electrostatic interaction. For example, they adsorb onto the DNA surface and can create bridges between the DNA molecules at small DNA-DNA separations, resulting in an ion cross-link attraction [24, 27].
The electrostatic interaction between highly charged polyelectrolytes is usually treated within the framework of classical double-layer theory [28]. This theory is based on the mean-field Poisson-Boltzmann equation [29, 30, 31, 32, 33, 34, 35, 36] and predicts a repulsion between similarly charged macromolecules. Though different modifications of Poisson-Boltzmann theory have been developed to account for ion-ion hard core correlations [37, 38, 39, 40], an attractive contribution in the double-layer theory is usually introduced via the van der Waals interaction forces [9, 41, 42, 43]. However, the van der Waals forces alone cannot explain the experimentally observed attraction, since the Hamaker constant extracted from the experiments is artificially high [9, 44, 45, 46].
Theoretical investigations and numerical simulations indicate that an attraction between similarly charged objects emerges beyond the mean-field approaches. It is now a well established fact that the charge correlations and fluctuations in highly charged electrolytes can induce an attraction between the macroions [23, 47, 48, 49, 50, 51, 52, 53, 54, 55, 56, 57, 58, 59, 60, 61, 62, 63, 64, 65, 66, 67, 68, 69]. Due to the very resemblance of the short DNA fragments to charged rods, the latter is a widely used toy model for the DNA molecule in theoretical treatments and computer simulations [24, 30, 63, 70, 71, 72, 73, 74, 75]. However, the details of DNA, such as the discreteness and helical structure of the DNA phosphate charges and the grooved shape of the DNA molecule, become essential as one approaches its surface. In this case, strictly speaking, all atom DNA simulations in molecular water would be a proper choice [76]. Unfortunately such sophisticated simulations can only be applied to small systems and small salt concentrations [77]. Thus, first, a devision of a “sophisticated” DNA model, which goes beyond the simple homogeneously charged cylinder model, and second, an investigation of the interaction forces between such DNA molecules, remains a challenging task.
This paper is an extension of our previous works on DNA electrostatics [78, 79]. In Ref. [78], simulation results for the DNA-DNA interaction were compared with the predictions of different linear theories for the case of monovalent ions. It was shown that the DNA-DNA interaction, at separation distances smaller than the Debye screening length, differs from the predictions of mean-field theories. This provides evidence that the intermolecular interaction depends not only on how many ions are in the DNA proximity (which is exactly what the ordinary linear theories rely on), but also on where those ions are located relative to the DNA structure, i.e., whether they penetrate into the grooves or not. In Ref. [79], on the other hand, a detailed distribution of ions of different valencies and molarities near the DNA surface was explored for a more realistic, grooved shape of the DNA molecule. The results obtained indicate that the paths of counterion and coion condensations strongly depend on the DNA surface geometry. Taking this into account we expect that the implemented DNA models with different geometries will also affect significantly the effective DNA-DNA interaction. Thus, in this paper, we will focus on the mechanism of attraction between two DNA molecules shaped similar to models introduced in Ref. [79]. Our goal is to see the effects, which increasing detail of various DNA models have on the DNA-DNA interaction. We show that the DNA shape is an essential contributor to the interaction force for multivalent counterions, whereas it has a minor effect on the interaction force for added multivalent salt. The origin of the attraction in the simple and sophisticated DNA models is different. For instance, a Coulomb depletion-like attraction [80] for the salt-free case depends on the implemented DNA model. It has been revealed that there is a non-monotonic force-salt dependence at a fixed DNA-DNA separation for added monovalent salt and divalent counterions. This is exemplified by the variation of the interaction force from a strong attraction towards a strong repulsion and a following decrease in magnitude. Detailed investigations connect this “salt-induced stabilization” to the entropic part of the total interaction force. We also address the competition between the multivalent counterion and the multivalent salt-induced attractions. It is shown that the increase of the divalent salt concentration at a fixed monovalent ion number drives the DNA-DNA interaction force into an attraction through the overcharging of DNA molecules. However, the DNA-DNA attraction induced by trivalent counterions decreases, while the DNA molecule gradually gets overcharged due to added divalent salt.
The reminder of paper is organized as follows. We give a short general overview of ion binding and DNA condensation in Section II. The system parameters and quantities studied in the present work are discussed in Section III. Sections IV and V contain simulation details and the implemented simulation techniques. The specific DNA configurations at short DNA-DNA separations are discussed in Section VI. Sections VII and VIII are devoted to simulation results for monovalent and divalent salt ions respectively. We conclude in Section IX.
II ion binding and DNA condensation
There are essentially two contenders for the dominant attractive force in the DNA condensation: hydration forces [81, 82] and correlated counterion charge fluctuations. Throughout this paper we neglect the granular nature of water and the solvent-induced forces [83], and concentrate only on the electrostatics of the DNA condensation. The water dielectric effects and hydration forces will be briefly (and qualitatively) discussed in Section IX.
Under physiological conditions, the DNA molecule is surrounded by an ionic atmosphere with a Debye screening length in the range of 5Å-10Å. Within the distances above the DNA surface, a nonlinear screening of the DNA phosphate charges takes place. Hence, if the surface-to-surface separation between two DNA molecules is less than , a nonlinear theory [84, 85, 86, 87] has to be applied. At surface-to-surface separation distances on the order of or beyond , Debye-Hückel theory (based on a linearized Poisson-Boltzmann treatment) is a reasonable approximation to describe the ionic atmosphere around the DNA molecule. In Ref. [78] we have examined several mean-field theories for their ability to match the numerically calculated DNA-DNA interaction forces: the homogeneously charged rod model, the Yukawa segment (YS) model, and the Kornyshev-Leikin (KL) theory [88]. For the case of an overall monovalency of counterions and salt ions, both the simulations [78] and the above mentioned theories reveal repulsive forces between the DNA molecules for all mutual orientations and separation distances. We have shown that, except for short separation distances, there is a qualitative agreement between the theoretical and numerical results if a proper charge and size renormalization in the former is performed.
For multivalent counterions and added salt ions, there is experimental evidence that the DNA molecules attract each other. Such an attraction is completely missed in the linear theories such as the homogeneously charged cylinder and YS model. In these theories all the nonlinear salt effects are again accounted for through the phosphate charge and screening length renormalization procedure. Only the mean-field KL theory predicts a DNA-DNA attraction for some DNA-DNA separations and azimuthal molecular orientations. In detail, the KL theory distinguishes between strongly condensed (also called as bound or adsorbed) and a cloud of diffusive (non-bonded) counterions. A tight adsorption is assumed to take place within the Stern layer of thickness =2Å, where is the Bjerrum length, is an average area per elementary charge on the DNA surface, is a dielectric constant of solution and is the thermal energy. The KL theory [88] predicts an attractive force between the two DNA molecules if the following conditions are fulfilled: i) more in-groove than on-strand condensation, ii) the right complementary alignment of the positively charged grooves on one helix facing the negatively charged strand on the other helix. In other words, the KL theory assumes that it is the DNA charge helicity that entails an intermolecular attraction for surface-to-surface distances in the range of Å. Theoretical results and computer simulations [35, 78, 89, 90, 91, 92, 93, 94], however, indicate that no charge-helicity effects extend further than few Å from the DNA surface. There is also experimental evidence [95] that at surface-to-surface separation distances comparable with the Debye screening length, the DNA-DNA separation does not affect the DNA orientation.
The discreteness of the DNA phosphates, explicitly taken into account by our DNA models, enhances the counterion concentration [96] and the surface adsorption of ions [97] through the increased Coulomb coupling between the phosphates and the counterions. This boosts the counterion correlations near the DNA surface [98]. Experiments indicate that the divalent counterions, depending on their in-groove or on-strand localization [99], have different impact on the DNA systems. Thus, the transition metals with higher affinity to the DNA bases[100, 101] condense on DNA [102, 103], while alkali metals do not [4, 103]. On the other hand, the chemical identity of the cation is a factor of minor importance compared with the magnitude of their charge when [3, 4, 16, 104, 105, 106, 107]. Thus the spermidine Spd3+ and spermine Spm4+ ions, abundant in living cells [108, 109, 110, 111], neutralize the negatively charged DNA backbone predominantly via the non-specific (Coulomb) interaction [112, 113, 114]. This is supported by new experiments [21, 115], polyelectrolyte and counterion condensation theories [116, 117, 118, 119], and computer simulations [89, 120].
III system parameters
A DNA Models.
The B form of DNA has an inner core of radius 9Å formed by nucleotide pairs, and two sugar-phosphate strands spiralling around it. The latter form the well-known double helix with a pitch length about 34Å [14]. There are two phosphate groups per base pair, and 10 base pairs per pitch length, or helical turn. The axial rise per base pair in the DNA long axis is 3.4Å, thus there is one elementary charge per each 1.7Å [121]. The average value of the angle between the adjacent base pairs is and the average distance between the neighboring charges on the DNA surface is about 7Å. This distance is much smaller than the helical pitch and of the order of Debye screening length under the physiological conditions. There is a small shift in the coordinate of two opposing phosphates belonging to different helices of DNA, Å.
Three DNA models, a cylinder model (CM), an extended cylinder model (ECM) and the Montoro-Abascal model (MAM), are considered. Our aim is to obtain a detailed understanding of the physical mechanism of ion-mediated DNA interactions, in particular how the geometry of different DNA models gives rise to new effects. The CM has a hard cylindrical core of diameter Å and two strings of monovalent phosphates of size Å. The KL theory, and almost all the Poisson-Boltzmann like theories and most of primitive model (PM) computer simulations, have utilized the CM as a simple DNA model. In the ECM, first designed by Lyubartsev et. al. [89], the helical grooves of DNA are incorporated through the shrinking of the DNA core to the size Å and swelling the phosphate spheres to the size Å. A grooved structure, which resembles the real DNA appearance, is achieved in the MAM [90] through the adding another neutral sphere between the cylindrical core and the charged phosphate sphere. The cylindrical core in the MAM has a diameter Å, the inner string of neutral spheres is centered at a radial distance Å, and the outer string of phosphates is centered at a radial distance Å. Both spheres have the same and coordinates and diameter Å. A full description of these models is given in Refs. [78, 79, 90].
In addition to the two DNA molecules the system contains counterions of charge , symmetric salt ions of concentration and charges and . All the small ions are modelled as a hard spheres of a diameter for counterions, and for the salt ions. The whole system is held at room temperature . The primitive model simulations with no explicit water deal only with a passive (non-specific) binding and completely neglect the specific binding of counterions to the DNA grooves. In this case the ion binding sites are determined by the steric and Coulombic interactions [79, 122].
The interactions between the mobile ions and the phosphate charges are described within the framework of primitive model as a combination of the excluded volume and Coulomb interactions reduced by the inverse of the dielectric constant of the solvent. The corresponding pair interaction potential between the different charged hard spheres is
| (1) |
where is an interparticle separation distance, and are indices denoting the different particles species. Possible values for and are (for counterions), (for positively and negatively charged salt ions), (for phosphate groups) and (for the neutral spheres in the MAM with =0). In addition, there is an interaction potential between the DNA hard cylinder and the free ions . This potential has a simple excluded volume form such that the free ions cannot penetrate into the cylinder.
B Simulated Quantities.
Our basic simulated quantity is the effective force [78, 80] between the DNA molecules
| (2) |
Here is the direct Coulomb force acting onto all the phosphate charges belonging to one helical turn of one DNA molecule as exerted from the phosphate groups of the other DNA,
| (3) |
The sum only runs over phosphates of one helical turn of the DNA molecule.
The second term corresponds to the Coulomb interactions between the phosphate charges and the mobile salt ions. This term describes the screening of the DNA charge,
| (4) |
The third term arises from the entropic contribution of small ions due to their excluded volume interaction with the DNA molecular surface . Its value for one helical turn is
| (5) |
where is a surface normal vector pointing outwards the DNA cylindrical core. This term becomes increasingly important as the Coulomb coupling parameter is elevated for the multivalent counterions [78, 80, 123, 124],
| (6) |
The parameter determines the importance of thermal fluctuations. When , the Coulomb interaction energy between the DNA and the surrounding salt ions dominates over the thermal fluctuations in system.
IV Computer Simulations
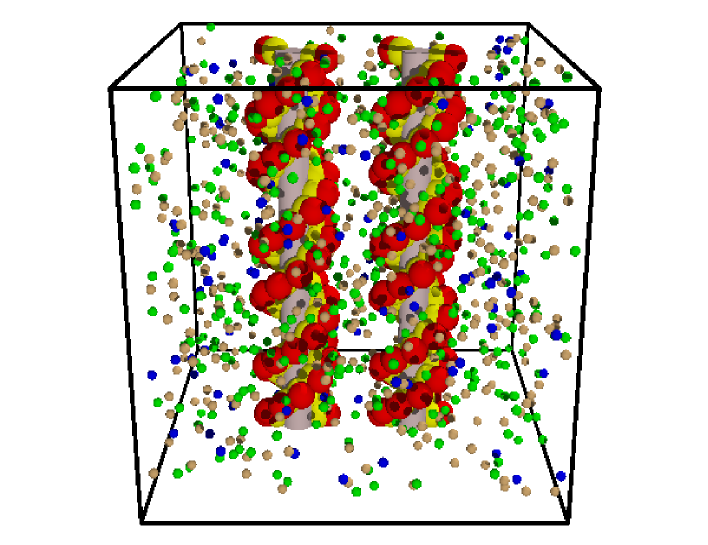
We consider two parallel DNA molecules, separated by a distance along the xy diagonal of the cubic simulation box of size and volume . The size of the simulation box Å corresponds to the three full turns of B-DNA [90]. The box also consists counterions and salt ions of both signs. The counterion concentration is fixed by the charge of DNA molecules in the simulation box due to the constraint of global charge neutrality. A typical snapshot of the simulation cell is illustrated in Fig. 1. Periodic boundary conditions in all three directions are applied to reduce the confined volume effects in electrolytes. The DNA replicas in z direction produce an infinitely long DNA molecule which avoids the end effects encountered in other molecular simulations of short DNA segments [125, 126, 127]. The phosphate spheres are monovalent, , where is an elementary charge. The total number of simulated salt ions is varied from 0 to 2000 depending on the salt concentration in the bulk. Hereafter we will refer to each simulation by its nominal salt concentration defined as a ratio between the total number of ions in the cell without the DNA molecules and the system volume , . The dielectric permeability is considered to be a constant everywhere in system, which avoids the need of electrostatic images [128, 129]. The long range interactions between the two charged species and their replicas in the neighboring cells are handled via the Lekner method [130] and its modification for the particular cases, when pair of interacting charges are sitting exactly on one of the coordinate axies (this case was considered in Appendix of Ref. [78]).
We have performed extensive molecular dynamics (MD) simulations for a range of different microion valencies. The simulated states are given in Table I. The ion diameter was chosen to be =3Å. This parameter defines the closest approach of the ion to the DNA surface and has a strong impact on the polyion electrostatics [20, 131, 132]. A test simulation for an increased ion diameter =5Å, which mimics the ion hydration in solvent [20, 79, 93, 132], shows no qualitative changes of the reported results. We want to emphasize again that specific ion effects, as exemplified by the Hofmeister effect [133, 134], are not accounted for in our model.
During the simulations, we calculate the interaction forces between the two DNA molecules for different separation distances . Due to the strong screening of the DNA phosphates, the actual salt concentration in the bulk of the simulation box , measured far away from the polyelectrolytes, is dependent and is always smaller than the nominal salt concentration , . Thus, an implementation of the conventional MD procedure with a fixed ion number will yield to the interaction forces which correspond to bulk densities for each intermolecular distance . This problem can be avoided by considering a solution with a constant a chemical potential via the Grand Canonical (GC) simulation method [67]. The GC simulation is a natural choice to mimic the experimental situation where the actual salt concentration of the ordered DNA phase is not known a priori. Instead, it is given by the thermodynamic condition that the chemical potential in the DNA solution has to be the same as in the bulk electrolyte phase with which it is in equilibrium and whose concentration is experimentally known. Thus the number of ions in the simulation cell is automatically adjusted to the specified value of chemical potential , which, in turn, is linked to the concentration of ions in the bulk phase [135, 136, 137, 138]. In the present paper a combination of different grand canonical molecular dynamics (GCMD) schemes is used which is optimally suited for our task.
V Grand Canonical Molecular Dynamics
In addition to the usual propagation of the particles, the conventional GC simulation technique [137, 138] consists of the creation of particle at a random position in the simulation box or destruction of a randomly chosen particle. Each of these moves is associated with a probability of acceptance, which is determined by the ratio of two Boltzmann factors. In application to electrolytes a modified GC method was devised in Refs. [71, 120, 139, 140, 141, 142], where the insertion or removal of a pair of ions of the same valency and opposite charge is done simultaneously to keep the system electroneutral. Unfortunately, these moves have relatively low acceptance rates for a dense and multivalent salt solutions [71], making the simulations inefficient. Special methods, similar to the cavity-biased method [141] and the gradual particle insertion method [143] developed for uncharged systems, have to be applied to overcome these obstacles in electrolytes. A biased insertion/destruction procedure, apt for an application to low temperature ionic fluids, is reported in Ref. [144].
Another challenge in the GC simulations is the apparent incompatibility of the deterministic and stochastic approaches. The dynamical information will be adversely affected when particles suddenly appear and disappear. This effect becomes even more pronounced for a non-homogeneous system [55, 56], like a DNA immersed in solution, where an artificial and unrealistic ion flow toward the DNA surface appears. This will further destabilize the system equilibrium. To minimize this inconsistency of the system dynamics, a method of local potential control (LPC), first introduced in Ref. [145], can be adopted. Within the LPC method, the creation and destruction of particles is restricted to a control volume. The other possibility is a procedure developed by Attard in Ref. [146], where the GCMD is performed with a fixed number of particles by coupling the variations in the system size to the instantaneous chemical potential determined by the virtual test particle method. This method also cures the low acceptance rates of particle insertions and deletions for dense systems. In the present simulations we take advantage of both the above mentioned methods [145, 146]. In detail, we first determine the specified nominal chemical potential of the bulk electrolyte in the absence of DNA molecules via a modified Widom method with multiparticle insertion [147, 148]. Then we match the actual chemical potential to the nominal chemical potential using a GCMD simulation similar to the method invoked in Ref. [145] and locate the control volume near the cell boundary. At each time step an equal but arbitrary number of creation/deletion attempts are made in the control volume. After a successful creation, a velocity is drawn from the Maxwell-Boltzmann distribution at a temperature and assigned to the new particle. In the first stage the particle number in the simulation box increases monotonically from its initial value given in Table I. Then approaches its saturated value and starts to fluctuate around it. This is followed by the fluctuation of instantaneous chemical potential around the . At this stage we fix the particle number and allow the system size to fluctuate according to procedure given by Attard in Ref. [146]. The fluctuations along the and directions ( direction is strictly bound to the DNA length) never exceed a few percents of the box size . Our test simulations with and without the Attard method [146] show the equivalence of the algorithms, with the former being much faster.
VI mutual DNA configurations
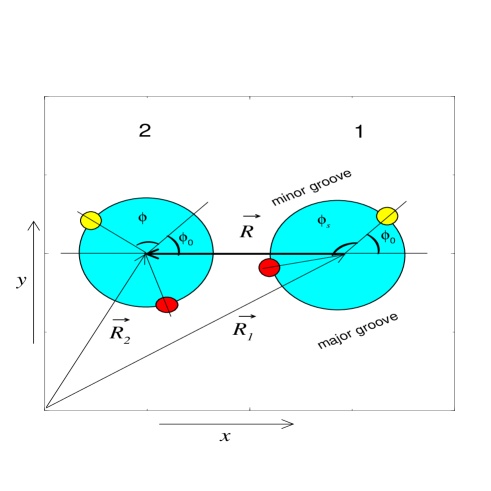
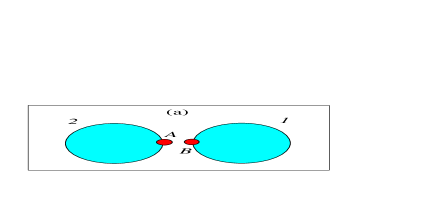
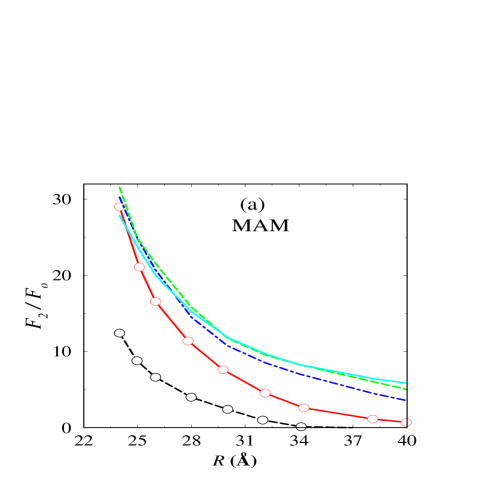
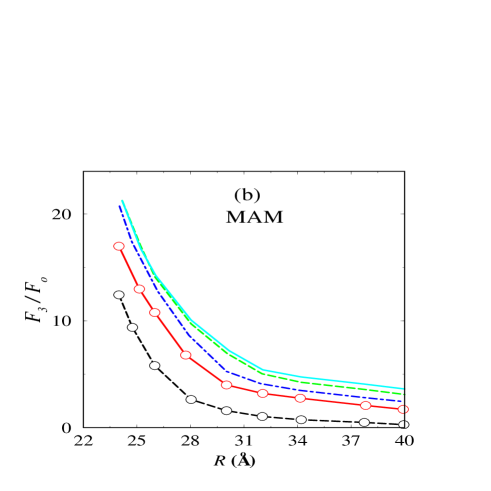
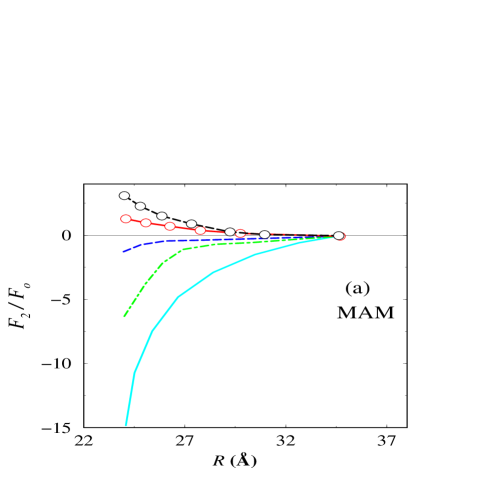
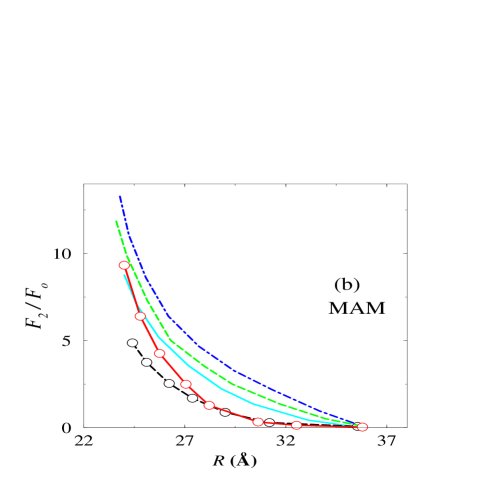
We calculate the total interaction force , Eq.(2), and its components and , compare Eqs. (4) and (5), respectively, for a given nominal salt concentrations . The direct phosphate-phosphate interaction , Eq.(3), does not depend on the salt density and its assessment is straightforward. It should be mentioned that in addition to the separation distance , there are three angular variables which define the mutual configuration of two DNA molecules. These variables, the azimuthal angles , and are shown in Fig. 2. The angle defines the widths of the DNA grooves [79] in the xy plane, it is for the CM and ECM, and for the MAM. The parameter is the angle between the phosphate charge and the DNA-DNA separation vector and characterizes the discrete location of the phosphate charges along the strands. All the results for the DNA-DNA interaction are periodic in with a periodicity of . The angle describes the rotation of the second DNA cylinder around its long axis with regard to the first DNA cylinder. There are five particular DNA-DNA configurations which make a strong contribution to the interaction force at short separation distances [78]. Three of these configurations correspond to the case when the phosphate charges of neighboring DNA molecules are “touching”, see Fig. 3. The other two particular configurations correspond to the so called “DNA zipper”situation, when the strands of one DNA stand against the grooves of the neighboring DNA [149]. This happens when regardless the value of . Our previous [78] and present simulations prove that the interaction force does depend on the mutual DNA configurations at a short separation distances Å, or when the surface-to-surface distance between the two DNA molecules is less than 5Å. This follows mainly from ion bridging between the two neighboring phosphates via a positive salt ion in configurations pictured in Fig. 3, or from sharing an adsorbed salt ion in one DNA groove and on the other DNA strand in the DNA zipper configurations. A short range attractive interaction between the charged rods arising from interlocking counterions, also sometimes called counterion cross-links, between the rods has been investigated in Ref. [24, 150, 151]. In fact, for such small separations, comparable with the solvent particle size, discrete solvent effects will show up in vitro [82, 97]. On the other hand, the multivalent ions increase the hydrodynamic radius of the DNA molecule, which in turn makes it unlikely for two neighboring DNA molecules to come closer than the contact shell-to-shell distance [132]. Arguments against the existence of cross-links for multivalent ions are given in Ref. [1] in order to explain the fluidity of the condensed phase of DNA system. X-ray scattering experiments in DNA aggregates a show that the surface-to-surface spacing between the DNA helices is only about one or two water molecule diameters [150]. Thus, numerical results for small DNA separations, accessible in simulations but subject to a complicate statistical averaging procedure, bear no physical meaning to match the experimental results. For larger separation distance, Å we find no detectable dependence of the interaction forces on the azimuthal angles and . This is in accordance with the early reports [35, 89, 90, 91, 92, 93, 94] that the helicity and discreteness effects of the DNA charges are generally small and dwindles a few angstroms away from the DNA surface. In all figures hereafter we show the interaction forces starting from the distances Å. The interaction forces are scaled per DNA pitch, i.e. per 10 DNA base pairs. A positive sign of the forces denotes a repulsion, while a negative sign denotes an attraction. The cases of monovalent and multivalent salt ions are considered separately.
VII Simulation results for monovalent salt.
A Monovalent Counterions.
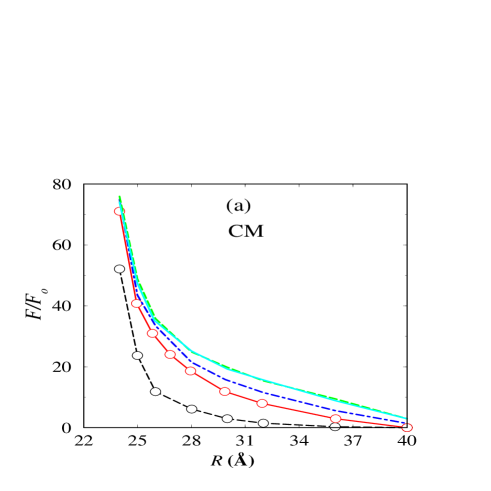
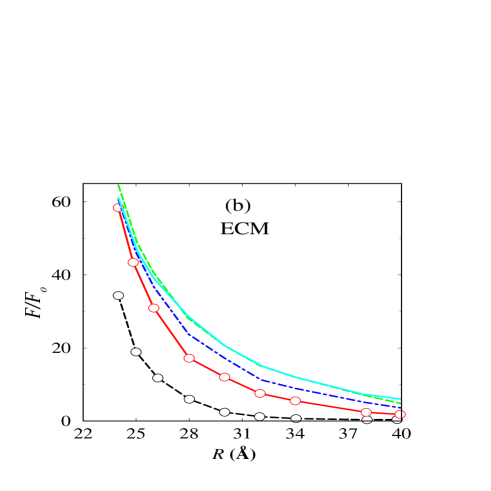
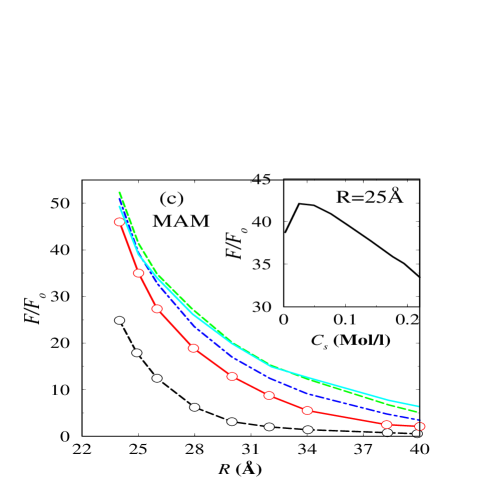
The calculated DNA-DNA interaction forces for monovalent salt and counterions are depicted in Fig. 4. All three DNA models exhibit a repulsion between the DNA molecules for all calculated separation distances and salt densities shown in Fig. 4 [2, 78]. The repulsion in the CM is roughly twice as strong as in the MAM. This is a result of grooved nature of the MAM where the vast majority of adsorbed counterions sits in the minor groove [79]. The salt dependence of the force at a fixed, small separation appears to be non-monotonic. This is clearly visible only for the ECM and MAM but hardly detectable for the CM. In detail, if the salt molarity is increased from =0 mol/l to = 0.024 mol/l, the repulsion at short distances becomes stronger, see the inset of Fig. 4c. Though this trend is at odds with the classical screening theories, a similar effect has already been reported in Ref. [78, 124]. A detailed consideration of the interaction force components in Fig. 5 reveals that the non-monotonicity of the interaction force has a purely electrostatic origin. Both the electrostatic force and the entropic force are repulsive for all indicated salt densities; the non-monotonicity is only contained in . The non-monotonicity is a tiny effect for monovalent ions, but for the divalent counterions and monovalent salt, this non-monotonicity aggravates and induces a switch from attraction to repulsion, see the next subsection.
B Divalent Counterions.
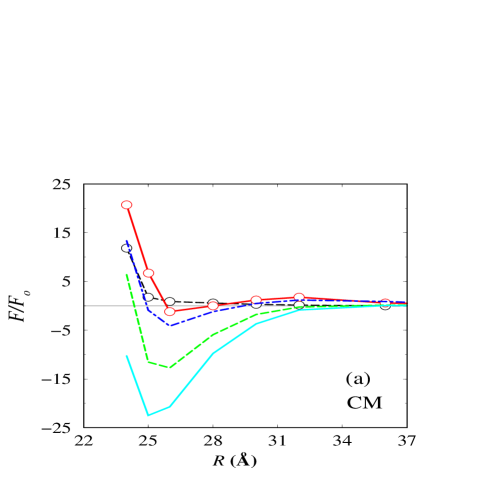
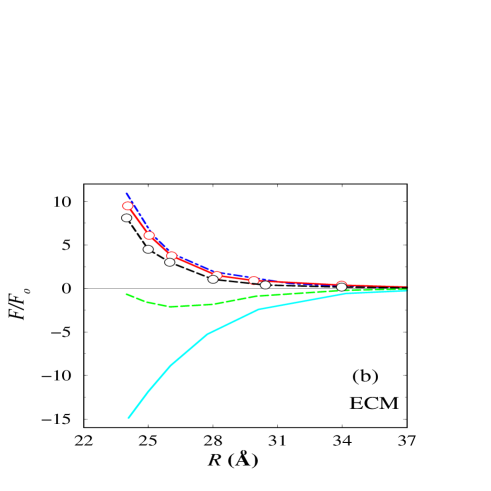
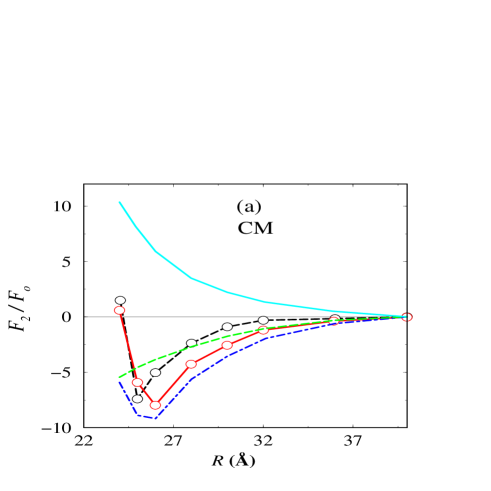
The interaction forces for divalent counterions and monovalent salt, given in Fig. 6, reveal a DNA-DNA attraction for small added salt concentrations. First we analyze the salt free case, when the attraction in the CM is nearly three times stronger than in the MAM. The origin of these attractions in the CM and MAM is completely different. In the cylindrical model the attraction is totally associated with the "Coulomb depletion” effect [80, 152]. Such an ion depletion is related to the formation of strongly correlated counterion liquid on the DNA surface. According to the results of Ref. [79], the dense spots of counterion liquid are mostly associated with the DNA phosphates. For short DNA-DNA separations, when the mean separation distance between counterions on the DNA surface exceeds the separation distance , the two strongly correlated counterion clouds on the different DNA rods start to repel each other. As a result, the local density of ions in the inter DNA area becomes less than its value on the outside area. This in turn leads to a unbalanced pressure from the outer counterions [153], which implies an attraction, as proven by the solid lines in Fig. 7. It is worth to mention that in Ref. [80] such a correlation mechanism was reported for a spherical colloid with a central charge in a low dielectric medium. Surprisingly, for the cylindrical macroions with a discrete surface charge considered here, we recapture a similar effect. Note that our results do not support the implications of Ref. [118], where an attractive force between the two rodlike polyions is assumed to be mediated by the sharing of condensed counterions.
Contrary to the CM, the attraction in the MAM and ECM has a purely electrostatic origin, as proven by Fig. 8. There are more ions in the inter DNA-DNA area compared to the outer DNA-DNA area. The range and strength of this attraction is higher for the ECM than for the MAM. To our believe, this is due to the different counterion condensation patterns on the DNA surface in the MAM and ECM. In the latter model the ions predominantly adsorb to the DNA strands and in the minor groove. Therefore they occupy more DNA surface area compared to the MAM, where the main destination of the ion adsorption is the minor groove of DNA [79]. According to a simple intuitive picture, the adsorbed divalent counterions form a strongly correlated fluid on each DNA surface. A mutual arrangement of these two neighboring shells with a minimal potential energy gives rise to the attractive electrostatic force between the DNA molecules.
Upon an addition of monovalent salt, the trend in the interaction force depends sensitively on the DNA shape which is modelled differently in the CM, ECM and MAM. In the CM the DNA-DNA attraction persists to high salt concentrations. Only at short separations and dense salt the interaction has a repulsive branch. However, there is a counterintuitive behavior of the force-salt dependence in the ECM and MAM: a small increase in the salt concentration suppresses the attractive interaction force . As increases further, the DNA-DNA interaction force becomes strongly repulsive over a broad range of separation distances. At even higher , the interaction force is completely screened out and descends toward zero in accordance with the classical double layer theories. We denote this trend salt-induced stabilization. It is in complete contrast to salt-induced destabilization or salt-induced coagulation which is typical for charged colloids [154, 155, 156]. The force-salt dependence at a fixed separation distance is shown in the inset of the Fig. 6c. To explain the mechanism of salt-induced stabilization, we separately plot the interaction force components in Fig. 7 and Fig. 8 for the CM and MAM, respectively. As the salt density is increased, the entropic force in the CM first changes its sign from an attraction to a repulsion, then falls back to zero from above. The electrostatic force in the CM behaves in a similar manner but with opposite sign. It first goes down from the positive to the negative values, then approaches zero from below. Hence, at higher salt densities the attraction, seen in Fig. 7, is electrostatically driven.
Contrary to the CM, the non-monotonicity of the interaction force in the ECM and MAM has an entropic origin, see Fig. 6 and Fig. 8. For a fixed separation distance it first goes up and then drops back to zero as is increased. Similar to the monovalent counterion case, the entropic force is repulsive over the full range of separation distances. The electrostatic force, which was totally repulsive for the monovalent counterions, now is attractive for dilute salt densities. Thus, it is the electrostatics that makes the total interaction attractive for the ECM and MAM at small salt densities. As is increased, the monovalent ions tend to replace the adsorbed divalent ions on the DNA surface in accordance with the two-variable theory of Manning [157]. This replacement is energetically favorable, since the divalent ions gain more polarization energy in the bulk electrolyte. This results in the loss of the attractive electrostatic force and the weakening of the entropic force. At the final stage, when all the divalent sites on the DNA surface are occupied by monovalent ions, the strongly correlated fluid structure is destroyed and the entropic and electrostatic forces drop to zero.
An other interesting observation is the occurrence of zero force in the CM in Fig. 6 at small separation distances. As the salt concentration is increased, the distance where the interaction force vanishes, shifts towards larger values. The physical meaning of this effects is not clear to us. Probably it is an artifact of the simple DNA model with no grooves.
We note that the salt densities invoked in the current simulations are below the concentrations where a salt depletion [155] appears near the DNA surface. Thus the observed attractive DNA-DNA force is not induced by the salt depletion effect, which was claimed in Ref. [155] to be one of the main contributors to the protein-protein attraction. Furthermore the attraction observed here is unrelated to metastable ionization [98].
C Trivalent Counterions.
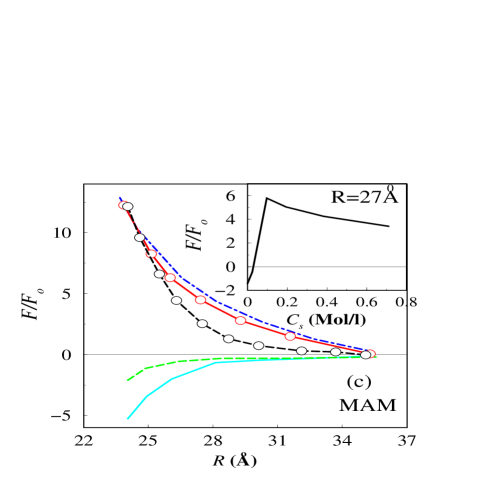
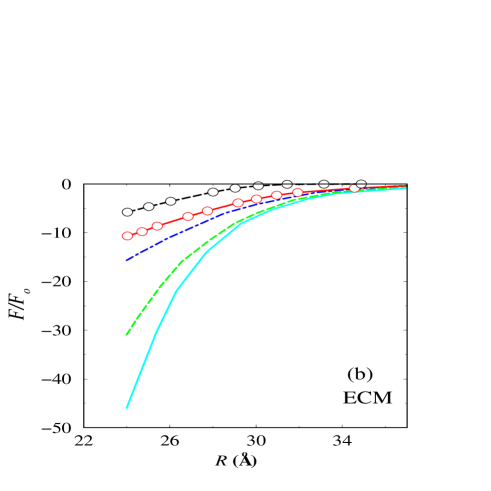
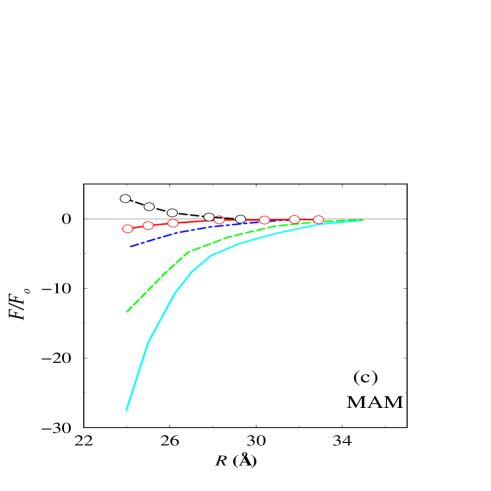
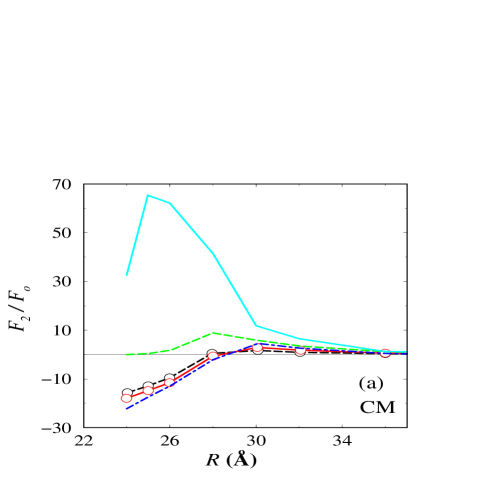
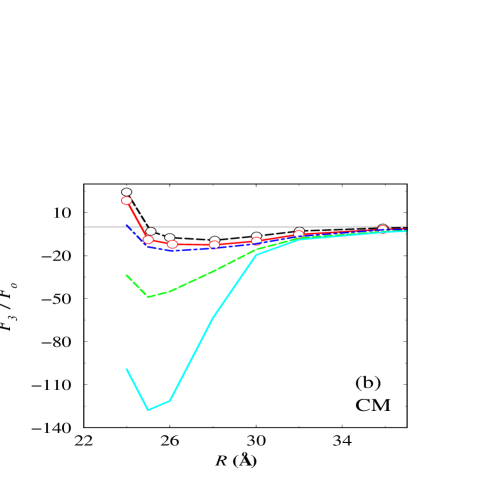
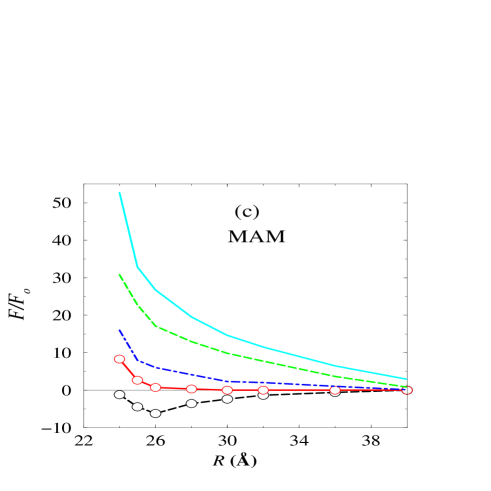
Overwhelmingly attractive DNA-DNA interaction forces for trivalent counterions and monovalent salt ions are plotted in Fig. 9. This attraction is stronger than for the divalent counterions, in accordance with the results of Ref. [63]. Similar to the divalent counterion case, the DNA-DNA attraction in the CM is much stronger than the attraction in the MAM for a given salt density. Evidently this is related to the different counterion condensation patterns for different DNA models [79]. There is no salt-induced stabilization for the ECM and MAM for the salt densities indicated in Fig. 9. Test runs with higher salt concentrations (not shown here) reveal that the salt-induced stabilization in the MAM does appear at mol/l when the repulsive interaction force starts to descend towards zero. However, up to these high salt concentrations, the attractive force in the ECM steadily approaches zero from below. The same trend holds in the CM as well.
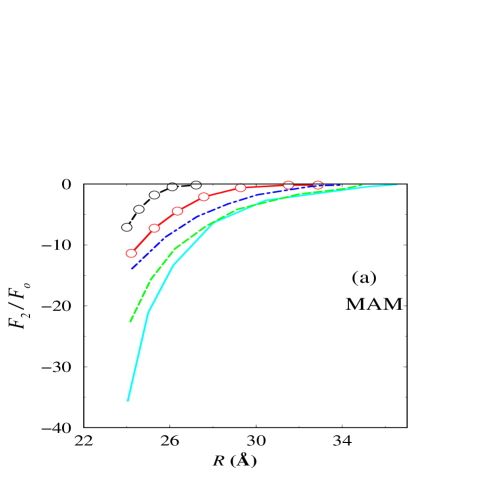
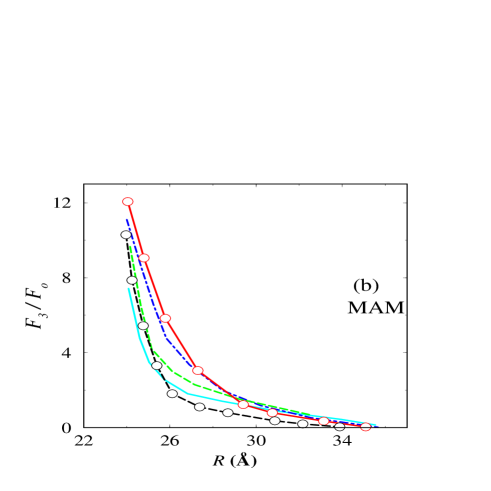
The entropic force is non-monotonic against added salt both in the ECM and MAM, see Fig. 11b. The reason is the following. The added salt enhances the release of condensed trivalent counterions from the DNA surface to the bulk [62]. However, the strong electrostatic correlations in the inner area between the DNA molecules hinder this release. As a result, the trivalent counterion release will be asymmetric over the surface of DNA molecule. This will lead to an excess entropic force that pushes the DNA molecules away from each other. The osmotic pressure of added salt balances and at some salt density overcomes this entropic force, eventually driving the entropic force to zero. This entropic non-monotonicity does not survive in the total interaction force shown in Fig. 9. This is because of the strong electrostatic attraction between the DNA molecules. Whereas the entropic repulsion is of the same order for divalent and trivalent counterions, the electrostatic attraction for trivalent counterions is roughly twice as strong as for divalent counterions.
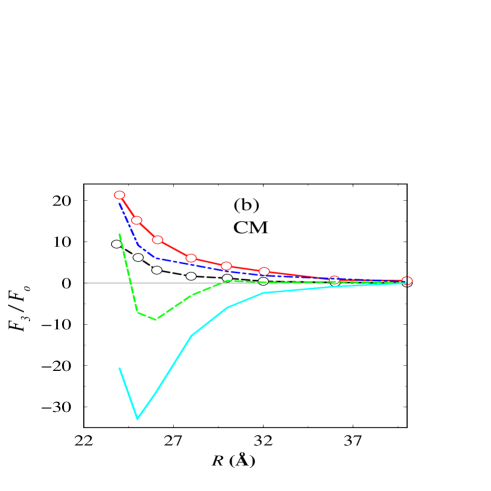
VIII simulation results for multivalent salt
A Monovalent Counterions.
The results obtained in previous sections indicate that the multivalent counterions generate strong correlations inside the system and induce an electrostatic attraction between the DNA rods in the monovalent salt system. An intriguing question is how this DNA-DNA attraction relates to DNA overcharging. Going back to the single DNA case, considered in Ref. [79], we observed no overcharging for multivalent counterions and monovalent salt ions. Thus we conclude that the overcharging effect is not a necessary condition for a DNA-DNA attraction to take place. In other words, the electrostatic ion correlations, which are not strong enough to induce the macroion overcharging, are able to induce an attractive intermolecular force. On the other hand, in Ref. [79] we have seen a DNA overcharging when multivalent salt ions were pumped into the DNA suspension. When a DNA overcharging occurs, the ions form a sequence of radial alternating charged layers around the DNA surface. The width of these layers is comparable with the Debye screening length . The question we want to address here is to what extent the existence of such layers affects the DNA-DNA interaction.
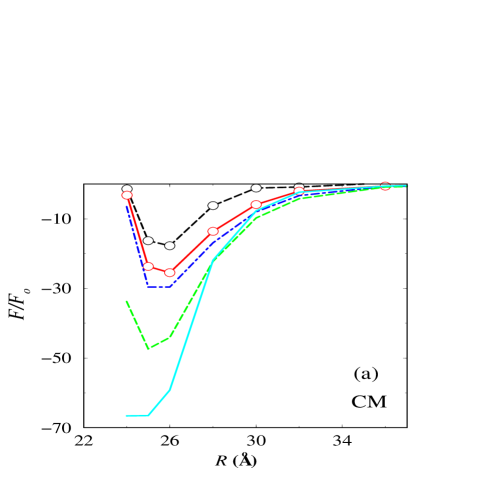
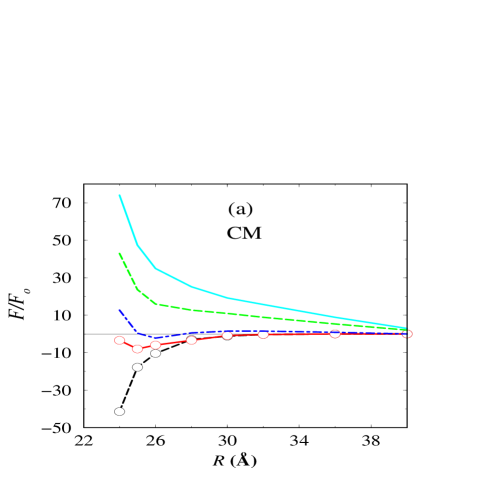
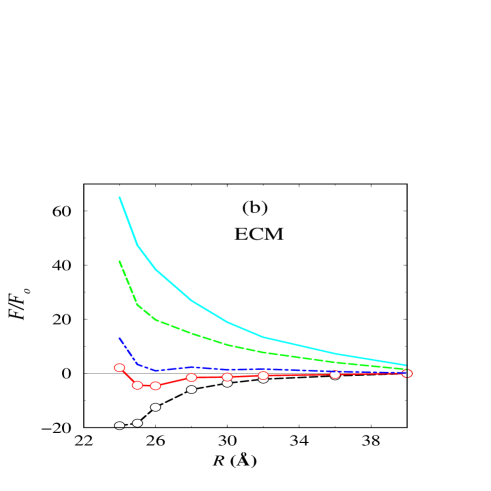
The total interaction forces for the divalent salt and monovalent counterions are depicted in Fig. 12. For all three DNA models, the DNA-DNA interaction is repulsive at small salt densities and transforms to an attraction for a sufficiently high . The DNA-DNA repulsion at lower salt is composed from the repulsive and components of the interaction force . In a similar way the attraction at a dense salt, which is strong for the CM and weaker for MAM, arises from both attractive electrostatic and entropic forces. For like-charged colloid particles at similar parameters for the small ions, an attraction was reported only for the electrostatic component of the interaction force [158]. A multivalent salt-induced precipitation of polyelectrolyte solution is also addressed in Ref. [159]. Whereas the van der Waals or hydrophobic forces could be presumed as a source for this attraction [46, 81, 160], our simulations are able to catch this effect without resorting to these forces.
The DNA-DNA attraction at the divalent salt density =0.71mol/l in Fig. 12 corresponds to the overcharging of a single DNA molecule, see Ref. [79]. Thus, an overcharging and entailed charged layers near the DNA surface correlate with the DNA-DNA attraction in the divalent salt, at least when monovalent counterions are involved. This conclusion contradicts the results of Refs. [161] where the onset of the DNA overcharging was considered to entail a repulsion between the DNA molecules, and therefore, a reentrance of the DNA condensation. From our point of view, the discrepancy between our result and the result of Ref. [161] is due to the different definition of overcharging. Whereas we count all charges near the DNA surface, only big multivalent ions were counted in Ref. [161].
B Trivalent Counterions.
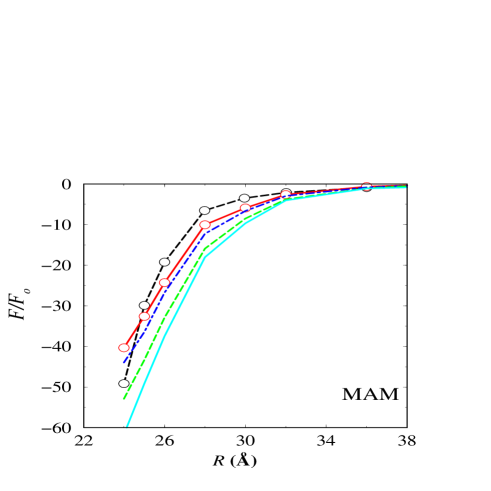
Simulation results for divalent salt and trivalent counterions are illustrated in Fig. 13 for the MAM. Now the DNA-DNA interaction force and both of its components and (not shown here) are strongly attractive for all the calculated salt densities. The CM and ECM models exhibit similar trends. We note that at small salt densities, where no overcharging was found for a single DNA molecule [79], the obtained attractive force relates to the strong charge correlations in system. Thus the claim that the overcharging effect is a sole factor that induces the DNA attraction, is not correct. Broadly speaking, there is a competition between the correlations that induce an attraction between the DNA molecules (multivalent counterion induced correlations) and the overcharging effect, which induce a DNA-DNA attraction (multivalent salt-induced correlations). To understand the physics of this competition we have analyzed the tendencies of these two correlation effects against the increase of the salt density. Fig. 13 shows that the interaction forces decay monotonically with increasing salt concentration . This trend is in contrast to the results for a divalent salt and monovalent counterions in Fig. 12, where more salt-induced more attraction. Thus, the main contribution to the DNA-DNA attraction comes from the strong correlations between the two strongly correlated layers of trivalent counterions on the DNA surfaces. Pumping more divalent salt into the system destroys the two-dimensional crystal structure and correlations. But the interaction force remains attractive, mainly due to the additional overcharging of the DNA. As a result, the DNA-DNA attraction survives for a dense salt, in opposite to the case of trivalent counterions and monovalent salt shown in Fig. 9.
IX conclusion
We have studied the interaction forces between a pair of DNA molecules in an electrolyte that contains a mixture of monovalent and multivalent ions. Three models for the DNA shape, employed in our simulations, indicate the importance of the DNA geometry on the electrostatic and entropic forces in the DNA conformations. We show that the DNA-DNA attraction is related to the charge correlations in strongly charged systems. We distinguish between multivalent counterion and multivalent salt induced attractions. In general, the higher the mean valency of the microions in the solution, the stronger is the mutual attraction. Below we shortly summarize the main results of this manuscript.
For the multivalent counterions, the DNA shape is an essential
contributor to the interaction forces. Thus:
i) For no added salt the DNA-DNA attraction in the CM is related
to the Coulomb depletion mechanism. This depletion effect results in
an attractive entropic force. However such an attraction mechanism does
not exist in the MAM.
ii) For the nonzero added salt cases, an attraction in the CM is mainly
due to a combination of electrostatic and entropic forces. However the
attractive force in the MAM always has an electrostatic origin. The
entropic force in the MAM is always repulsive.
iii) There is a non-monotonic force-salt dependence at a fixed separation
distance. For divalent counterions, there is a change
of the interaction force from the repulsion to an attraction, and then back
to zero, which we call salt-induced stabilization.
iv) An increase of the salt concentration suppresses the charge correlations
and thus effectively screens the DNA-DNA attraction.
For the multivalent added salt, the DNA shape has a minor effect on
the interaction forces. DNA-DNA interaction forces are stronger for the
CM than for the MAM. Further trends are:
i) An increase of the divalent salt density at a fixed monovalent ion
number drives the DNA-DNA interaction
force towards attraction. Both DNA molecules are overcharged in the
attractive force regime.
ii) For trivalent counterions the addition of divalent salt decreases
the DNA-DNA attraction. The more the DNA becomes overcharged, the less
is the attraction between the DNA molecules.
iii) The correlation effects related to multivalent counterions have
a greater influence on the DNA attraction than the correlation effects
related to multivalent salt ions. In other words, an
overcharging-induced attraction is weak compared to the
counterion-induced attraction.
We would like to make some comments about the range of the DNA-DNA attraction which directly influences the phase diagram of DNA solutions [162, 163]. Compared to the Debye screening length, the attraction forces between the DNA molecules are long-ranged (they are beyond the screening length). In contrast, for colloids, usually the attraction is short ranged in comparison with the screening length [11]. Thus, the calculated attractive DNA-DNA forces can lead to phase separation in DNA solutions but they are not the dominant driving forces of DNA condensation: The actual “arbiters” of phase instability in macroion solutions seem to be many-body interactions [164, 165, 166]. These forces separate the DNA assemble into DNA rich and DNA poor regions even for a purely repulsive pairwise interaction [55, 167, 168]. Another intriguing effect is the appearance of a cholesteric phase of DNA condensates, which arises from DNA chirality and many-body interactions [16, 169, 170, 171].
Finally, let us comment on some limitations of our model. Our choice of a continuum dielectric model has the intention to separate the purely electrostatic effects from the effects of hydration and the molecular structure of the solvent. In many applications, including strong polyelectrolytes and high salt concentrations, continuum dielectric models (the primitive electrolyte model) have been successful (see Refs. [172, 173]). However, strictly speaking, the continuum model is not justified at small ion-DNA and ion-ion separations where the molecular nature of the solvent is no longer negligible [83, 174, 175, 176]. At these distances the effective (mean-force) potentials of ions have one to two oscillations around the potential of primitive model [91, 97, 175, 176, 177, 178].
It is worth to mention the complete neglect of the specific binding (or chemisorbtion) of counterions to the DNA grooves in our simulations. Active binding [179] can be taken into account through the incorporation of a full water description [120, 180, 181, 182] or via the implementation an additional sticky potential to certain ions in parts of the DNA areas. A cylindrical well around the DNA due to the solvent mediated mean-field potential or specific short-range ion-DNA interactions, can also replace the specific "bonding" of ions to the DNA surface.
Other effects not accounted for in the dielectric continuum model are the dielectric discontinuity and dielectric saturation effects. The former effect emerges due to the polarization of the DNA surface and affects the ion distribution outside the DNA core [183]. It rapidly drops off for large distances from the surface [37]. The latter effect is related to the water anisotropy near the DNA surface [184] and can be accounted for through a distance-dependent in the electrostatic potentials [20, 77, 92, 185, 186, 187, 188, 189, 190]. A decade ago there was a widely accepted perception that the attraction between the DNA molecules cannot be explained by the electrostatic forces [81, 191, 192]. However the theoretical investigations and simulations of strongly correlated systems do not support this claim [3, 20]. Finally, we neglect the salt-induced decrease of the DNA rigidity in salted solutions [61, 101, 193, 194, 195, 196, 197] and dielectric permeability of the solvent [175]. To include all these additional complications into a simulation remains a very challenging task for the future.
ACKNOWLEDGMENTS
E. A. thanks A. Cherstvy, R. Podgornik and A. Parsegian for fruitful discussions of some results of the current paper.
REFERENCES
- [1] J. Pelta, F. Livolant, J.-L. Sikorav, J. Biological Chemistry 271, 5656 (1996).
- [2] V. A. Bloomfield, Biopolymers 31, 1471 (1991).
- [3] V. A. Bloomfield, Biopolymers 44, 269 (1997).
- [4] V. A. Bloomfield, Curr. Opin. Struct. Biol. 6, 334 (1996).
- [5] X. Shui, L. McFail-lsom, G. G. Hu, L. D. Williams, Biochemistry 37, 8341 (1998).
- [6] H. A. Tajmir-Riahi, M. Naoui. R. Ahmad, J. Biomol. Struct. Dyn. 11, 83 (1993); I. Fita, J. L. Campos, L. C. Puigjaner, J. A. Subriana, J. Mol. Biol. 167, 157 (1983).
- [7] A. M. Wierenga, A. P. Philipse, J. Colloid interface Sci. 180, 360 (1996).
- [8] R. Kjellander, S. Marčelja, J. P. Quirk, J. Colloid. Interface Sci. 126, 194 (1988).
- [9] G. M. Kepler, S. Fraden, Phys. Rev. Letters 73, 356 (1994).
- [10] J. C. Crocker, D. G. Grier, Phys. Rev. Lett. 77, 1897 (1996).
- [11] A. E. Larsen, D. G. Grier, Nature 385, 231 (1997).
- [12] H. Wennerström, A. Khan, B. Lindman, Adv. Colloid. Interface Sci. 34, 433 (1991).
- [13] P. Kekicheff, S. Marčelja, T. J. Senden, V. E. Shubin, J. Chem. Phys. 99, 6098 (1993).
- [14] W. Saenger, 1984 Principles of Nucleic Acid structure. Springer-Verlag, New-York.
- [15] J. A. Benbasat, Biochemistry 23, 3609 (1984).
- [16] H. Deng, V. A. Bloomfiled, Biophysical J. 77, 1556 (1999).
- [17] F. J. Solis, M. O. de la Cruz, Phys. Rev. E 60, 4496 (1999).
- [18] G. Lamm, G. R. Pack, Int. J. Quant. Chem. 20, 213 (1993); Biopolymers 34, 227 (1994).
- [19] L. G. Nilsson, L. Gulbrand, L. Nordenskiöld, Mol. Phys. 72, 177 (1991).
- [20] A. P. Lyubartsev, L. Nordenskiöld, J. Phys. Chem. 99, 10373 (1995).
- [21] H. Deng, V. A. Bloomfeld, J. M. Benevides, G. J. Thomas Jr, Nucleic acids research 28, 3379 (2000).
- [22] M. O. Khan, B. Jönsson, Biopolymers 49, 121 (1999).
- [23] B.-Y. Ha, A. J. Liu, Phys. Rev. Letters 81, 1011 (1998).
- [24] M. Deserno, A. Arnold, Ch. Holm, Macromolecules, American Chemical Society, Preprint (2002).
- [25] L. Guldbrand, B. Jönsson, H. Wennerström, P. Linse, J. Chem. Phys. 80, 2221 (1984); L. Guldbrand, L. G. Nilsson, L. Nordenskiöld J. Chem. Phys. 85, 6686 (1986).
- [26] P. G. Bolhuis, T. Åkesson, B. Jönsson, J. Chem. Phys. 98, 8096 (1993).
- [27] X. E. Cai, J. Yang, Biophys. J. 82, 357 (2002).
- [28] E. J. W. Vervey, J. T. G. Overbeek, Theory of stability of Lyophobic Colloids, Elsevier, Amsterdam (1948).
- [29] E. S. Reiner, C. J. Radke, Adv. Colloid Interface Sci bf 47, 59 (1993).
- [30] P. Mills, C. F. Anderson, M. T. Record, J. Phys. Chem. 89 3984 (1985).
- [31] R. A. Marcus, J. Chem. Phys. 23, 1057 (1955).
- [32] F. Fogolari, P. Zuccato, G. Esposito, P. Viglino, Biophysical J. 76, 1 (1999).
- [33] P. J. Lin-Chung, A. K. Rajagopal, Phys. Rev. E 52, 901 (1995).
- [34] M. K. Gilson, M. E. Davis, B. A. Luty, J. A. McCammon, J. Phys. Chem. 97, 3591 (1993).
- [35] K. Wagner, E. Keyes, T. W. Kephart, G. Edwards, Biophysical J. 73, 21 (1997).
- [36] V. Vlachy, Ann. Rev. Phys. Chem. 50, 145 (1999).
- [37] S. Gavryushov, P. Zielenkiewicz, Biophysical J. 75, 2732 (1998).
- [38] J. Rescic, V. Vlachy, L. B. Bhuiyan, C. W. Outhwaite, J. Chem. Phys. 107, 3611 (1997).
- [39] T. Das, D. Bratko, L. B. Bhuiyan, C. W. Outhwaite, J. Chem. Phys 99, 410 (1995).
- [40] R. R. Netz, H. Orland, Euro. Phys. J. E 1, 203 (2000).
- [41] A. K. Sood, Solid State Physics 45, 1 (1991).
- [42] C. J. Coen, H. W. Blanch, J. M. Prausnitz, AICHE J. 41 996 (1995).
- [43] V. Vlachy, H. W. Blanch, J. M. Prausnitz, AICHE J. 39, 215 (1993).
- [44] M. Farnum, C. Zukoski, Biophysical J. 76, 2716 (1999).
- [45] O. Spalla, Curr. Opinion Colloid. Interface Sci. 5, 5 (2000).
- [46] A. Weiss, M. Ballauff, Colloid. Polym. Sci. 278, 1119 (2000).
- [47] R. Kjellander, S. Marčelja, Chem. Phys. Lett. 49, 112 (1984); C. L. Steven, T. M. Glenn, Adv. Chem. Phys. 56, 141 (1984); S. E. Feller, D. A. McQuarrie, Mol. Phys. 80, 721 (1993).
- [48] N. Grønbech-Jensen, K. M. Beardmore, P. Pincus, Physica A 261, 74 (1998); A. W. C. Lau, P. Pincus et al, Phys. Rev. E 63, 051604-1 (2001); P. Pincus, S. A. Safran, Euro. Phys. Letters 42, 103 (1998).
- [49] L. Harnau, J.-P. Hansen, J. Chem. Phys. 116, 9051 (2002).
- [50] R. Kjellander, S. Marčelja, J. Phys. Chem. 90, 1230 (1986).
- [51] P. Attard, D. J. Mitchell, B. W. Ninham, J. Chem. Phys. 88, 4987 (1988); P. Attard, D. J. Mitchell, B. W. Ninham, J. Chem. Phys. 89, 4358 (1988).
- [52] R. Podgornik, J. Phys. A 23, 275 (1990).
- [53] M. J. Stevens, M. O. Robbins, Europhys. Lett. 12, 81 (1990).
- [54] A. W. C. Lau, D. Levine, P. Pincus, Phys. Rev. Lett. 84, 4116 (2000).
- [55] R. van Roij, J. Phys. Cond. Matter 12, A263 (2000).
- [56] R. van Roij, J.-P. Hansen, Phys. Rev. Lett. 79, 3082 (1997); R. van Roij, M. Dijkstra, J.-P. Hansen, Phys. Rev. E 59, 2010 (1999).
- [57] O. Spalla, L. Belloni, J. Chem. Phys. 95, 7689 (1991). L. Belloni, O. Spalla, jchem.p 107 (1997) 465
- [58] B. Hribar, V. Vlachy, J. Phys. Chem. 101, 3457 (1997).
- [59] R. R. Netz, H. Orland, Europhys. Lett. 45, 726 (1999); R. R. Netz, Eur. Phys. J. E 5, 557 (2001); R. R. Netz, Phys. Rev. E 60, 3174 (1999); A. G. Moreira, R. R. Netz, Phys, Rev. Letters 87, 078301 (2001).
- [60] D. Goulding, J.-P. Hansen, Europhys. Letters 46, 407 (1999).
- [61] G. Ariel, D. Andelman, Phys. Rev. E 67, 011805 (2003).
- [62] Y. Burak, G. Ariel, D. Andelman, submitted to Biophys J. 2003.
- [63] N. Grønbech-Jensen, R. J. Mashl, R. F. Bruinsma, W. M. Gelbart, Phys. Rev. Letters 78, 2477 (1997); N. Grønbech-Jensen, K. M. Beardmore, Physica A 261, 74 (1998).
- [64] Y. Levin, J. J. Arenzon, J. F. Stilck, Phys. Rev. Letters 83, 2680 (1999); J. J. Arenzon, J. F. Stilck, Y. Levin, Eur. Phys. J. B 12, 79 (1999).
- [65] J. J. Delrow, J. A. Gebe, J. M. Schurr, Inc. Biopoly 42, 455 (1997).
- [66] P. Linse, V. Lobaskin, Phys. Rev. Lett. 83, 4208 (1999); J. Chem. Phys. 112, 3917 (2000).
- [67] R. Kjellander, T. Akesson , B. Jönsson,S. Marčelja, J. Chem. Phys. 97, 1424 (1992).
- [68] I. Rouzina, V. A. Bloomfield, J. Chem. Phys. 100, 9977 (1996).
- [69] D. B. Lukatsky, S. A. Safran, Phys. Rev. E 60, 5848 (1999).
- [70] C. S. Murthy, R. J. Bacquet, P. J. Rossky, J. Phys. Chem. 89, 701 (1985).
- [71] V. Vlachy, A. D. J. Haymet, J. Chem. Phys. 84, 5874 (1986).
- [72] M. D. Paulsen, C. F. Anderson, M. T. Record, Biopolymers 27, 1249 (1988).
- [73] P. Mills, M. D. Paulsen, C. F. Anderson, M. T. Record Jr., Chem. Phys. Letters 129, 155 (1986).
- [74] M. D. Paulsen, B. Richey, C. F. Anderson, M. T. Record Jr., Chem. Phys. Letters 139, 448 (1987).
- [75] A. Katchalsky, Pure Appl. Chem. 26, 327 (1971).
- [76] B. Jayaram, D. L. Beveridge, Annu. Rev. Biophys. Biomol. Struct. 25, 367 (1996).
- [77] L. Yang, A. Weerasinghe, B. M. Pettitt, Biophys J. 69, 1519 (1995).
- [78] E. Allahyarov, H. Löwen, Phys. Rev. E 62, 5542 (2000).
- [79] E. Allahyarov, H. Löwen, G. Gompper, accepted in Phys. Rev. E (2003).
- [80] E. Allahyarov, I. D’Amico, H. Löwen, Phys. Rev. Letters 81, 1334 (1998).
- [81] D. C. Rau, B. Lee, V. A. Parsegian, Proc. Natl. Acad. Sci 81, 2621 (1984); R. Podgornik, D. C. Rau, V. A. Parsegian, Biophys. J. 66, 962 (1994); R. Podgornik, D. C. Rau, V. A. Parsegian, Macromolecules 22, 1780 (1989); H. H. Strey, V. A. Parsegian, R. Podgornik, Phys. Rev. Letters 78, 895 (1997); R. Podgornik, H. H. Strey, K. Gawrisch, D. C. Rau, A. Rupprecht, V. A. Parsegian, Proc. Nat. Acad. Sci. USA 93, 4261 (1996); S. Leikin, V. A. Parsegian, D. C. Rau, R. P. Rand, Annu. Rev. Phys. Chem. 44, 369 (1993).
- [82] B. Schneider, K. Patel, H. M. Berman, Biophys. J. 75, 2422 (1998).
- [83] P. González-Mozuelos, N. Bagatella-Flores, Physica A 286, 56 (2000).
- [84] J. L. Barrat, J. F. Joanny, Adv. Chem. Phys. 94, 1 (1996).
- [85] F. Oosawa, Polyelectrolytes (Marcel Dekker, New York, 1971).
- [86] V. A. Bloomfield, I. Rouzina, Methods Enzymol. 295, 364 (1999).
- [87] J. L. Hecht, B. Honig, Y. K. Shin, W. L. Hubbell, J. Phys. Chem. 99, 7782 (1995).
- [88] A. A. Kornyshev, S. Leikin, J. Chem. Phys. 107, 3656 (1997); Proc. Natl. Acad. Sci. USA 95, 13579 (1998); Biophys. J. 75, 2513 (1998); J. Chem. Phys. 108, 7035(E) (1998); A. G. Cherstvy, A. A. Kornyshev, S. Leikin, J. Phys. Chem. B 106, 13362 (2002).
- [89] A. P. Lyubartsev, L. Nordenskiöld, J. Phys. Chem. B 101, 4335 (1997).
- [90] J. C. G. Montoro, J. L. F. Abascal, J. Chem. Phys. 103, 8273 (1995), J. Chem. Phys. 109, 6200 (1998); J. L. F. Abascal, J. C. G. Montoro, J. Chem. Phys. 114, 4277 (2001).
- [91] L. E. Guldbrand, T. R. Forester, R. M. Lynden-Bell, Mol. Phys. 67, 473 (1989).
- [92] B. Jayaram, K. Sharp, B. Honig, Biopolymers 28, 975 (1989).
- [93] J. Conrad, M. Troll, B. H. Zimm, Biopolymers 27, 1711 (1988).
- [94] D. Hochberg, T. W. Kephart, G. Edwards, Phys. Rev. E 49, 851 (1994); D. Hochberg, G. Edwards, T. W. Kephart, Phys. Rev. E 55, 3765 (1997); G. Edwards, D. Hochberg, T. W. Kephart, Phys. Rev. E 50, R698 (1994).
- [95] S. S. Zakharova, S. U. Egelhaaf, L. B. Bhuiyan, D. Bratko, J. R. C. van der Maarel, J. Chem. Phys. 111, 10706 (1999).
- [96] D. B. Lukatsky, S. A. Safran, A. W. C. Lau, P. Pincus, Europhys. Lett. 58, 785 (2002).
- [97] R. Kjellander, A. P. Lyubartsev, S. Marčella, J. Chem. Phys. 114, 9565 (2001).
- [98] R. Messina, C. Holm, K. Kremer Phys. Rev. E 64, 021405 (2001); ibid Eur. Phys. J. E 4, 363 (2001); R. Messina, C. Holm, K. Kremer, Phys. Rev. Lett. 85, 872 (2000).
- [99] J. Sponer, J. Leszczynski, P. Hobza, Biopolymers 61, 3 (2002).
- [100] J. Duguid, V. A. Bloomfield, J. Benevides, G. J. Thomas Jr, Biophys. J. 65, 1916 (1993).
- [101] J. G. Duguid, V. A. Bloomfield et al, Biophys. J. 69, 2623 (1995); ibid Biophys. J. 69, 2642 (1995).
- [102] D. A. Knoll, M. D. Fried, V. A. Bloomfield "DNA and its Drug Complexes" edited by R. H. Sarma and M. H. Sarma (Adenin press, New-York 1988, p.123)
- [103] D. C. Rau, V. A. Parsegian, Biophys J. 61, 260 (1992); ibid 61, 246 (1992).
- [104] J. Widom, R. L. Baldwin, J. Mol. Biol. 144, 431 (1980).
- [105] G. E. Plum, V. A. Bloomfield, Biopolymers 27, 1045 (1988); ibid 29, 13 (1990); ibid 30, 631 (1990).
- [106] W. H. Braunlin, C. F. Anderson, M. T. Record Jr., Biopolymers 25, 205 (1986); W. H. Braunlin, Q. Xu, Biopolymers 32, 1703 (1992).
- [107] P. G. Arscott, C. Ma, J. R. Wenner, V. A. Bloomfield, Biopolymers 36, 345 (1995). J. Phys. Chem. B 102, 7666 (1998).
- [108] S. S. Cohen, A Guide to Polyamines, Oxford University Press, New-ork, NY, 1998
- [109] C. W. Tabor, H. Tabor, Annu. Rev. Biochem. 53, 749 (1984).
- [110] K. A. Marx, T. C. Reynolds, Proc. Natl. Acad. Sci. USA 79, 6484 (1982).
- [111] M. Saminathan, T. Thomas, A. Shirahata, C. K. S. Pillai, T. J. Thomas, Nucleic Acids Research 30, 3722 (2002).
- [112] L. C. Gosule, J. A. Schellman, Nature 259, 333 (1976); J. Mol. Biol. 121, 311 (1978).
- [113] R. W. Wilson, V. A. Bloomfield, Biochemistry 18, 2192 (1979); R. W. Wilson, D. C. Rau, V. A. Bloomfiled, Biophys. J. 30, 317 (1980).
- [114] H. Deng, V. A. Bloomfield, J. M. Benevides, G. J. Thomas Jr, Nucleic Acids Research 28, 3379 (2000).
- [115] E. Raspaud, I. Chaperon, A. Leforestier, F. Livolant, Biophys. J. 77, 1547 (1999); E. Raspaud, M. Olvera, M. O. de la Cruz, J.-L. Sikorav, F. Livolant, Biophys. J. 74, 381 (1998).
- [116] C. F. Anderson, M. T. Record Jr., Anu. Rev. Phys. Chem. 33, 191 (1982).
- [117] G. S. Manning, Q. Rev. Biophys. 11, 179 (1978); Acc. Chem. Res. 12, 443 (1979).
- [118] J. Ray, G. S. Manning, Biopolymers 32, 541 (1992).
- [119] I. Rouzina, V. A. Bloomfield, J. Chem. Phys. 100, 4292 (1996).
- [120] N. Korolev, A. P. Lyubartsev, L. Nordenskiöld, A. Laaksonen, J. Mol. Biol. 38, 907 (2001).
- [121] Here we adopt an idealized DNA model where phosphates form ideal spirals. It is however known that in real DNAs the twist angle from one base pair to another depends on the base pair sequence. The influence of the twist angle fluctuations on the DNA-DNA interaction is addressed in A. G. Cherstvy, A. A. Kornyshev, S. Leikin, submitted to J. Phys. Chem. B (from private communication with A. G. Cherstvy).
- [122] A. M. J. J. Bonvin, Euro. Biophys J. 29, 57 (2000).
- [123] H. Löwen, Progr. Colloid Polym. Sci. 110, 12 (1998).
- [124] J. Z. Wu, D. Bratko, H. W. Blanch, J. M. Prausnitz J. Chem. Phys. 111, 7084 (1999).
- [125] M. C. Olmsted, C. F. Anderson, M. T. Record Jr, PNAS 86, 7766 (1989); M. C. Olmsted, J. P. Bond, C. F. Anderson, M. T. Record, Biophys. J. 68, 634 (1995).
- [126] M. Feig, B. M. Pettitt, Biophys. J. 77, 1769 (1999).
- [127] S. A. Allison, J. Chem. Phys. 98, 12091 (1994).
- [128] B. E. Hingerty, R. H. Ritchie, T. L. Ferrel, J. E. Turner, Biopolymers 24, 427 (1985).
- [129] S. Tandon, R. Kesavamoorthy, S. A. Asher, J. Chem. Phys. 109, 6490 (1998).
- [130] J. Lekner, Physica A 176, 485 (1991); J. Lekner, Mol. Simul. 20, 357 (1998).
- [131] D. Stigter, K. A. Dill, Biophys. J. 71, 2067 (1996).
- [132] B. S. Fujimoto, J. M. Miller, N. S. Ribeiro, J. M. Schurr, Biophys. J. 67, 304 (1994).
- [133] B. W. Ninham, V. Yaminsky, Langmuir 13, 3097 (1997).
- [134] R. Piazza, M. Pierno, J. Phys. Condensed Matter 12, A443 (2000).
- [135] T. Cagin, J. I. Pettitt, Mol. Phys. 72, 169 (1991); T. Cagin, J. I. Pettitt, J. Chem. Phys. 96, 1333 (1992); J. I. Pettitt, Mol. Phys 82, 67 (1994); G. C. Lynch, J. I. Pettitt, J. Chem. Phys. 107, 8594 (1997); A. Weerasinghe, J. I. Pettitt, Mol. Phys 82, 897 (1994).
- [136] C. Lo, B. J. Palmer, J. Chem. Phys, 102, 925 (1995).
- [137] M. P. Allen and D. J. Tildesley, Computer simulation of Liquids, Oxford Science Publications, Oxford University Press, Oxford (1991).
- [138] M. Lupkowski, F. van Swol, J. Chem. Phys. 95, 1995 (1991).
- [139] J. P. Valleau, L. K. Cohen, J. Chem. Phys. 72, 5935 (1980); J. P. Valleau, L. K. Cohen, D. N. Card, J. Chem. Phys. 72, 5942 (1980).
- [140] N. Korolev, A. P. Lyubartsev, A. Rupprecht, L. Nordenskiöld, Biophys. J. 77, 2736 (1999).
- [141] Yau, Liem, Chan, J. Chem. Phys. 101, 7918 (1994).
- [142] G. M. Torrie, J. P. Valleau, G. N. Patey, J. Chem. Phys. 76, 4615 (1982).
- [143] K. K. Mon, R. B. Griffiths, Phis. Rev. A 31, 956 (1985).
- [144] G. Orkoulas, A. Panagiotopoulos, J. Chem. Phys. 101, 1452 (1994).
- [145] A. Papadopoulou, E. D. Becker, M. Lupkowski, F. van Swol, J. Chem. Phys. 98, 4897 (1993).
- [146] P. Attard, J. Chem. Phys. 107, 3230 (1997), and references therein.
- [147] B. R. Svennson, C. E. Woodward, Molecular Physics 64, 247 (1988).
- [148] B. Jonsson, Lecture notes, Les houches, October (2000).
- [149] A. A. Kornyshev, S. Leikin, Phys. Rev. Letters 82, 4138 (1999); Phys. Rev. Letters 86, 3666 (2001).
- [150] J. A. Schellman, N. Parthasaratary, J. Mol. Biol. 175, 313 (1984).
- [151] P. Linse, J. Phys. Cond. Matter 14, 13449 (2002).
- [152] J. P. Hansen, H. Löwen, Annual Rev. Phys. Chem. 51, 209 (2000).
- [153] This effect resembles the so called “hydration attraction” [103], when the entropic “push” from the outside area is generated by the water particles. A similar effect, called “a counterion evaporation”(see C. Fleck, H. H. von Grünberg, Phys. Rev. E 63, 061804 (2001)) exists between the oppositely charged rod and surface.
- [154] P. N. Pusey, in “Liquids, Freezing and the Glass Transition", edited by J. P. Hansen, D. Levesque and J. Zinn-Justin (North Holland, Amsterdam, 1991).
- [155] E. Allahyarov, H. Löwen, J.-P. Hansen, A. A. Louis, Phys. Rev. E 67, 051404 (2003).
- [156] Y. U. Moon, C. O. Anderson, H. W. Blanch, J. M. Prausnitz, Fluid Phase Equilibria 168, 229 (2000).
- [157] G. S. Manning, Q. Rev. Biophys. 11, 179-246 (1978).
- [158] J. Z. Wu, D. Bratko, H. W. Blanch, J. M. Prausnitz, Proc. Natl. Acad. Sci. Usa 95, 15169 (1998).
- [159] L. Belloni et all, J. Chem. Phys. 103, 5781 (1995).
- [160] P. E. Sottas, E. Larquet, A. Stasiak, J. Dubochet, Biophys. J. 77, 1858 (1999).
- [161] T. T. Nguyen, I. Rouzina, B. I. Shklovskii, J. Chem. Phys. 112, 2562 (2000); T. T. Nguyen, B. I. Shklovskii, J. Chem. Phys, 115, 7298 (2001).
- [162] A. P. Gast, W. B. Russel, C. K. Hall, J. Colloid. Interface Sci. 96, 251 (1983); ibid 109, 161 (1986).
- [163] H. N. W. Lekkerkerker, W. C. K. Poon, P. N. Pusey, A. Stroobants, P. B. Warren, Europhys. Lett. 20, 559 (1992).
- [164] I. Potemkin, A. R. Khohklov et al, Phys, Rev, E 66, 011802 (2002).
- [165] B.-Y. Ha, A. J. Liu, Phys. Rev. Letters 79, 1289 (1997).
- [166] M. Knott, I. J. Ford, Phys. Rev. E 63, 031403 (2001).
- [167] P. B. Warren, J. Chem. Phys. 112, 4683 (2000).
- [168] N. Dan, Biophys. J. 71, 1267 (1996).
- [169] All helices are chiral, i.e., the mirror image of a right-handed helix is left handed and vice versa.
- [170] T. E. Strzelecka, R. L. Rill, J. Am. Chem. Soc. 109, 4513 (1987).
- [171] F. Livolant, Physica A 176, 117 (1991); A. Leforestier, F. Livolant, Biophys. J. 65, 56 (1993); F. Livolant, A. Leforestier, Mol. Cryst. Liq. Cryst. 215, 47 (1992); D. Durand, J. Doucet, F. Livolant, J. Phys. II 2, 1769 (1992).
- [172] L. R. Pratt, G. Hummer, A. E. Garsia, Biophys. Chem. 51, 147 (1994); E. Guardia, R. Rey, J. A. Padro, J. Chem. Phys. 95, 2823 (1991).
- [173] A. P. Lyubartsev, A. Laaksonen, Phys. Rev. E 52, 3730 (1995).
- [174] L. Belloni, O. Spalla, J. Chem. Phys. 107, 465 (1997).
- [175] P. G. Kusalik, G. N. Patey, J. Chem. Phys. 88, 7715 (1988).
- [176] E. Allahyarov, H. Löwen, Phys. Rev. E 63, 041403 (2001).
- [177] B. M. Pettitt, P. J. Rossky J. Chem. Phys. 84, 5836 (1986).
- [178] F. Otto, G. N. Patey, Phys. Rev. E 60, 4416 (1999); J. Chem. Phys. 112, 8939 (2000).
- [179] T. K. Chiu, R. E. Dickerson, J. Mol. Biol. 301, 915 (2000).
- [180] N. Korolev, A. P. Lyubartsev, A. Rupprecht, L. Nordenskiöld, Biopolymers 58, 268 (2001).
- [181] N. Korolev, A. P. Lyubartsev, A. Laaksonen, L. Nordenskiöld, Biophys. J. 82, 2860 (2002).
- [182] M. A. Young, D. L. Beveridge, J. Mol. Biol. 281, 675 (1998).
- [183] P. Linse, J. Phys. Chem. 90, 6821 (1986).
- [184] W. Saenger, Ann. Rev. Biophys. Chem. 16 93 (1987).
- [185] M. A. Young, B. Jayaram, D. L. Beveridge,
- [186] J. R. C. van der Maarel, Biophysical J. 76, 2673 (1999).
- [187] J. Mazur, R. L. Jernigan, Biopolymers 31, 1615 (1991).
- [188] D. N. Petsev, B. R. Thomas, S. T. Yau, P. G. Vekilov, Biophys. J. 78, 2060 (2000).
- [189] A. V. Lukashin, D. B. Beglov, M. D. Frank-Kamenetskii, J. Biomolecular Structure and Dynamics 9, 517 (1991).
- [190] B. Jayaram, A. Das, N. Aneja, J. Mol. Structure 361, 249 (1996).
- [191] S. Leikin, D. C. Rau, V. A. Parsegian, Phys. Rev. A 44, 5272 (1991); R. Podgornik, D. Rau, V. A. Parsegian, Biophys J. 66, 962 (1994); R. P. Rand, N. Fuller, V. A. Parsegian, D. C. Rau, Biochemistry 27, 7711 (1988); C. V. Valdeavella, H. D. Blatt, L. Yang, B. M. Pettitt, Biopolymers 50, 133 (1999); P. Mariani, L. Saturni, Biophysical J. 70, 2867 (1996).
- [192] D. N. Petsev, P. G. Vekilov, Phys. Rev. Letters 84, 1339 (2000).
- [193] G. T. Ibragimova, R. C. Wade, Biophys. J. 74, 2906 (1998).
- [194] H. Liu, J. Gapinski, L. Skibinska, A. Patkowski, R. Pecora, J. Chem. Phys. 113, 6001 (2000).
- [195] L. D. Williams, L. J. Maher III, Annu. Rev. Biophys. Biomol. Struct. 29, 497 (2000).
- [196] Y. Lu, B. Weers, N. C. Stellwagen, Biopolymers 61, 261 (2002).
- [197] C. G. Baumann, S. B. Smith, V. A. Bloomfield, C. Bustamante, Proc. Natl. Acad. Sci. Usa 94, 6185 (1997).
| Set | ||
|---|---|---|
| 1 | 1 | 1 |
| 2 | 2 | 1 |
| 3 | 3 | 1 |
| 4 | 1 | 2 |
| 5 | 3 | 2 |