Spin-resonance modes of the spin-gap magnet TlCuCl3.
Abstract: Three kinds of magnetic resonance signals were detected in crystals of the spin-gap magnet TlCuCl3. First, we have observed the microwave absorption due to the excitation of the transitions between the singlet ground state and the excited triplet states. This mode has the linear frequency-field dependence corresponding to the previously known value of the zero-field spin-gap of 156 GHz and to the closing of spin-gap at the magnetic field 50 kOe. Second, the thermally activated resonance absorption due to the transitions between the spin sublevels of the triplet excitations was found. These sublevels are split by the crystal field and external magnetic field. Finally, we have observed antiferromagnetic resonance absorption in the field-induced antiferromagnetic phase above the critical field . This resonance frequency is strongly anisotropic with respect to the direction of the magnetic field.
1 Introduction.
The spin-gap magnets have been intensively studied during last decades because of various quantum-disordered states found there. The spin-gap structures were found in one-dimensional antiferromagnets like dimerised spin chains, including spin-Peierls magnets [1], spin chains [2], spin ladders [3] and dimer structures [4]. While the disordered ground states of spin-gap systems are stable with respect to a weak interchain exchange or anisotropy, they demonstrate an antiferromagnetic ordering induced by weak doping [5] or by a strong magnetic field [6]. Impurities destroy locally the spin-gap state and restore a local antiferromagnetic order around impurity atoms, the overlapping of these area of local ordering and a weak interchain exchange provide a long range magnetic order. Magnetic field closes the spin gap, thus an ordered state becomes possible. The spin gap magnet TlCuCl3 is a unique substance demonstrating both impurity-induced ordering in zero field [7] and field induced ordering in pure crystals [6, 8].
The crystals of TlCuCl3 have a dimer spin structure formed by the spins of Cu2+ ions. The dimers construct infinite double spin chains coupled to each other, thus the system is strongly coupled 3D dimer network, the structure of exchange interactions is described in [9]. The strongest antiferromagnetic exchange is within the chemical dimer Cu2Cl6 (5.68 meV), the spin-gap value is 0.65 meV.
The field-induced antiferromagnetically ordered phase was found in a magnetic field kOe [6] in measurements of the magnetization. Formation of the field-induced long-range magnetic order was confirmed by means of neutron-scattering experiments [8]. The transition field has a strong temperature dependence [6, 10]. This dependence, unexpected in the mean-field theory, was qualitatively described in the model of Bose-Einstein condensation of magnons [11].
High-frequency magnetic resonance measurements [12, 13] have demonstrated directly the field dependence of the energy gap, but were limited to the fields and a few number of microwave frequencies. Measurements of zero momentum magnetic excitation energy in a wide range of the magnetic fields were performed in the neutron scattering investigation [14]. The closing of the spin gap in the magnetic field was confirmed, but the low-energy range of antiferromagnetic resonance frequencies is beyond the resolution of this experiment because of the strong field-induced magnetic Bragg contamination below 0.75 meV (176 GHz). Thus, no low-frequency response was found in the field range above , and it was suggested that the energy of the lowest excitations is zero at . In the present paper we describe the detailed magnetic resonance study of the crystal samples of TlCuCl3 in the range of microwave frequencies 9 — 80 GHz, in magnetic fields up to 80 kOe. We detected at the first time the magnetic resonance signals in the field-induced ordered phase and measured their frequency-field dependences, which appeared to be nonlinear and strongly anisotropic with respect to the direction of the magnetic field. Besides, we observed the microwave absorption due to the transitions from the ground state to the excited triplet states. Finally, we found electron spin resonance (ESR) signals of the thermally excited triplet excitations. This kind of resonance is due to the transitions between the spin sublevels of triplet states. The evolution of triplet split spectrum to a single exchange narrowed line was observed.
2 Samples and experimental details.
The crystals of TlCuCl3 have monoclinic symmetry with the space group (). The two-fold axis is denoted as . The axes and form an angle of 96.32∘.
The sample growth is described in details in Ref.[6]. Crystals have cleavage planes and . During our experiments we have mounted crystals in the following orientations with respect to the magnetic field: (-axis), and . The direction forms an angle of 51.4∘ with the axis. We used single crystals with the volume of about 20…50mm3. The crystals are hygroscopic, and a hydrated phase was present on the surface of the samples, giving a parasitic paramagnetic resonance signal, this signal grew when samples were exposed at open atmosphere.
ESR spectra were taken by use of a set of home made microwave spectrometers with transmission type cavities and a superconducting magnet. The temperature of the sample was regulated by pumping the vapour above the helium bath surrounding the resonator or, in another cell, by heating the resonator within the vacuum chamber filled with a small amount of heat exchanging gas. ESR spectra were recorded as field dependences of the microwave power transmitted through the cavity with the sample.
3 Experimental results.
3.1 ESR at different temperatures.
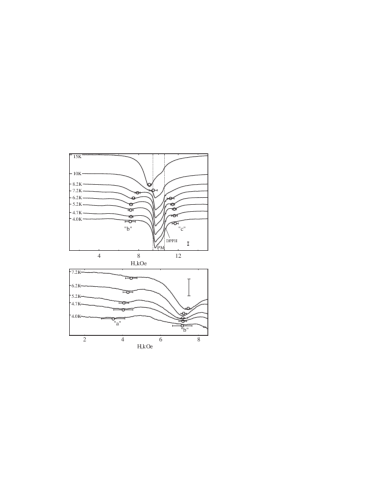
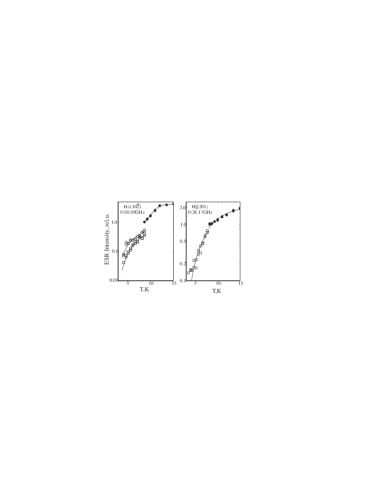
The temperature evolution of an ESR absorption curve in the low-field range is presented in Figs. 1 and 2, the high-field data are illustrated in Fig. 3. The absorption spectrum consists of several components, which demonstrate different kinds of temperature dependences of the intensity and the resonance field.
At first, there are several components located near the paramagnetic resonance field (e.g., near 10 kOe for the microwave frequency =30.05 GHz, as shown on Fig.1). The parasitic absorption takes place in the field range marked as PM, and has the Curie-like behavior of the integrated intensity. The shape of this absorption curve is typical for powder samples, with two sharp boundaries originating from the maximum and minimum values of an anisotropic -factor. The lineshape and position of this absorption do not depend on the orientation of the magnetic field with respect to crystal axes. From the intensity of the paramagnetic resonance signal of the hydrated surface we estimate the number of the paramagnetic ions in this spoiled area of the crystal as 0.02 from the total number of magnetic ions.
Apart from the parasitic signal, we observe thermally activated resonance absorption (lines marked in order of their resonance field increase as “a”, “b” and “c”, see Fig. 1). The resonance fields of these components are temperature dependent, they become closer to each other as temperature rises and finally coalescence to a single line at K. As expected for Cu2+ ions, the -factor of this single line is close to 2.0 and its anisotropy does not exceed 15%. At low temperature the resonance field of the component “a” is close to a half of the resonance field of free spins ( is the microwave frequency), and the resonance fields of components “b” and “c” are located on both sides from . The splitting of the single resonance line into several components with decreasing temperature was observed for all three orientations of the applied magnetic field. However, the half-field absorption component “a” was not observed for , and the component “b” can not be resolved on the background of the strong parasitic paramagnetic absorption for . The temperature dependences of resonance fields and intensities for thermally activated components are given in Figs. 4, 6. The “a” component intensity is small, the most part of the ESR intensity is concentrated in “b” and “c” components. The intensities of these components are slightly different (this difference is of about of 10% of the total intensity). The position of the more intensive component is orientation dependent: for the “b” component is more intensive, while for the “c” component conserves more then a half of the total intensity when measured at the temperature of splitting. The intensities of components “a”, “b”, “c” decrease quickly with decreasing temperature, practically disappearing near 1.5 K.
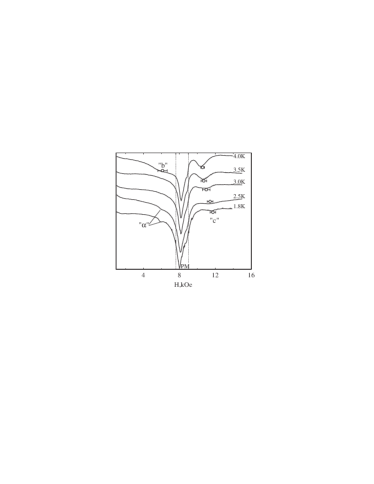
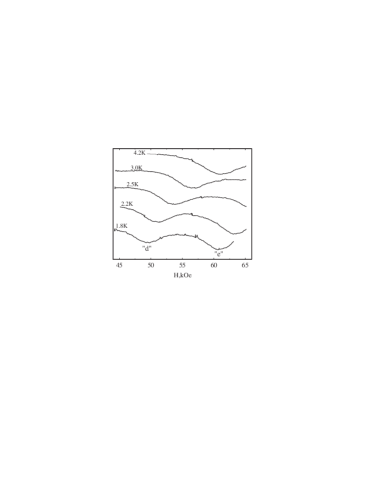
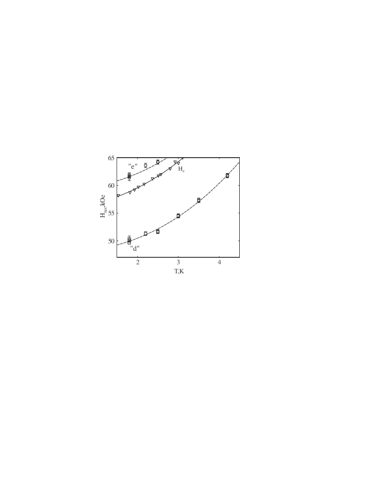
The ESR absorption in the high-field range (Fig. 3) was observed only at temperatures below 4.2 K. Here the absorption line consists of the two components marked by the letters “d” and “e”, located on both sides of the critical field . Both components shift to the higher fields with temperature increase (see Fig. 5), in accordance with the increase of the critical field [10].
3.2 Magnetic resonance spectra.
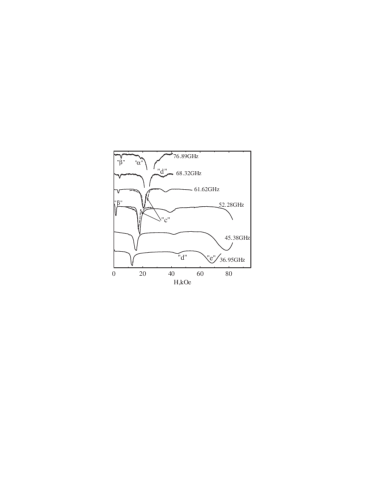
ESR absorption lines taken at different frequencies are presented at the Fig. 7. Besides of the above-described components “a”…“e”, two additional absorption components (“” and “” in Fig. 7) are observed to the left of the paramagnetic resonance field. A weak line “” demonstrates a linear spectrum with -factor value close to 3.0. It is probably due to impurities, their concentration is of about . The component “” demonstrates nonlinear and anisotropic frequency-field dependence with the gap of 50 GHz. Its shape is irregular and intensity increases with decreasing temperature. The origin of the component “” is unclear. Probably, it is also due to impurities or additional parasitic phase.
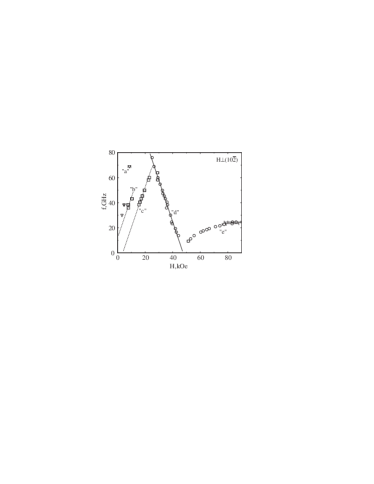
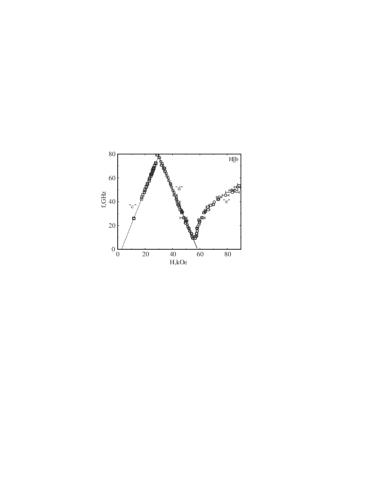
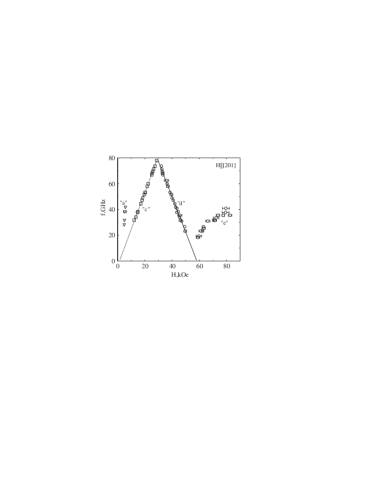
The measured field-dependences of ESR frequencies for three perpendicular orientations of the magnetic field (, and ) are given in Figs. 8, 9 and 10.
The resonance fields of thermally activated components “a”, “b” and “c” increase with the increase of the microwave frequency. ESR lines “b” and “c” show linear dependences. However, the linear extrapolation of their resonance frequencies to zero field results in nonzero values. The magnitude of the splitting between “b” and “c” components is of about 10 GHz. The fine details of the frequency-field dependences of thermally activated components measured at two temperatures 4.2 K and 1.5 K are shown in the Fig. 11. Note, that for the observation of the ESR signals from noninteracting triplet excitations (at small population numbers) we have to deal at the lowest temperature. From the other side the freezing out of the intensity of these components complicates the detection of signals and the measurement of resonance fields. At both temperatures the observed ESR frequencies of the “b” and “c” spectral components may be described well by the linear equation
| (1) |
The fitting procedure according to equation (1) for temperature independent but anisotropic -factor, and temperature-dependent constants results in the following values:
-
: , GHz, GHz
-
: , GHz, GHz
-
: , GHz, GHz
The correspondence of the fitting dependences and experimentally observed frequencies is illustrated on the Fig.11 and is quite satisfactory. The -factor values determined from the fitting of the split low-temperature spectra coincides within the experimental error with the values measured above 10K, as well as with the -factor values measured in the Ref.[6] (=2.06, =2.23).
High-field absorption components “d” and “e” differ strongly in their frequency-field dependences. The resonance “d” (to the left of the critical field ) linearly shifts to lower fields at the frequency increase. This ESR mode can be identified as absorption due to the transitions between singlet ground state and gapped triplet states, analogous to the absorption observed in [12, 13]. The component “e” shifts to the higher fields with increasing frequency, its frequency-field dependence is nonlinear and anisotropic with respect to the orientation of the external field. This resonance mode was not reported in previous investigations.
4 Discussion.
4.1 ESR of the triplet excitations.
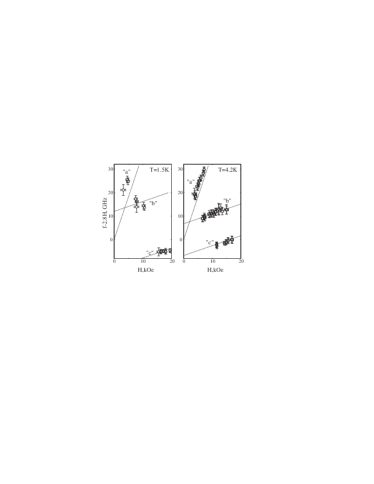
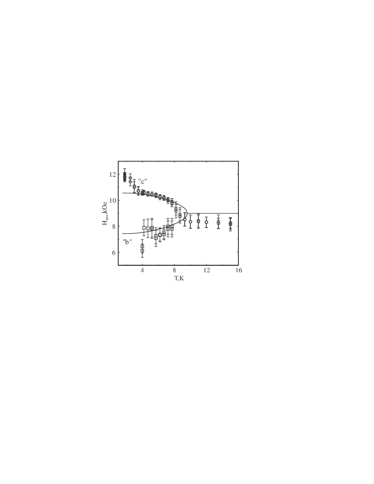
The thermal activation of the absorption lines “a”, “b”, “c” indicates that they are due to the gapped triplet excitations. The growth of intensity of these components beginning at K correlates well with the growth of the susceptibility measured in Ref.[6] and with the gap value 7.7 K. A remarkable feature of the observed triplet ESR is the splitting of this resonance into two components, and arising of a weak component “a”.
While the magnetic resonance frequency of isolated Cu2+ ions is not affected by the crystal field, the excitations of a system of exchange-coupled Cu2+ ions are triplets carrying spins . Therefore the magnetic resonance frequency of triplets should be influenced by a crystal field. The crystal field splits magnetic sublevels of a spin =1 state even at zero magnetic field [15]. This splitting results in a three-component spectrum, corresponding to the transitions between different pairs of the spin sublevels. Thus, we interpret the observed lines “a”, “b”, “c” as absorption due to transitions between the sublevels of triplet excitations, inegrated over the thermally excited ensemble of triplet excitations.
The coalescence of the ESR line components at the temperature increase corresponds to the scenario of the formation of the exchange narrowed ESR line [16]: when the exchange interaction between the spins precessing with different frequencies is weak (slow exchange limit), there are separate modes of magnetic resonance. For the opposite limit, when the exchange frequency is greater than the difference in eigenfrequencies, a single collective mode is formed, known as exchange-narrowed mode. For thermally activated spins the exchange frequency is temperature dependent. The scenario with the transition from the slow to the fast limit of the exchange narrowing of ESR lines was observed earlier, e.g., in magnetic resonance study of molecules with thermally activated spin states [17] and at the temperature evolution of the ESR spectra of the spin-Peierls magnet CuGeO3 doped with impurities [18, 19]. The observed evolution of the triplet ESR lines in TlCuCl3 follows the same scenario. At low temperatures the concentration of triplets is small and three-component ESR of noninteracting spins in a crystal field is observed. At the larger concentration of activated spins (at higher temperatures) the components merge in a single ESR line.
Starting from this qualitative consideration of thermally activated resonances we can further describe on a quantitative level the ESR frequencies at low temperature and the temperature evolution.
The ESR frequencies are explained (see e.g. Ref.[20]) by assuming an effective Hamiltonian for the triplet with the wavevector given by
| (2) |
here is a -tensor, , are the anisotropy constants. The anisotropy constants values may be -dependent, as, e.g. in a Haldane magnet Ref.[21].
Considering the anisotropy terms as a perturbation to the Zeeman term, in the first order of the perturbations theory one obtains for the energy levels
| (3) | |||
| (4) |
here is the unit vector parallel to the magnetic field.
The observable spectrum should be determined by the anisotropy constants , averaged over the ensemble of triplet excitations at given temperature . Thus, the values and , resulting from the averaging of and , turn out to be temperature dependent. The averaged transition frequencies are
| (5) | |||
| (6) |
Two of three resonance frequencies correspond to the observed frequency-field dependences presented by Eqn.(1) with the splitting constant dependent on the orientation only. The resonance field of the third mode should be equal to the one-half of the field . The observed ESR lines “a”, “b”, “c” correspond well to spin resonance modes , . The deviation of the resonance frequencies from the free spin resonance frequency for one of the three arbitrary mutually orthogonal directions of the external field should be equal to the sum of the deviations for two other directions. This relation is valid for the measured deviations , confirming that the observed splitting is due to the crystal field.
The triplet excitations are multi-spin objects, hence, the symmetry of the effective crystal field should be determined by the crystal symmetry and not by the symmetry of the local surrounding of the magnetic ions. Thus, one axis of the symmetry of the effective field should be aligned along the two-fold axis , we note it as . The other two axes lie within the plane of the crystal. To determine the values of the anisotropy constants and we suppose that the axis is directed along the direction of spin-ordering at (i.e. at an angle of 39∘ from the -axis in the plane) [8].
Then, using Eqn.(5), and observed values of , we obtain that and are of the same sign, and their magnitudes are
| at T=1.5K: | GHz, |
|---|---|
| GHz | |
| at T=4.2K: | GHz, |
| GHz |
The signs of anisotropy constants can be determined from the relation between the intensities of the spectral components shown in Fig. 6. Due to the difference in population numbers of different energy levels at finite temperature, at the absorption related to the transitions is larger then that related to the transitions . Position of the resonance field , corresponding to the transitions , with respect to the field depends on the orientation and on the sign of the anisotropy constants (see Eqns. (3),(4)):
| (7) |
The more intensive component is observed to the left from at and to the right from at . Then we conclude that both and are positive.
The observed change of the anisotropy constants and with temperature probably indicates the change of the distribution of the thermally excited triplet excitations in the phase space. At low temperature T=1.5 K the triplets are excited mainly near the bottom of the triplet band, while at T=4.2 K (this temperature corresponds to one half of the spin-gap energy) the triplets are excited over the whole band.
The temperature evolution of the thermally activated lines, shown in Fig. 4, may be analyzed using the approach of the exchange narrowed spin resonance [16]. We neglect here the intensity of the almost prohibited two-quantum component “a”, and the difference between the intensities of components “b” and “c”. The frequency shift from the center of gravity of the ESR spectrum is given by the following equations of Ref. [16]:
| (8) | |||||
| (9) |
Here are the deviations of the resonance frequencies from the center of gravity of the ESR line in the absence of the exchange narrowing, and is the average exchange frequency.
For thermally excited magnetic states, the exchange frequency is temperature dependent [17]
| (10) |
here K is a zero-field energy gap.
The theoretical curves, calculated using Eqns.(8)-(10), are shown at the Figure 4. We have taken the splitting value to be equal to splitting at 4.2 K and used preexponential factor as a fitting parameter. The fitting curves presented by solid lines in Fig. 4 correspond to the value GHz.
The model of exchange narrowing used here is simplified. First, it does not include the temperature dependence of the effective anisotropy constants and . Another simplification is ignorance of the field dependence of the energy gap and of the different population numbers of energy levels. Particularly, this simplified model can’t explain the abrupt change of the resonance frequency of component “b” between the temperatures 1.5 and 4 K. Probably, this change is due to the expanding of the phase space occupied by the excited triplets at K, resulting in change of the effective constants and .
4.2 Singlet-triplet transitions.
The ESR component “d” corresponds to direct over-gap transitions between singlet ground state and gapped triplet states. It is the same type of ESR absorption as reported earlier for higher frequencies [12, 13]. The ESR spectrum of this component may be described by the linear equation
| (11) |
here is expected to be close to the spin-gap and is the effective -factor.
The straight lines on Figs.8, 9 and 12 present results of the linear fitting according to the relation (11) with the parameters given in Table 1.
| , GHz | |||
|---|---|---|---|
| T=1.5K | |||
| T=4.2K | |||
The value obtained from linear extrapolation corresponds well to the value of 156 GHz observed in other ESR [12, 13] and neutron studies[14]. The effect of crystal field discussed in the previous Section affects the triplet levels and should distort the linear dependence (11): at zero field the curves taken at different orientations of the magnetic field should start from the same point , then at they should have the linear asymptotic dependence, which may be easily obtained from Eqn.(3):
| (12) |
Thus, the measured values of for different orientations should differ from the spin-gap value for 5 GHz. This shift is within the experimental resolution for the value of obtained from the frequency of line “d”.
The value of measured at 1.5 K coincides well with the -factor values determined from the ESR of the thermally activated triplets. However, at 4.2 K the slope of this linear dependence becomes smaller for the factor of 0.75, while the value of obtained from the extrapolation to zero field remains constant within the experimental error of 10%. Thus the increase of the critical field value at the increase of temperature should be ascribed to a change of the field influence on the singlet-triplet gap with temperature and not to the change of the zero-field gap. It is important to note here, that the value of is temperature dependent, but the -factor describing the field-dependence of the sublevels of the excited triplets does not depend on the temperature. The change of the effective -factor may be presumably attributed to the effect of the thermal renormalization of magnon frequency observed for the related compound KCuCl3 [22]. The temperature when the value of is changing is about the spin-gap value in the magnetic field, thus the renormalization is probable.
From the frequency-field dependences for singlet-triplet absorption we determine the critical field as a field, at which the singlet-triplet transition frequency turns to zero. These values measured at K are: kOe, kOe and kOe. These data are in agreement with magnetization and specific heat data [6, 10].
4.3 Magnetic resonance in the field-induced magnetically ordered phase.
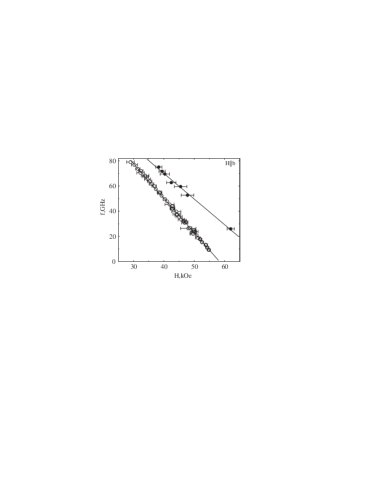
The component “e” of the ESR line observed at , shown in Fig. 3, demonstrates nonlinear and anisotropic spectrum presented on Figs. 8,9,10) and constitutes an antiferromagnetic resonance mode. The relative difference in resonance fields measured for different orientation of the sample in this field range is much larger than the relative change in -factors in the paramagnetic phase. This essential anisotropy marks the spontaneous symmetry breaking due to the magnetic ordering above .
No theory of the antiferromagnetic resonance in the field-induced antiferromagnetic phase is developed yet. The theory should consider the unsaturated order parameter which is induced by the magnetic field. Possible longitudinal oscillations of the order parameter should be taken into account.
We propose here a simplified treatment of the observed mode based on a molecular-field model, see, e.g. [23]. This model appeared to be adequate for the description of spin resonance modes in most conventional antiferromagnets, as well as in impurity-induced ordered phases of spin-gap magnets [24, 25]. According to this model, antiferromagnetic resonance modes correspond to oscillations of the order parameter and magnetization, which are affected by the crystal field anisotropy and external field. The antiferromagnetic resonance frequencies are determined by the exchange energy and by the anisotropy terms of the second order in the series expansion of the energy. For a monoclinic crystal the second-order terms have orthorhombic (two-axes) symmetry [26]. One of the symmetry axes of the second order anisotropy terms has to be aligned along the two-fold axis . As at the above analysis of triplet ESR, we chose another axis along the easy-spin direction caused by the magnetic field in -direction – at an angle of 39∘ from -axis in the plane.
Thus, at magnetic field lies along an anisotropy axis. For magnetic field is oriented at an angle of 77.6∘ with respect to the second anisotropy axis, and for – at an angle of 12.4∘. These angles are close to 90∘ and 0∘, respectively, allowing an approximate description of the resonance spectra by the relations derived for exact orientations. There are two branches of the antiferromagnetic resonance absorption [23]. In the high-field range above the spin-flop transition, the first branch has the frequency, approaching to the paramagnetic resonance frequency, and the frequency of the second branch does not depend on the field (under the assumption of constant sublattice magnetization):
-
for parallel to the hard axis of anisotropy
(13) (14) -
for parallel to the second-hard axis of anisotropy
(15) (16) -
for parallel to the easy axis and above the spin-flop field
(17) (18)
here , , is magnetomechanical ratio, and are two effective anysotropy fields and exchange field respectively. Each of the values and is proportional to sublattice magnetization, hence to the order parameter.
The branch has the frequency beyond our range 80 GHz in fields above 50 kOe. Thus we conclude that the resonance frequency in the high-field phase of TlCuCl3 corresponds to the branch of a two-axes antiferromagnet. The observed field-dependence of resonance frequencies should be ascribed to the specific nature of the field-induced ordering, when the order parameter is induced by the magnetic field and rises from zero at . Hence we suppose the resonance frequency observed at is a measure of the field-induced order parameter.
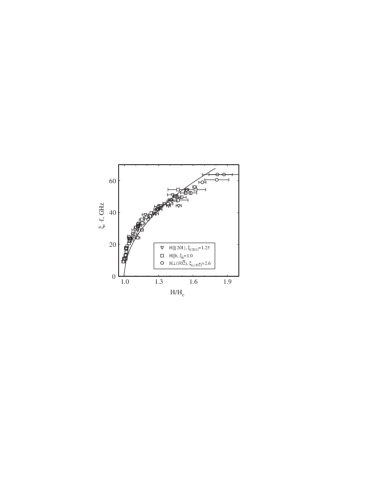
This treatment suggests a universal dependence of normalized resonance frequency on the normalized field. The universality takes place indeed: as shown on the Fig.13, three normalized frequency-field dependences taken for different field orientations coincide well. The normalization factors for resonance frequency are: 1.0 for , 1.25 for the and 2.6 for the .
The measured antiferromagnetic resonance frequencies follow a square root dependence on the magnetic field (solid line on the Fig.13):
| (19) |
The above consideration of the field-induced order parameter is consistent with the results of the neutron scattering experiments performed for [8], where the square root field dependence was also confirmed near .
5 Conclusions.
The detailed ESR study of the spin-gap compound TlCuCl3 revealed three kinds of magnetic resonance signals.
New kind of magnetic excitations not reported before is the antiferromagnetic resonance mode in the field-induced ordered phase. This branch of spin excitations demonstrates nonlinear and strongly anisotropic spectrum. From the spectrum of this branch, in the molecular field approximation, we deduce, that the field-induced order parameter has a universal dependence for all directions of the magnetic field: .
Second, we have observed direct ESR transitions between the singlet ground state and excited triplet state. The negative field-dependent contribution to the singlet-triplet transition frequency is temperature dependent. The nature of this temperature dependence is probably due to the thermal renormalization of the magnon frequencies. The quantitative theory of this renormalization is to be constructed.
Third, we found magnetic resonance signals of thermally activated triplet excitations, and measured the crystal-field splitting of their spin sublevels. The effective energy of the interaction between the triplet excitations and the crystal field is obtained. The formation of the exchange narrowed collective resonance mode of the interacting triplet excitations was observed.
6 Acknowledgements.
Authors acknowledge to A.Vasil’ev, A.Kolezhuk, M.Zhitomirsky, V.Marchenko for discussions. The work is supported by the Russian Foundation for Basic Research Grant No 03-02-16579, INTAS Grant N 04-5890.
References
- [1] M. Hase, I. Terasaki and K. Uchinokura, Phys. Rev. Lett., 70, 3651 (1993).
- [2] L. P. Regnault, I. Zaliznyak, J. P. Renard, C. Vettier Phys. Rev. B, 50, 9174 (1994).
- [3] E. Dagotto and T. M. Rice, Science 271, 618 (1996).
- [4] H. Kageyama, K. Yoshimura, R. Stern et al. Phys. Rev. Lett., 82, 3168 (1999).
- [5] L. P. Regnault, J. P. Renard, G. Dhalenne and A. Revcolevschi, Europhys. Lett., 32, 579 (1995).
- [6] A. Oosawa, M. Ishi and H. Tanaka. J.Phys.:Condens.Matter, 11, 265 (1999).
- [7] A. Oosawa, T. Ono and H. Tanaka. Phys. Rev. B, 66, 020405(R) (2002)
- [8] H. Tanaka, A. Oosawa, T. Kato et al. J. Phys. Soc. Jpn., 70, 939 (2001).
- [9] A. Oosawa, T. Kato, H. Tanaka et al. Phys. Rev. B, 65, 094426 (2002).
- [10] A. Oosawa. Phys. Rev. B, 63, 134416 (2001).
- [11] T. Nikuni, M. Oshikawa, A. Oosawa, H. Tanaka. Phys. Rev. Lett., 84, 5868 (2000).
- [12] H. Tanaka, T. Takatsu, W. Shiramura et al. Physica B, 246-247, 545 (1998).
- [13] K. Takatsu, W. Shiramura, H. Tanaka et al. J. Magn. & Magn. Mater., 177-181, 697 (1998).
- [14] Ch. Rüegg, N. Cavadini, A. Furrer et al. Nature 423, 62 (2003)
- [15] A. Abragam, B. Bleaney, Electron paramagnetic resonance of transition ions, (Oxford: Clarendon) 1970.
- [16] P. W. Anderson. J. Phys. Soc. Jpn, 9, 316 (1954).
- [17] D. B. Chestnut and W. D. Phillips. J. Chem. Phys., 35, 1002 (1961).
- [18] V. N. Glazkov, R. M. Eremina, A. I. Smirnov et al. JETP, 93, 143 (2001).
- [19] A. I. Smirnov, V. N. Glazkov and S. S. Sosin. JETP Lett., 77, 442 (2003).
- [20] M. Date and K. Kindo. Phys. Rev. Lett., 65, 1659 (1990)
- [21] L-P. Regnault, I. A. Zaliznyak, S. V. Meshkov, J. Phys.: Condens. Matter, 5, L677-L684 (1993).
- [22] N. Cavadini, Ch. Rüegg, W. Henggeler et al. Eur. Phys. J. B, 18, 565 (2000).
- [23] T.Nagamiya, K.Yosida and R.Kubo. Advances in Physics, 13 (1955).
- [24] V. N. Glazkov, A. I. Smirnov, K. Uchinokura and T. Masuda. Phys. Rev. B, 65, 144427 (2002).
- [25] A. I. Smirnov, V. N. Glazkov, H.-A. Krug von Nidda et al. Phys. Rev. B, 65, 174422 (2002).
- [26] A. N. Vasil ev, V. I. Marchenko, A. I. Smirnov et al. Phys. Rev. B, 64, 174403 (2001).