Competition between hidden order and antiferromagnetism in URu2Si2 under uniaxial stress studied by neutron scattering
Abstract
We have performed elastic neutron scattering experiments under uniaxial stress applied along the tetragonal , and directions for the heavy electron compound URu2Si2. We found that antiferromagnetic (AF) order with large moment is developed with along the [100] and [110] directions. If the order is assumed to be homogeneous, the staggered ordered moment continuously increases from 0.02 () to 0.22 (). The rate of increase is 1.0 /GPa, which is four times larger than that for the hydrostatic pressure ( 0.25 /GPa). Above 0.25 GPa, shows a tendency to saturate, similar to the hydrostatic pressure behavior. For , shows only a slight increase to 0.028 () with a rate of 0.02 /GPa, indicating that the development of the AF state highly depends on the direction of . We have also found a clear hysteresis loop in the isothermal curve obtained for under the zero-stress-cooled condition at 1.4 K. This strongly suggests that the -induced AF phase is metastable, and separated from the “hidden order” phase by a first-order phase transition. We discuss these experimental results on the basis of crystalline strain effects and elastic energy calculations, and show that the ratio plays a key role in the competition between these two phases.
pacs:
71.27.+a, 75.25.+z, 75.30.Kz 75.30.MbI Introduction
The nature of the phase transition at in URu2Si2 (the ThCr2Si2-type, body-centered tetragonal structure) rf:Palstra85 ; rf:Schlabitz86 ; rf:Maple86 is presently one of the most challenging issues in the heavy-electron physics. The elastic neutron scattering experiments rf:Broholm87 ; rf:Mason90 ; rf:Fak96 indicate that the simple type-I antiferromagnetic (AF) order develops below . However, the obtained staggered moment is extremely small (), and incompatible with the large bulk anomalies such as the specific heat jump at (). This inconsistency has been puzzling many researchers for almost twenty years, i.e., whether the intrinsic order parameter is the tiny magnetic moment or some unidentified “hidden” degree of freedom. The key to this issue has been recently obtained from the microscopic studies performed under hydrostatic pressure . We found from the neutron scattering experiments that is strongly enhanced by applying pressure from 0.017 () to 0.25 ().rf:Ami99 ; rf:Ami2000 In parallel, the 29Si-NMR study revealed that the system is spatially separated into two differently ordered regions below : one is AF with a large moment and the other is non-magnetic. rf:Matsuda2001 ; rf:Matsuda2003 The AF volume fraction is found to increase with , roughly in proportion to , while the magnitude of internal field is almost independent of . This indicates that the observed enhancement of the AF Bragg-peak intensities is attributed to the increase of the AF volume fraction, and not of the local AF moment. Simple extrapolation yields the AF volume fraction at ambient pressure of about 1%, strongly suggesting that this is the true nature of the tiny magnetic moment. Consequently, the remaining 99% is considered to be occupied by the “hidden order”, which is responsible for the large bulk anomalies at .
The major purpose of the present study is to investigate how these two types of order correlate with each other. In order to find a relevant parameter, we here examine the effects of lattice distortion. So far various ideas for the hidden order parameters have been proposed, including valence transition, rf:Barzykin95 uranium dimers, rf:Kasuya97 unconventional spin density waves, rf:Ikeda98 ; rf:Virosztek2002 quadrupolar order rf:Ami94 ; rf:Santini94 ; rf:Takahashi2001 ; rf:Ohkawa99 ; rf:Tsuruta2000 and charge current order.rf:Chandra2001 ; rf:Chandra2001-2 All of them involve a magnetic instability such that the dipolar order may be replaced with the majority hidden order. This switching is expected to be driven by lattice distortion, since the proposed hidden order parameters are tightly coupled to the lattice system. It is thus interesting to investigate the competition between the two types of order by tuning the crystal distortion.
A second purpose is to find the relationship between the two ordered states. The 29Si-NMR results indicate that the AF order develops in parts of the crystal. However, it is not clear whether it is inevitably induced through some coupling with the hidden order parameter, or simply replaced with hidden order by a first order phase transition. In the latter case, hysteretic behavior can be expected in the pressure variations of the AF state. This point, however, was not checked in the previous measurements, rf:Ami99 ; rf:Ami2000 where samples were always compressed at room temperature.
For these purposes, we have performed elastic neutron scattering experiments on URu2Si2, by applying uniaxial stress under both the stress-cooled and the zero-stress-cooled conditions. We have previously reported some experimental results obtained for weak up to 0.46 GPa. rf:Yoko2002 ; rf:Yoko2003 In the present paper, we have extended the range up to 0.61 GPa, and also investigated a Rh-doped system U(Ru0.99Rh0.01)2Si2. The collected results are discussed and interpreted in terms of a lattice distortion (or stress) model involving a distribution of the ratio.
II Experimental Procedure
A single-crystalline sample URu2Si2 was grown by the Czochralski pulling method using a tri-arc furnace, and vacuum-annealed at 1000oC for a week. Three plates with three different bases of (001), (100) and (110) planes were cut from the crystal by means of spark erosion. The dimensions of the plates are approximately 25 mm2 1 mm. The uniaxial stress was applied along the , and axes up to 0.61 GPa, by placing the samples between Be-Cu piston cylinders mounted in a clamp-type pressure cell. This cell was used for measuring the temperature variations of the AF state down to 1.5 K under the stress-cooled condition, where the stress was changed at room temperature.
The elastic neutron scattering experiments were performed by using the triple-axis spectrometer GPTAS (4G) located in the JRR-3M research reactor of Japan Atomic Energy Research Institute. The neutron momentum was chosen by using the (002) reflection of pyrolytic graphite (PG) for both monochromating and analyzing the neutron beam. We used the combination of 40’-80’-40’-80’ collimators, together with two PG filters to eliminate the higher order reflections. The scans for the stress-cooled process were performed in the (), ( and () scattering planes for , and , respectively. The AF Bragg reflections were obtained by the (100) scans for , the (100), (102) and (203) scans for , and the (111) and (113) scans for .
For the measurements under the zero-stress-cooled condition, we used a constant-load uniaxial stress apparatus. rf:Kawa2002 In this apparatus, the Be-Cu pistons in the pressure cell, which is attached to the bottom of the 4He cryostat insert, is compressed by an oil-pressure device mounted on the top of the insert via a movable rod made of stainless-steel and tungsten carbide. The load is precisely stabilized by controlling the oil pressure during the measurements. We first cooled the sample down to 1.4 K without compression, and then applied the uniaxial stress along the [110] direction up to 0.4 GPa, keeping the sample at the same temperature. The scans for the zero-stress-cooled condition were performed in the scattering plane. The AF Bragg reflections were obtained by the longitudinal scans at the (111) position. The experiments under the zero-stress-cooled condition ( ) were also performed on the Rh-doped alloy U(Ru0.99Rh0.01)2Si2, which was prepared in the same procedure as the pure compound. The (100) magnetic Bragg reflections were investigated by using longitudinal scans in the () scattering plane at 1.4 K.
III Experimental Results
III.1 Elastic neutron scattering under stress-cooled condition
Figure 1 shows the variations of the longitudinal and transverse scans at 1.5 K through the (100) magnetic peak for and , and the longitudinal scans through the (111) peak for . The instrumental background and the contamination of the higher-order nuclear reflections were carefully subtracted by using the data taken at 40 K. As stress is applied along the direction, the (100) peak intensity markedly increases (Fig. 1(a) and (b)). The (102) and (203) peaks also develop rapidly (not shown). The intensities of these three magnetic reflections divided by the polarization factor roughly follow the dependence of the magnetic form factor rf:Frazer65 of U4+. On the other hand, no reflection is observed at (001) position and also in the scans along the principal axes in the first Brillouin zone: , and for . These results indicate that the type-I AF structure with moments polarized along the axis is unchanged by the application of . The development of the magnetic scattering is also observed for (Fig. 1(c)). From the same analyses, we confirm that the AF structure is unchanged also for . In contrast to the compression along the basal plane, the increase of magnetic reflections for is very small (Fig. 1(d)), indicating that the AF state strongly depends on the direction of .
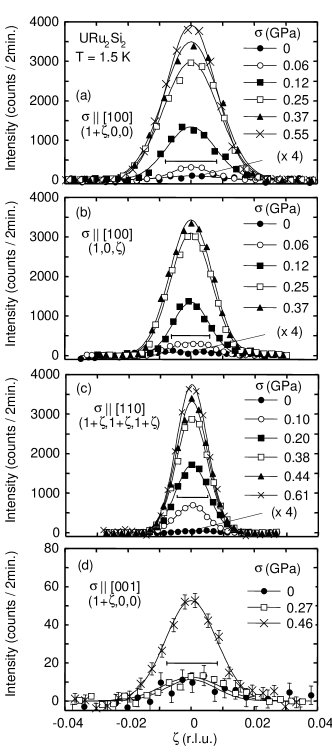
The magnetic Bragg peaks observed at (100) and (111) were fitted by the Lorentzian function convoluted with the Gaussian resolution function, to estimate the correlation lengths of the AF moment. The instrumental resolutions are estimated from the widths (FWHM) of higher-order nuclear reflections measured at the corresponding positions without PG filters. At ambient pressure, along the , and directions are estimated to be about 150 , 260 and 330 , respectively. They increase rapidly by applying along the and directions. Above 0.3 GPa, the peak widths approach the resolution limit (), and the simple fits give the values of approximately 2.5 times larger than those for . On the other hand, for remains around a small value of 230 even at 0.46 GPa. These results indicate that the increase of is accompanied by the enhancement of the AF Bragg-peak intensities.
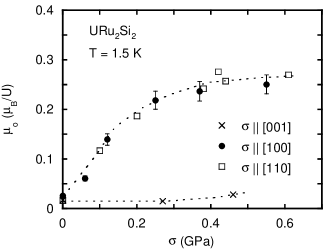
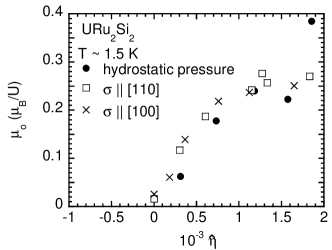
Displayed in Fig. 2 is the dependence of the staggered moment at 1.5 K. The magnitudes of are obtained from the integrated intensities of the magnetic Bragg peaks at (100) for and , and at (111) for , which are normalized by the intensities of the weak nuclear (110) reflection for and , and (101) for . We should note that the values estimated here are based on the assumption of homogeneous AF order. At , is 0.020(4) , which roughly corresponds with the values of previous investigations. rf:Broholm87 ; rf:Mason90 ; rf:Fak96 As stress is applied along the direction up to 0.25 GPa, is strongly enhanced to 0.22(2) , and then shows a tendency to saturate above 0.25 GPa. The value at 0.55 GPa is estimated to be 0.25(2) . The ) curve for is quite similar to that for the hydrostatic pressure. rf:Ami99 ; rf:Ami2000 This similarity strongly suggests that the enhancement of under is also attributed to the increase of the AF volume fraction. However, the estimated rate of increase, 1.0 , is much larger than that for the hydrostatic pressure, 0.25 . Interestingly, also develops with , tracing the curve for within the experimental accuracy. For , on the other hand, slightly increases to 0.028(3) at 0.46 GPa, with a small rate 0.02 .
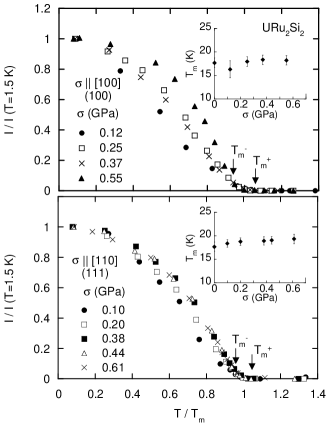
In Fig. 3, we plot the normalized Bragg-peak intensity for and as a function of normalized temperature , where is defined as the onset temperature of as follows. Upon cooling, starts increasing at a temperature and exhibits a -linear dependence below . The width, , of this “tail” of is estimated to be 2–3 K, and we define as the midpoint of and . Although the experimental errors are somewhat large, the variations of fall in the range of from 17.7 K, thereby showing a remarkable contrast with the large variations of . The observed weak variations of are not inconsistent with the variation of (), which is obtained from the electrical resistivity measurements for .rf:Bakker92 For a weak stress range , the curves for both the directions exhibit unusually slow saturation with decreasing temperature. For further compression, shows a sharper onset and more rapid saturation, pronounced in a rounding curvature for .
III.2 Elastic neutron scattering under zero-stress-cooled condition
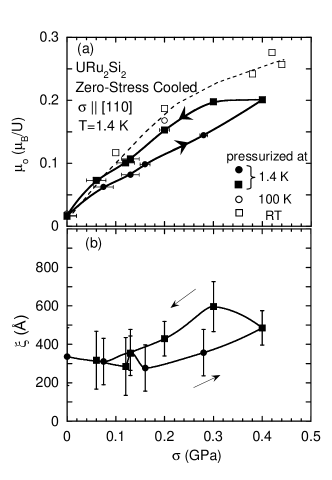
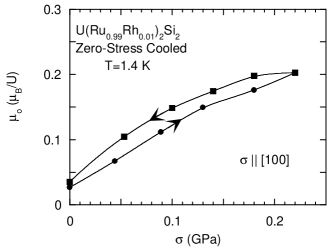
Figure 4 (a) shows the variations of for , obtained from the increasing and decreasing sweeps at 1.4 K under the zero-stress-cooled condition. The value is estimated from the integrated intensity of the (111) magnetic Bragg peaks normalized by using the nuclear (110) reflection. The curve shows a clear hysteresis loop. As is applied, develops linearly from 0.016(4) () to 0.20(1) (). Upon decompression, on the other hand, shows nearly -independent behavior between 0.4 and 0.3 GPa, and then starts decreasing. After the cycle of compression, returns approximately to the initial value at ambient pressure. The curve for the -decreasing process is very similar to that obtained under the stress cooled condition.
In general, the application of may increase the crystalline mosaic, which weakens the extinction of reflection and leads to a significant error in the estimation of the intrinsic neutron scattering intensity. Within the pressure range of the present measurements, the intensity of the magnetic (111) peak is always smaller than that of the nuclear (110) reference peak. Normally, the stronger the reflection, the larger the influence of extinction. We, however, observed that the integrated intensity of the (110) peak increases by , which is much smaller than that of the (111) peak. In addition, the difference of the (110) peak intensity between the increasing and decreasing sweeps is within the range of , which is also much smaller than that of the (111) peak intensity. The observed enhancement of the magnetic (111) reflection is thus not due to the variation of the extinction effects. We also checked the instrumental error of between the stress-increasing and decreasing processes by using a strong (220) nuclear reflection. The variations of the integrated intensity due to the extinction effects show no significant hysteresis, and we confirm that the error of between the two processes is at most , as indicated by error bars in Fig. 4.
The widths (FWHM) of the (111) magnetic Bragg-peaks are slightly larger than the instrumental resolution, and in Fig. 4 (b) we show the correlation length of the AF moment along the [111] direction as a function of . At ambient pressure, is estimated to be about 340 . As is applied to 0.4 GPa, increases to . Upon decompression, it continues to increase, reaches a maximum at 0.3 GPa, and then returns to near the initial value. Although the experimental errors are large, one can see a qualitative correspondence between the and the curves. The hysteresis loops observed in the and curves strongly suggest that the -induced AF order is metastable and separated from hidden order by a first-order phase transition.
IV Discussion
IV.1 Crystal strains under hydrostatic pressure and uniaxial stress
It is important to remark that the uniaxial stress applied in the plane brings about similar characteristics of the AF order, magnitude of as well as its and dependences, to those given by hydrostatic pressure. rf:Ami99 ; rf:Ami2000 This implies that there is an implicit and common parameter leading to an equivalent effect in the different types of compression. In this subsection, we discuss the crystal strains caused by and , and propose that the ratio plays an important role in the competition between the two ordered phases.
Within the linear approximation, the uniaxial stresses in the tetragonal crystal symmetry are coupled with the strains by the relation,
| (19) |
where the ’s, ’s and ’s indicate the uniaxial stresses, elastic constants and strains. The elastic energy symmetrized in the tetragonal point group can be expressed by the form: rf:Morin88
The definition of the ’s and ’s are given in Table 1. These notations for the strains are useful in discussing the symmetry of lattice distortion. For example, the strains of , , and types break the tetragonal symmetry, while the strains of type change the volume and the ratio, conserving the tetragonal symmetry. We also show in Table 2 the symmetrized strains divided by the stresses, for , , and , calculated from Eq. (19).
| Strains | Elastic Constants |
|---|---|
Let us now consider the influence of the symmetry-breaking strains , , and on the AF order. It is obvious that none of them can be caused by and . On the other hand, and give rise to and , respectively. Therefore, if the AF order is induced by the symmetry-breaking strains, it should occur only by and , and it is not necessary for their effects to be the same. This is inconsistent with our experimental results: is induced by both and (in-plane), and and have the same effects within the experimental accuracy. We thus conclude that the symmetry-breaking strains are irrelevant to the evolution of the AF phase, at least, in the weak pressure range.
We next consider the variations of the symmetry-invariant strains, and , which can be expressed by the relative variations of the unit cell volume, , and the ratio, , as follows:
| (21) | |||||
| (22) |
where and denote the values at ambient pressure. Using the known values of URu2Si2 (Table 3),rf:Wolf94 we calculated the rates of change in the volume, , and the ratio, , in Table 4. The calculations show that is increased by and [110] at the same rate, . Interestingly, is also expected to increase under hydrostatic pressure, because of the Poisson’s effect. From the calculations we obtained the relation between the increasing rates: . These features seem to be consistent with the experimental results that are equally enhanced by and [110], and the relation holds. The observed and curves are well scaled by (Fig. 5), indicating that the ratio is relevant to the competition between the two types of order. On the other hand, the volume contraction is irrelevant, because should exert a stronger influence than , which is inconsistent with the observation. In this context, however, is expected to be suppressed by applying , whereas actually it is almost independent of the stress (Fig. 2). This can be understood, if the AF phase observed at ambient pressure is caused by irremovable local distortions which are “pinned” near impurities and defects.
| Strain | ||||
|---|---|---|---|---|
| 0 | 0 | 0 | ||
| 0 | 0 | 0 | ||
| 0 | 0 | 0 | 0 |
| 25.5 | 31.3 | 13.3 | 18.8 | 4.8 | (8.6) |
| ( erg/cm3) | |||||
| 1.2 | 3.0 | 3.0 | ||
| ( GPa-1) | ||||
The magneto-elastic energy for the type-I AF order in the tetragonal crystal is given by
| (23) |
where denotes the staggered magnetization and magneto-elastic coupling constants. rf:Yuasa94 The above consideration implies that is larger than in URu2Si2. This is supported by recent thermal-expansion measurements performed under , which revealed that the ratio significantly increases as the AF phase develops with decreasing temperature.rf:Motoyama2002 ; rf:Motoyama2003
The significance of the ratio is also recognized from the behavior of the alloy system U(Ru1-xRhx)2Si2. In this system, the ratio is known to increase as increases. rf:Burlet92 For , reaches : the value at which the AF phase is fully induced in the pure compound (see Fig. 5). Correspondingly, the AF phase is found to develop at . rf:Yoko2004 To test the relevance of the “chemical stress” to the phenomena, we applied uniaxial stress ( ) to the alloy U(Ru0.99Rh0.01)2Si2. We observed that steeply increases with , from 0.026(3) to 0.20(2) , and the saturation of is more abrupt than that for the pure system (Fig. 6). These facts indicate that the axial strain, which is generated by Rh doping, also governs the two phase competition in this alloy system: the Rh 1% system is chemically compressed near to the AF instability point, already at ambient pressure. The hysteretic behavior is also detected in the curve, supporting the argument that the transition is of first-order.
In our previous measurements using hydrostatic pressure, we observed a sudden increase in from 0.22 to 0.40 at . If this anomaly is also caused by the increase in , then similar behavior should be observed at ( ) , where is expected to reach the value () estimated at . The maximum applied in the present study is 0.61 GPa ( ), and in this range we observed no indication of the -transition (see Fig. 2 and Fig. 5: upper right data points). Further investigation with higher stress will be needed to resolve the origin of this anomaly.
IV.2 The application of the Landau theory
The stress-induced first-order phase transition observed in URu2Si2 is qualitatively understood in terms of the Landau’s free energy theory with a time-reversal-invariant order parameter as follows. We assume the free energy of the form, rf:Shah2000 ; rf:Chandra2001 ; rf:Liu73 ; rf:Motoyama2003
| (25) | |||||
| (26) |
where and denote the hidden order parameter and the staggered magnetization, and the signs of and are positive. It is straightforwardly seen that a first order phase transition between and may occur at the boundary on the condition . Suppose that only the symmetry invariant strains are relevant. Then the total free energy, , including the elastic energy and the magneto-elastic energy becomes,
| (27) | |||||
| (28) |
Here, we neglected the coupling between and the strains for simplicity, but it should be remembered that seems to be also weakly coupled to . This is expected because increases below , rf:deVisser86 and because increases with rf:Louis86 ; rf:McElfresh87 ; rf:Fisher90 ; rf:Ido93 ; rf:Oomi94 and ( ). rf:Bakker92 must be larger than at ambient pressure, since hidden order forms the majority phase. If and in this situation, then the AF transition temperature () increases with increasing , so that the first order phase transition occurs at the critical point as shown in Fig. 7(a). By comparing the expected phase diagram with the present experimental results, is roughly estimated to be in URu2Si2. Since is an extensive variable, in principle the phase diagram should have an area near where shows a discontinuous change. Such an area is, however, expected to be very narrow, rf:Motoyama2002 ; rf:Motoyama2003 and not described in Fig. 7.
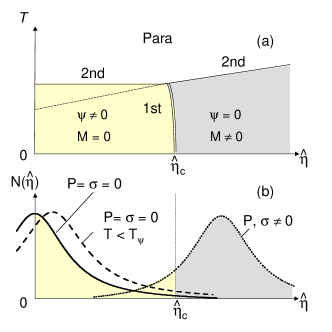
The above consideration is intended for a homogeneous system, and does not account for the inhomogeneous development of the AF phase. The crucial feature would be the smallness of . Here we suggest the presence of random distribution of in URu2Si2, due to some imperfection of the crystal, as schematically shown in Fig. 7(b). The width of the distribution is expected to be of the order of , which will be hard to detect and analyze using the usual microscopic probes. At ambient pressure, the mean value of (taken as 0 in Fig. 7(b)) should be smaller than , so that most part of the sample shows hidden order below . We should remember here that the linear thermal-expansion coefficients show an increase of of the order of 10-4 below . rf:deVisser86 is thus expected to exceed in small fragmentary regions of the sample, where the AF order takes place, being detected as tiny moment on volume-average. By applying or , the mean value of exceeds , and the AF volume fraction inhomogeneously develops to the whole part of the sample, as is observed in the 29Si-NMR measurements under . rf:Matsuda2001 ; rf:Matsuda2003 The temperature and stress dependence of the AF volume fraction should strongly depend on the condition of sample preparation, because such has a strong influence on the compressibility, the thermal expansion, and the distribution function of . This is consistent with the observed annealing effects, where the magnitude, the onset temperature and the variation of the AF Bragg-peak intensity all show significant sample-quality dependence. rf:Fak96 In particular, in this context the onset temperature of , which we define as in this paper, could become higher than , if the distribution of extends over above . This is actually observed in the present system, rf:Broholm87 ; rf:Fak96 ; rf:Ami99 ; rf:Isaacs90 ; rf:Honma99 where the width of onset strongly depends on the specific experiment and sample. We emphasize that the AF response of such variety of starting conditions at ambient pressure is dominated by undetectably small change in the ratio.
Through the above considerations, we have stressed that the weak magnetism at ambient (and very low) pressure could reasonably be understood as the mixing of the high-pressure AF phase. This allows ones to adopt a time-reversal-invariant hidden-order parameter such as quadrupole moment. However, the presence of the AF fraction at very low pressure has not yet been confirmed by experiments. The present experiments do not exclude the possibility that the low-pressure magnetism is induced by an order parameter that breaks time reversal invariance but is nearly non-magnetic, such as an octupole moment. rf:Kiss2004
V Conclusion
We have presented elastic neutron scattering experiments under uniaxial stress on single crystal URu2Si2, and discussed the nature of the unusual competition between hidden order and inhomogeneous AF order. A significant increase of the AF Bragg-peak intensity was observed when is applied along the [100] and [110] axes, while it is nearly constant for . The variation of the AF scattering intensity for roughly corresponds with that for , indicating that the AF evolution is isotropic with respect to compression in the tetragonal basal plane. The isothermal curve of the AF Bragg-peak intensity, which was obtained for U(Ru0.99Rh0.01)2Si2 as well as URu2Si2 under the zero-stress-cooled condition, shows a clear hysteresis loop, indicating that the phase transition from hidden order to the AF order is of a first-order. It was also found that the application of uniaxial stress enlarges the AF phase more effectively than that of hydrostatic pressure. We considered the crystal distortions induced under and , and pointed out that the observed features can reasonably be explained by the increase of the ratio with the compression. This interpretation is consistent with the results of the recent thermal-expansion measurements performed under hydrostatic pressure. rf:Motoyama2003 The inhomogeneous development of the AF phase can also be ascribed to the presence of random axial strains with a very small distribution width of 10-4.
Acknowledgements.
We are grateful to F.J. Ohkawa, T. Sakakibara, K. Nemoto and K. Kumagai for helpful discussions. This work was supported by a Grant-In-Aid for Scientific Research from Ministry of Education, Culture, Sport, Science and Technology of Japan. One of us (M.Y.) was supported by the Research Fellowship of the Japan Society for the Promotion of Science for Young Scientists.References
- (1) T.T.M. Palstra, A.A. Menovsky, J. van den Berg, A.J. Dirkmaat, P.H. Kes, G.J. Nieuwenhuys and J.A. Mydosh, Phys. Rev. Lett. 55, 2727 (1985).
- (2) W. Schlabitz, J. Baumann, B. Pollit, U. Rauchschwalbe, H.M. Mayer, U. Ahlheim and C.D. Bredl, Z. Phys. B 62, 171 (1986).
- (3) M.B. Maple, J.W. Chen, Y. Dalichaouch, T. Kohara, C. Rossel, M.S. Torikachvili, M.W. McElfresh and J.D. Thompson, Phys. Rev. Lett. 56, 185 (1986).
- (4) C. Broholm, J.K. Kjems, W.J.L. Buyers, P. Matthews, T.T.M. Palstra, A.A. Menovsky and J.A. Mydosh, Phys. Rev. Lett. 58, 1467 (1987).
- (5) T.E. Mason, B.D. Gaulin, J.D. Garrett, Z. Tun, W.J.L. Buyers and E.D. Isaacs, Phys. Rev. Lett. 65, 3189 (1990).
- (6) B. Fåk, C. Vettier, J. Flouquet, F. Bourdarot, S. Raymond, A. Vernière, P. Lejay, Ph. Boutrouille, N.R. Bernhoeft, S.T. Bramwell, R.A. Fisher and N.E. Phillips, J. Magn. Magn. Mater. 154, 339 (1996).
- (7) H. Amitsuka, M. Sato, N. Metoki, M. Yokoyama, K. Kuwahara, T. Sakakibara, H. Morimoto, S. Kawarazaki, Y. Miyako and J.A. Mydosh, Phys. Rev. Lett. 83, 5114 (1999).
- (8) H. Amitsuka, M. Yokoyama, K. Tenya, T. Sakakibara, K. Kuwahara, M. Sato, N. Metoki, T. Honma, Y. Ōnuki, S. Kawarazaki, Y. Miyako, S. Ramakrishnan and J.A. Mydosh, J. Phys. Soc. Jpn. 69, Suppl. A 5 (2000).
- (9) K. Matsuda, Y. Kohori, T. Kohara, K. Kuwahara and H. Amitsuka, Phys. Rev. Lett. 87, 087203 (2001).
- (10) K. Matsuda, Y. Kohori, T. Kohara, H. Amitsuka, K. Kuwahara and T. Matsumoto, J. Phys. Condens. Matter. 15, 2363 (2003).
- (11) V. Barzykin and L.P. Gor’kov, Phys. Rev. Lett. 74, 4301 (1995).
- (12) T. Kasuya, J. Phys. Soc. Jpn. 66, 3348 (1997).
- (13) H. Ikeda and Y. Ohashi, Phys. Rev. Lett. 81, 3723 (1998).
- (14) A. Virosztek and K. Maki and B. Dora, Int. J. Mod. Phys. B 16, 1667 (2002).
- (15) H. Amitsuka and T. Sakakibara, J. Phys. Soc. Jpn. 63, 736 (1994).
- (16) P. Santini and G. Amoretti, Phys. Rev. Lett. 73, 1027 (1994).
- (17) Y. Takahashi, J. Phys. Soc. Jpn. 70, 2226 (2001).
- (18) F.J. Ohkawa and H. Shimizu, J. Phys. Condens. Matter 11, L519 (1999).
- (19) A. Tsuruta, A. Kobayashi, T. Matsuura and Y. Kuroda, J. Phys. Soc. Jpn. 69, 663 (2000).
- (20) P. Chandra, P. Coleman and J.A. Mydosh, Physica B 312-313, 397 (2002).
- (21) P. Chandra, P. Coleman, J.A. Mydosh and V. Tripathi, Nature (London) 417, 831 (2002).
- (22) M. Yokoyama, H. Amitsuka, K. Watanabe, S. Kawarazaki, H. Yoshizawa and J.A. Mydosh, J. Phys. Soc. Jpn. 71, Suppl. 264 (2002).
- (23) M. Yokoyama, J. Nozaki, H. Amitsuka, K. Watanabe, S. Kawarazaki, H. Yoshizawa and J.A. Mydosh, Acta Phys. Pol. B 34, 1067 (2003).
- (24) S. Kawarazaki, Y. Uwatoko, M. Yokoyama, Y. Okita, Y. Tabata, T. Taniguchi and H. Amitsuka, Jpn. J. Appl. Phys. 41, 6252 (2002).
- (25) B.C. Frazer, G. Shirane, D.E. Cox and C.E. Olsen, Phys. Rev. 140, A1448 (1965).
- (26) K. Bakker, A. de Visser, E. Brück, A.A. Menovsky and J.J.M. Franse, J. Magn. Magn. Mater. 108, 63 (1992).
- (27) P. Morin, J. Rouchy and D. Schmitt, Phys. Rev. B 37, 5401 (1988).
- (28) B. Wolf, W. Sixl, R. Graf, D. Finsterbusch, G. Bruls, B. Lüthi, E.A. Knetsch, A.A. Menovsky and J.A. Mydosh, J. Low Temp. Phys. 94, 307 (1994).
- (29) S. Yuasa, H. Miyajima and Y. Otani, J. Phys. Soc. Jpn. 63, 3129 (1994).
- (30) G. Motoyama, Y. Ushida, T. Nishioka and N.K. Sato, Physica B 329-333, 528 (2003).
- (31) G. Motoyama, T. Nishioka and N.K. Sato, Phys. Rev. Lett. 90, 166402 (2003).
- (32) P. Burlet, F. Bourdarot, S. Quezel, J. Rossat-Mignod, P. Lejay, B. Chevalier and H. Hickey, J. Magn. Magn. Mater. 108, 202 (1992).
- (33) M. Yokoyama, H. Amitsuka, S. Itoh, I. Kawasaki, K. Tenya and H. Yoshizawa, J. Phys. Soc. Jpn. 73, 525 (2004).
- (34) N. Shah, P. Chandra, P. Coleman and J.A. Mydosh, Phys. Rev. B 61, 564 (2000).
- (35) K.-S. Liu and M.E. Fisher, J. Low Temp. Phys. 10, 655 (1973).
- (36) A. de Visser, F.E. Kayzel, A.A. Menovsky, J.J.M. Franse, J. van den Berg and G.J. Nieuwenhuys, Phys. Rev. B 34, 8168 (1986).
- (37) E. Louis, A. de Visser, A. Menovsky and J.J.M. Franse, Physica 144B, 48 (1986).
- (38) M.W. McElfresh, J.D. Thompson, J.O. Willis, M.B. Maple, T. Kohara and M.S. Torikachvili, Phys. Rev. B 35, 43 (1987).
- (39) R.A. Fisher, S. Kim, Y. Wu, N.E. Phillips, M.W. McElfresh, M.S. Torikachvili and M.B. Maple, Physica B 163, 419 (1990).
- (40) M. Ido, Y. Segawa, H. Amitsuka and Y. Miyako, J. Phys. Soc. Jpn. 62, 2962 (1993).
- (41) G. Oomi, T. Kagayama, Y. Ōnuki and T. Komatsubara, Physica B 199&200, 148 (1994).
- (42) E.D. Isaacs, D.B. McWhan, R.N. Kleiman, D.J. Bishop, G.E. Ice, P. Zschack, B.D. Gaulin, T.E. Mason, J.D. Garrett and W.J.L. Buyers, Phys. Rev. Lett. 65, 3185 (1990).
- (43) T. Honma, Y. Haga, E. Yamamoto, N. Metoki, Y. Koike, H. Ohkuni, N. Suzuki and Y. Ōnuki, J. Phys. Soc. Jpn. 68, 338 (1999).
- (44) A. Kiss and P. Fazekas, Phys. Rev. B 71, 054415 (2005).