A layering model for superconductivity in the Borocarbides
Abstract
We propose a superlattice model to describe superconductivity in layered materials, such as the borocarbide families with the chemical formulæ B2C and BC, with being (essentially) a rare earth, and a transition metal. We assume a single band in which electrons feel a local attractive interaction (negative Hubbard-) on sites representing the B layers, while on sites representing the C layers; the multi-band structure is taken into account minimally through a band offset . The one-dimensional model is studied numerically through the calculation of the charge gap, the Drude weight, and of the pairing correlation function. A comparison with the available information on the nature of the electronic ground state (metallic or superconducting) indicates that the model provides a systematic parametrization of the whole borocarbide family.
pacs:
74.20.-z, 74.78.-w 71.27.+a,The study of Nickel borocarbides (BCs), with the general formula Ni2B2C, has given rise to a wealth of interesting information Naga ; Cava ; Sieg ; Muller01 . Superconductivity has been found for Sc, Y, Ce, Dy, Ho, Er, Tm, Lu, and Th, but not for La, Pr, Nd, Sm, Yb, U, Gd, and Tb. In addition to the ‘high’ critical temperature for some compounds – K for Sc, Y and Lu –, the other aspect which has drawn attention to these materials is the coexistence, for Dy, Ho, Er, and Tm, of superconductivity and magnetic ordering of the localized moments. Structurally, the BCs are characterized by a stacking of alternating C sheets and Ni2B2 layersSieg , with both its band structure Mattheiss94prb ; Pickett94 and the near isotropic resistivity Muller01 being consistent with three-dimensional behaviour.
From the microscopic point of view, superconductivity in these materials is mediated by phonons, as evidenced by specific heat sp-heat and isotope effect iso measurements. It would then appear natural to relate the suppression of superconductivity, as and the transition metal () are varied, in terms of the BCS parameters, , , and (respectively, the Debye temperature, the density of states at the Fermi level, and some measure of the electron-phonon coupling strength): . Since resistivity measurements indicate that does not vary much with in Ni2B2C lambda , one is left primarily with and . While generally increases as goes from Lu to La, measurements of the Sommerfeld coefficient, , lead to in the Ni series. However, as the transition metal is varied, this simple parametrization no longer accounts for the trend of experimental data in an unambiguous way. Indeed, LaPt2B2C is a superconductor [and, for this Pt series, so are the compounds with Pr, Y Muller01 , and, possibly Dhar02 , Nd], even though it has a smaller than non-superconducting LaNi2B2C: and 8 mJ/mol K2, respectively Pt . Another important piece of information is provided by studies of a closely related phase, NiBC Sieg ; Mohammed98 ; RNiBC . The structural difference between Ni2B2C and NiBC is the number of C layers between the Ni2B2 stacks: one in the former and two in the latter. Since these ‘double-layered’ materials have so far failed to display superconductivity in both magnetic and non-magnetic systems alike, the layering structure seems to play a crucial role in the BCs.
Considerable insight should therefore be gained by describing the B2C phenomenology in terms of zero-temperature transitions between superconducting and normal ground states as and are varied. With this in mind, here we propose a model based on the expectation that superconductivity can only survive the huge 4 local moment () in, say, DyNi2B2C if pairing of conduction electrons occurs solely in the NiB layers. Accordingly, we adopt a simplified description of single-band electrons feeling an attractive interaction only when occupying the same site on a B2 layer; electrons on sites of the C layers do not interact with each other. Our purpose here is to single out effects such as chemical composition and layering in the suppression of superconductivity; therefore, at this stage we will not take into account effects arising from the electrons of , such as possible localized magnetic moments and hybridization. The tetragonal structure suggests a further simplification, namely, to consider a one-dimensional superlattice, an approach which has been successfully used in interpreting some magnetic properties of the BCs; in doing this, we still capture the essential features of the interplay between layering along the -axis, and attractive electron-electron interactions note1 . And, finally, we incorporate minimally the presence of actually different bands by including a band offset between the layers; that is, we allow for the occurrence of some charge transfer between the layers. As we will see, the model provides an effective parametrization, through which one is able to systematize the data and predict which materials are likely to be superconducting.
The above picture is realized by a one-dimensional superlattice generalization of the attractive Hubbard model attractive ; note3 ,
| (1) |
where the notation is standard, apart from considering position-dependent site and correlation energy profiles: and for all sites of the attractive (i.e., Ni2B2) ‘layer’, and for all sites on the free (C) layer; the basis with sites is repeated throughout the lattice. In view of the borocarbide structures, we will set , and let or 2 throughout this paper; also, from now on, all energies will be measured in units of the hopping .
Superconductivity within this model then arises due to the balance between formation of pairs and their coherent hopping controlled by ; e.g., as , the system aproaches an insulating state, since hopping will be hindered by the high energetic cost of occupying the attractive sites. Also, in the present context we anticipate that the strength of the attraction, , tracks the Debye temperature, , in the sense that for a given transition metal it increases as the ionic radius of increases Muller01 .
| Nature of the state | [Eq. (2)] | [Eq. (3)] |
|---|---|---|
| Superconducting | ||
| Metallic | 0 | |
| Insulating | 0 |
The ground state of the Hamiltonian (1) has been obtained through Lanczos diagonalization Lanczos on lattices with sites and electrons (thus the density ); we take closed chains with a phase change (or magnetic flux through the ring), , imposed on the hopping term between sites and 1, in order to select closed-shell configurations tclp00 , as well as to calculate the Drude weight (see below). Depending on the SL configuration (1 or 2), and filling factor, we were able to reach lattices as large as ; note, however, that not all configurations fit into all sizes and occupations considered.
For a given SL configuration, the nature of the ground state is determined through the calculation of the following quantities:
1) The charge gap, which probes single-particle excitations, defined as
| (2) |
where is the ground state energy for a chain with sites and electrons.
2) The Drude weight, which measures the strength of the DC conductivity peak, defined as
| (3) |
where, for a given SL configuration, is the ground state energy for a system with electrons and sites; is the phase value which minimizes .
For both and we obtain a series of values for different system sizes and extrapolate towards . A vanishing limit of is associated with a metallic state, whereas a non-zero value is associated with either an insulating state or with a superconducting state; indeed, in the case of the homogeneous (i.e., non-layered) attractive Hubbard model, it has been exactly shown that the single-particle excitation spectrum has a gap for arbitrary densities KO74 . A vanishing limit of is associated with an insulating state, whereas a non-zero value is associated with a conducting state, i.e., metallic or superconductor. Therefore, the nature of the ground state is determined by the limiting behaviour of both and , as summarized in Table 1.
3) The s-wave singlet (SS) pairing correlation function, defined as
| (4) |
which is used as a consistency check for a superconducting ground state. Typically, should display a much slower spatial decay in the superconducting state than in the normal state.
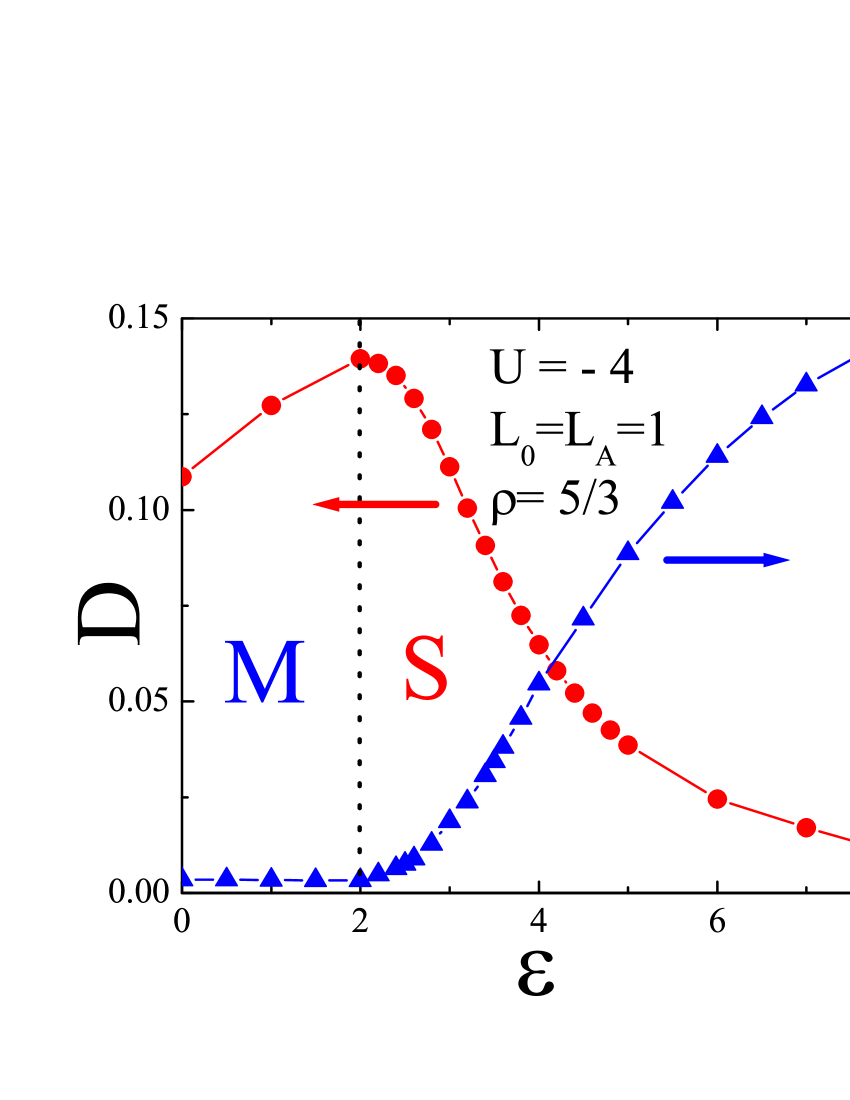
Our results are presented by first fixing a value of (in the intermediate coupling regime), and comparing the data for different values of and of the electronic density; we then let vary. In Fig. 1 we show the extrapolated Drude weight and charge gap for a SL with , and electronic density . According to Table 1, a phase transition between a metal (M) and a superconductor (S) takes place at . As expected, Fig. 1 shows that as is further increased, the system approaches an insulating state. Since the insulating (I) state is not relevant to the borocarbides (they are metallic in their normal state), we will not discuss the S-I transition any further.
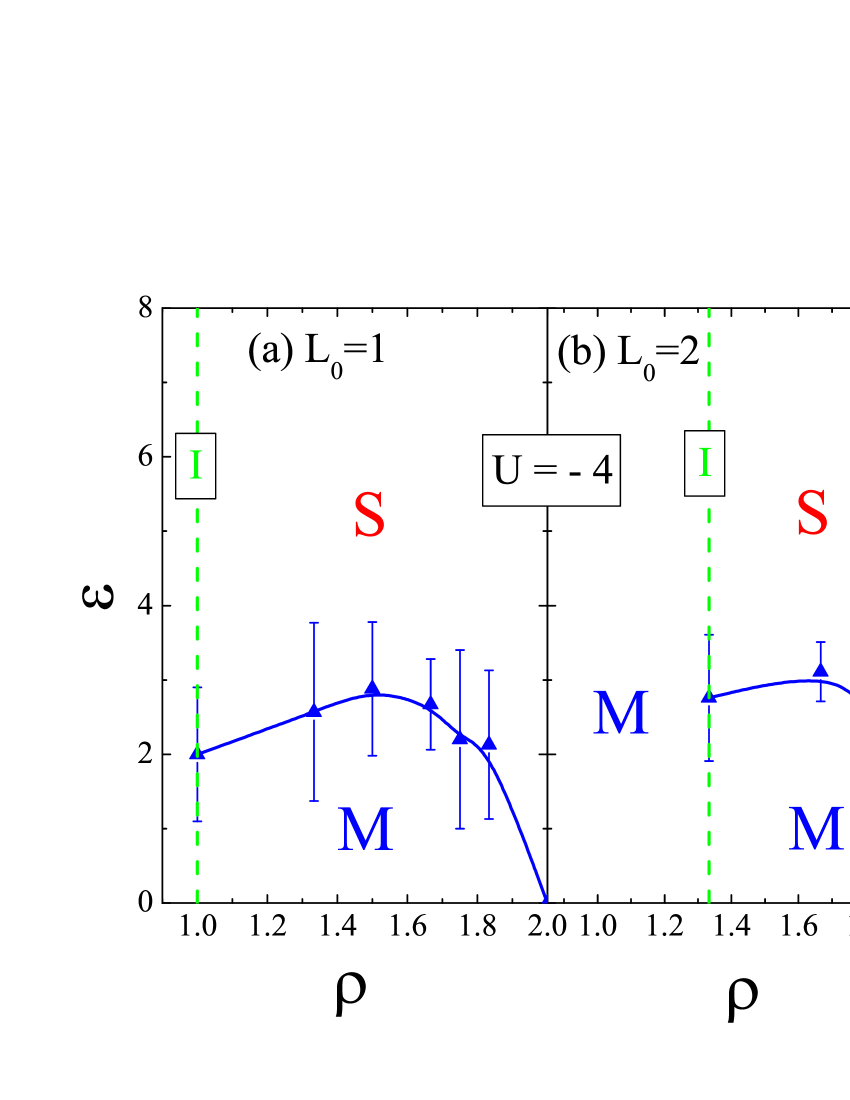
Still for , we calculated the Drude weight and the charge gap for other band fillings, both for (=1, 3/2, 4/3, 7/4 and 11/6), and for (4/3, 5/3, and 11/6); the analysis yields the critical boundaries depicted in Fig. 2. Several aspects of the phase diagrams are worth stressing. First, a non-zero site energy is needed to stabilize the superconducting state. Indeed, given the local (i.e., on-site) character of the attraction, the presence of one or two free sites in between attractive ones would normally (i.e., for ) suppress coherence between pairs. A repulsive site energy on the attractive sites then has the effect of spreading the pair wave function out to neighboring sites, increasing their overlap: pair coherence is thus recovered. Secondly, a superconducting ground state is only stable above a critical density, , the value of which can be obtained from a strong coupling (i.e., ) analysis: as one fills up an empty lattice, electrons are first accommodated on the free sites, so their interaction is only effective when the attractive sites start being occupied, i.e., for densities above . Thirdly, at the Drude weight (charge gap) seems to vanish (to be finite) for all , except at , where it is non-zero (zero); at the system is particle-hole symmetric and charge is evenly distributed throughout the lattice long .
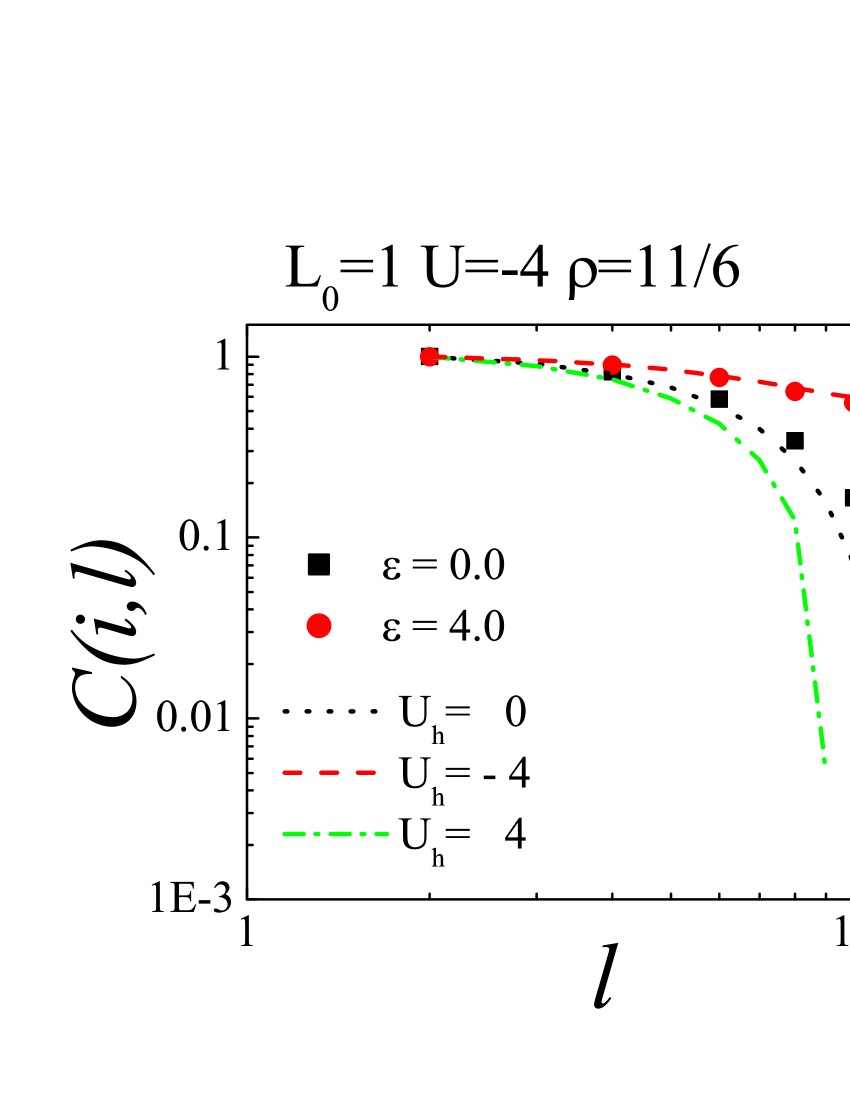
We now illustrate the analysis of the pairing correlation function. For a clearer comparison of the different rates of decay, in Fig. 3 we eliminate oscillations due to the SL structure by plotting the correlations at every other site; also, we normalize the functions such that the correlation between an attractive site and its first attractive neighbour is set to one; i.e., , with chosen to be an attractive site. Let us first consider a homogeneous lattice with and . When the system is known to be superconducting, and, accordingly, the correlation function decays about ten times slower than those for the corresponding non-superconducting cases, free (), and repulsive (). Considering now the case of an superlattice, also with , , and we see that for , the correlations decay exactly as in the corresponding homogeneous system, whereas for the rate of decay follows more closely that of the free system. This confirms the prediction from the analysis of and , which places the former on the superconducting side of the diagram and the latter on the metallic side (see Fig. 2).
The above procedures are repeated to determine the behavior with for fixed densities. The resulting phase diagrams, , for are shown in Fig. 4 for and 3/2. For , the site energy needed to stabilize the superconducting phase increases with , due to the spreading effect mentioned earlier. As , a sharp rise of is expected, since one should have a metallic state for all finite when . For , the M-S boundary is qualitatively similar, but the S-I boundary is more strongly affected by the presence of a second free layer, manifested by a shift to much lower values of .
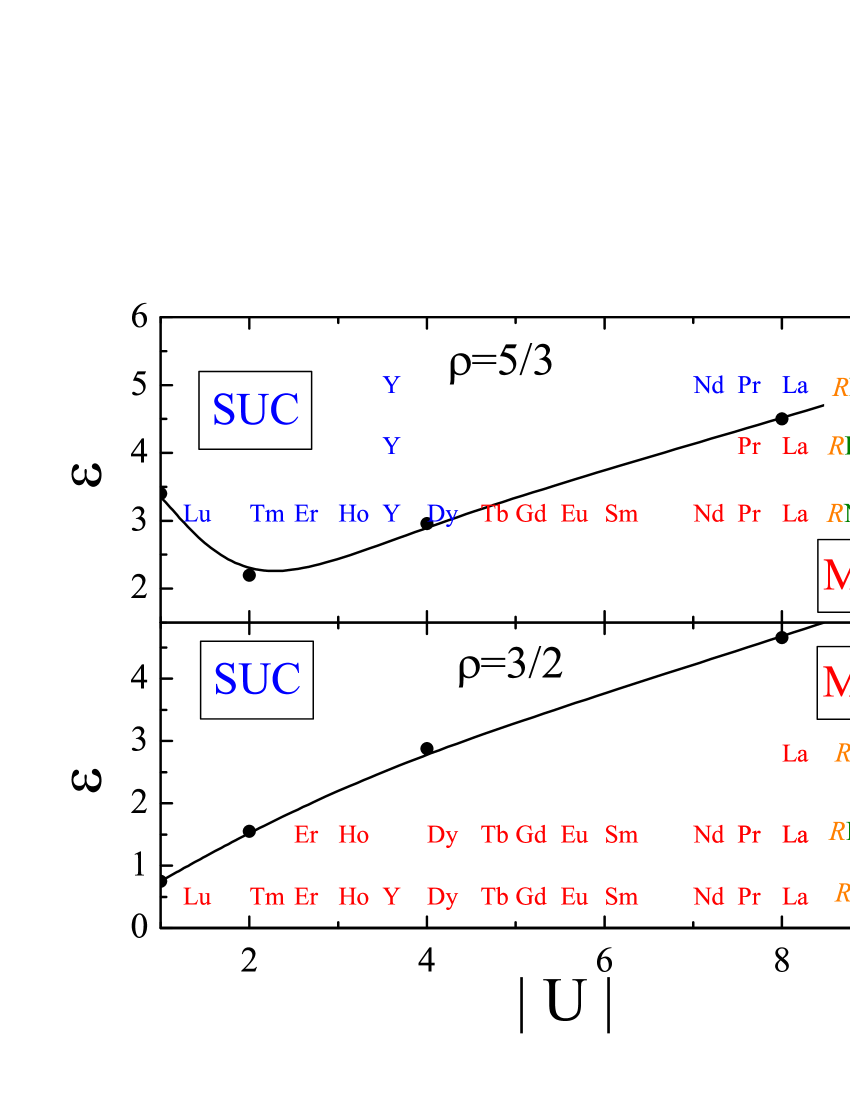
A qualitative connection with experiments on borocarbides B2C can now be established, based on the association of and with measurable parameters such as the Debye temperature and the band offset. Since sets the scale of the BCS zero temperature gap, a reasonable starting point is to order the s according to their Debye temperatures; these, in turn, track their ionic radii. Then, in Fig. 4(a) we first place the whole Ni2B2C series in such way that the S-M boundary lies between Dy and Tb; this pins to positions on the horizontal axis note2 . Interestingly, this parametrization subsumes the roles of , the electron-phonon interaction and of , resolving the puzzling fact that LaNi2B2C is not superconducting, in spite of the relatively large and .
As one changes the transition metal (keeping fixed), by going down a -column in the periodic table, the electronic density in the valence orbitals does not change. Therefore, given our model parameters, one expects the band offset, , to be the one most strongly affected by this change, since it is related to the energy of the atomic levels. Data taken from atomic energy calculations (see, for example, nist, ) indicate that the energy of the higher level increases as one goes from Ni to Pd to Pt, as well as from Co to Rh to Ir. Accordingly, in Fig. 4(a) the horizontal line representing the Pt series should be placed above the one for Ni, and in such a way that La lies within the superconducting phase. This resolves the second puzzle of the borocarbides, the appearance of superconductivity as is changed: as one moves down a column of the VIIIA group, the range of s leading to superconductivity widens. One can therefore predict that if a chemically stable phase of, say SmPt2B2C, is grown, it should be superconducting. The Pd series suffers from a similar scarcity of data due to chemical instabilities: apart from superconducting YPd2B2C, only compounds with La and Pr have been grown so far, which are not superconducting. According to the phase diagram, this was already expected, since the horizontal line representing the Pd series should lie in between those for Ni and Pt.
We now fix and move horizontally on the periodic table. While the full effects of the change from, say, Ni to Co should only be captured within a multi-band treatment of the transition metals, one expects that the most evident feature is a decrease in band filling, possibly accompanied by a renormalization of . Thus, we place the borocarbides with Co, Rh and Ir in the section of the phase diagram corresponding to a smaller , as in Fig. 4(b). Since all members of the Co series have so far failed to display superconductivity, they should be represented by a horizontal line lying entirely in the metallic phase; see Fig. 4(b). Many compounds in the Rh series () have been grown, also without superconducting members; this series is therefore represented by a line just above that for Co. The phase diagram of Fig. 4(b) predicts that superconductivity should be more likely for the Ir series (), but this series is even more severely plagued by chemical instabilities than the Pd and Pt ones, and the only compound grown so far is the non-superconducting LaIr2B2C. For completeness, one should mention that the above reasoning indicates that superconducting YRu2B2C should be placed in a diagram corresponding to . Finally, since the double layered materials seem to be non-superconducting, they should all lie below the line in the corresponding diagram.
In summary, we have proposed a superlattice model to describe superconducting layered materials. The model is parametrized in terms of band offset , on-site attraction , electron density , and number of free layers . The numerical analysis of the one-dimensional case (at zero temperature and without local moments) established that superconductivity is possible only above a critical density and for . The model captures the essencial physics of superconductivity in the borocarbides family, as evidenced by the available experimental information [regarding the nature of the ground state (i.e., metallic or superconducting)] being consistently accommodated in projections of the phase diagram. Consequently, one is able to predict which compounds should become superconductors, once the barriers of chemical instability are broken. The interplay with magnetic ordering is currently being investigated through the addition of a Kondo-like term, which couples the conduction electrons to the local moments.
The authors are grateful to H Westfahl, Jr, for enlightening discussions. Research partially supported by FAPERJ, CNPq, Instituto do Milênio para Nanociências (MCT), and Rede Nacional de Nanociências (CNPq).
References
- (1) R. Nagarajan, C. Mazumdar, Z. Hossain, S.K. Dhar, K.V. Gopalakrishnan, L.C. Gupta, C. Godart, B.D. Padalia, and R. Vijayaraghavan, Phys. Rev. Lett. 72, 274 (1994).
- (2) R. J. Cava, H. Takagi, H. W. Zandbergen, J. J. Krajewski, W. F. Peck Jr, T. Siegrist, B. Batlogg, R. B. van Dover, R. J. Felder, K. Mizuhashi, J. O. Lee, H. Eisaki, S. Uchida, Nature (London) 376, 252 (1994).
- (3) T. Siegrist, H. W. Zandbergen, R. J. Cava, J. J. Krajewski, and W. F. Peck Jr, Nature (London) 376, 254 (1994).
- (4) K.-H. Müller and V N Narozhnyi, Rep. Prog. Phys. 64, 943 (2001).
- (5) L. F. Mattheiss, Phys. Rev. B49, 13279 (1994).
- (6) W.E. Pickett and D.J. Singh, Phys. Rev. Lett. 72, 3702 (1994).
- (7) J. S. Kim, W. W. Kim, and G. R. Stewart, Phys. Rev. B50, 3485 (1994); S. A. Carter et al., , B. Batlogg, R. J. Cava, J. J. Krajewski, W. F. Peck Jr, and H. Takagi Phys. Rev. B50, 4216 (1994).
- (8) D.D. Lawrie and J.P. Franck, Physica C 245, 159 (1995); K. O. Cheon, I. R. Fisher, and P. C. Canfield, Physica C 312, 35 (1999).
- (9) I. R. Fisher, Cooper J R, and Cava R J Phys. Rev. B52, 15086 (1995); K. D. D. Rathnayaka, Bhatnagar A K, Parasiris A, Naugle D G, Canfield P C, and Cho B K Phys. Rev. B55, 8506 (1997).
- (10) S. K. Dhar, Chinchure AD, Alleno E, Godart C, Gupta LC, Nagarajan R, Pramana J. Phys. 58, 885 (2002).
- (11) R.J. Cava, B. Batlogg, T. Siegrist, J.J. Krajewski, W.F. Peck, Jr., S. Carter, R.J. Felder, H. Takagi, and R.B. van Dover, Phys. Rev. B49, 12384 (1994).
- (12) M. El-Massalami, da Costa M S, Novak M A, Barthem V, Journ. Magn. Magn. Mater. 188, 379 (1998).
- (13) S. Skanthakumar and J.W. Lynn, Physica B 261, 576 (1999).
- (14) In one dimension, a superconducting state is actually one with quasi-long range order, characterized by a power-law decay of correlations.
- (15) R. Micnas, Ranninger J, and Robaszkiewicz S, Rev. Mod. Phys. 62, 113 (1990); A. Moreo and D.J. Scalapino, Phys. Rev. Lett. 66, 946 (1991); R.R. dos Santos, Phys. Rev. B50, 635 (1994).
- (16) The attractive Hubbard model is actually more suitable to describe short–coherence-length superconductors (which is not the case of the BCs); nonetheless, this real-space representation of pairing makes it an ideal framework to discuss spatial effects such as layering and disorder, though, admittedly, at the expense of missing out on the comparison with some specific experimental data.
- (17) H.H. Roomany, Wyld H W, and Holloway L E, Phys. Rev. D21, 1557 (1980); E. Gagliano, Dagotto E, Moreo A, and Alcaraz F C, Phys. Rev. B34, 1677 (1986); (E) 35, 5297 (1987); E. Dagotto, Rev. Mod. Phys. 66, 763 (1994).
- (18) T. Paiva and R. R. dos Santos, Phys. Rev. B62, 7007 (2000).
- (19) W.J. Krivnov and A.R. Ovchinnikov, Zh. Eksp. Teor. Fiz. 67, 1568 (1974) [Sov. Phys. JETP 40, 781 (1974)]
- (20) T. Paiva, M. El Massalami, and R.R. dos Santos, (unpublished).
- (21) (a) This is a qualitative ‘fitting’ to data, and no quantitative prediction for or should be inferred. (b) There is certainly some arbitrariness in this choice, since magnetic ordering should also influence the location of the boundary.
- (22) W.C. Martin, A. Musgrove, S. Kotochigova, and J.E. Sansonetti, http://physics.nist.gov/ PhysRefData/IonEnergy/ionEnergy.html