Optical absorption in small BN and C nanotubes
Abstract
We present a theoretical study of the optical absorption spectrum of small boron-nitride and carbon nanotubes using time-dependent density-functional theory and the random phase approximation. Both for C and BN tubes, the absorption of light polarized perpendicular to the tube-axis is strongly suppressed due to local field effects. Since BN-tubes are wide band-gap insulators, they only absorb in the ultra-violet energy regime, independently of chirality and diameter. In comparison with the spectra of the single C and BN-sheets, the tubes display additional fine-structure which stems from the (quasi-) one-dimensionality of the tubes and sensitively depends on the chirality and tube diameter. This fine structure can provide additional information for the assignment of tube indices in high resolution optical absorption spectroscopy.
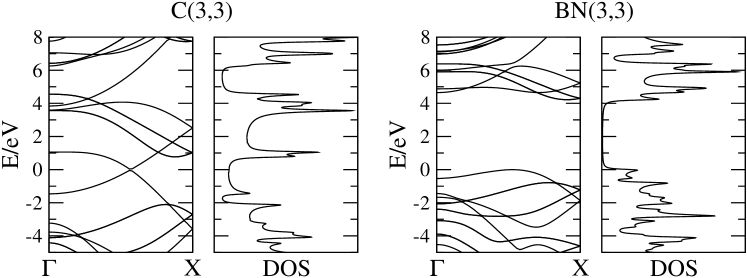
Just as a carbon nanotube can be thought of as a rolled up graphene sheet, a hexagonal single sheet of BN can be used to construct a BN nanotube. These tubes are isoelectronic to carbon tubes, but carry over some of the characteristic differences of hexagonal BN with respect to graphite. In particular, BN-tubes have a bandgap similar to h-BN, mostly independent of the tube diameter and chirality rubi94 ; blas94 . Related to this large band gap (the DFT-band gap is 4 eV (see Fig. 1) while the quasi-particle band gap in the GW approximation amounts to 5.5 eV blas94 ) one expects a high thermal stability and relative chemical inertness for BN-tubes as compared to its carbon counterparts.
After first synthesis of multi-wall BN-tubes was reported in 1995 chop95 , multi and single wall BN-tubes are now routinely produced in several groups, the latest success being the production of single-wall BN-tubes in gram quantities lee01 . The challenge now consists in the spectroscopical characterization of nanotube samples (both C and BN) and, if possible, single isolated nanotubes. The final goal is to find a unique mapping of the measured electronic and vibrational properties onto the tube indices . One possible spectroscopic method is optical absorption spectroscopy where direct excitation from occupied to unoccupied states leads to photon absorption.
The energy difference between corresponding occupied and unoccupied Van Hove singularities (VHSs) in the 1-dimensional electronic density of states (DOS) of C-nanotubes is approximately inversely proportional to the tube diameter . In resonant Raman spectroscopy and scanning tunneling spectroscopy, this scaling is employed for the determination of tube diameters. A recent, spectacular example is the fluorescence spectroscopy of single carbon tubes in aqueous solution, where is probed through the frequency of the excitation laser and is probed simultaneously through the frequency of the emitted fluorescent light bac03 . For the distance between the first VHSs in semiconducting C-tubes, a simple -electron tight-binding fit yields the relation , where is the distance between nearest neighbor carbons. The value for the hopping matrix element varies between 2.4 eV and 2.9 eV, depending on the experimental context in which it is used. This fact is a clear indication that the above relation gives only qualitative and not quantitative information on the tube diameter. Furthermore, for small tubes the band structure completely changes with respect to the band structure of large diameter tubes, including a reordering of the VHSs in the density of states and displaying fine structure beyond the first and second VHSs (Fig. 1). This structure sensitively depends on the tube indices and may be probed by optical absorption spectroscopy over a wider energy range (possibly extending into the UV regime).
The scope of this paper is to use ab initio techniques to go beyond the tight-binding estimate for excitation energies and to uncover some of these additional features present in the optical spectra of small C and BN nanotubes. In order to develop an intuitive understanding of the optical absorption in tubes, we compare with the absorption in single sheets of graphene and h-BN. In this paper we present results for the very small C(3,3) and BN(3,3) tubes while work for larger tubes is in progress. C(3,3) tubes seem not to exist as free single-wall tubes, but they have been grown and shown to be stable inside the cylindrical channels of a zeolite crystal li01 . The band structure and density of states (DOS) of the two tubes are shown in Fig. 1. The following calculations will show which vertical excitations from unoccupied to occupied states yield the dominant contributions to the absorption spectra.
The cross section for optical absorption at frequency is proportional to the imaginary part of the macroscopic dielectric response function of the system noteps : . We evaluate using linear response theory lrdft within the general framework of time-dependent density-functional theory (TDDFT).
First, we determine the ground state equilibrium geometry of the system using the code ABINIT abinit ; params . From the ground state density we compute the one-particle states and energies (labeled by Bloch wave vector and band index ) for all occupied and a large set of unoccupied bands.
The next step is the calculation of the independent particle polarizability notechi . It involves a sum over excitations from occupied bands to unoccupied bands dp :
| (1) |
where means that the indices and of the first term are exchanged. The result is checked for convergence with respect to the number of bands nvalues and the discrete sampling of -points within the first Brillouin zone kvalues . Using the random phase approximation lrdft , the “longitudinal” dielectric function is obtained through , where is the Coulomb potential in reciprocal space. Finally, the macroscopic dielectric response is given by . The limit depends on the direction of , i.e., the polarization of the electric field. The difference between and is due to the inhomogeneity of the response of the system and is called “local field effects” (LFE). For convergence of , has to be calculated for a sufficient number of -vectors. The matrix is then inverted and is obtained from the head of the inverse matrix as .
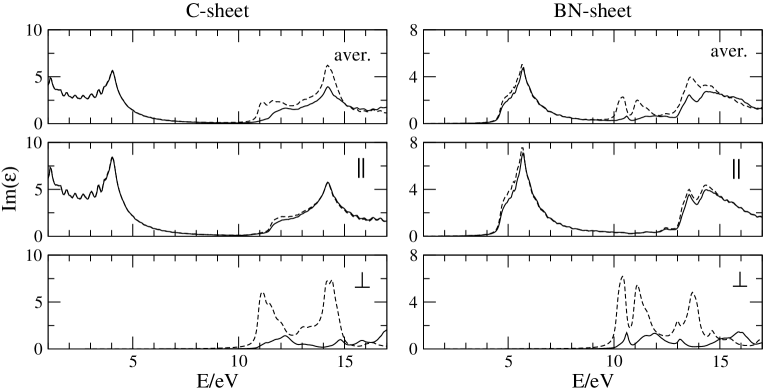
The optical absorption spectra of a single graphene sheet and a sheet of h-BN are displayed in Fig. 2 (extended far into the region of UV light). The spectra are strongly dependent on the polarization of the laser beam. The main difference between C and BN can be seen for the polarization parallel to the plane: While the C-sheet absorbs for all frequencies in the visible light range (the “color” of graphite is black), absorption in BN only sets in above 4 eV, i.e. in the region of UV light (since DFT underestimates the band-gap, we expect a blue-shift of the onset by 1.5 eV). The high frequency part of the spectra are quite similar because C and BN are isoelectronic and the high-lying unoccupied states are less sensitive to the difference in the nuclear charges than the states at and below the Fermi energy. Local field effects turn out to be unimportant for parallel polarization. The absorption spectra in perpendicular polarization are remarkably similar for C and BN: up to 9 eV both sheets are completely transparent. Furthermore, in both cases, LFE lead to a strong reduction of absorption at energies higher than 9 eV (redistribution of oscillator strength to even higher energies).

Fig. 3 displays the absorption spectra for the (3,3) tubes of C and BN. For comparison, in the panel of the spatially averaged spectra, we have also included the joint density of states (JDOS), divided by the square of the transition energy. If LFE are neglected, most peaks of the JDOS are visible in the averaged absorption spectra while some peaks are suppressed due to small or vanishing oscillator strength in Eq. (1). Proper inclusion of LFE leads to a smoothing of the spectra and to a redistribution of oscillator strength to higher energies for polarization perpendicular to the tube axis. However, some fine structure survives and may be discernible in high-resolution optical absorption experiments. This fine structure is not an artifact of low k-point sampling but is due to the presence of VHSs in the 1-dim. DOS of the tubes (Fig. 1). In the absorption spectrum polarized along the axis of the C(3,3) tube, the pronounced peak at 3 eV corresponds to the first (dipole-allowed) transition between VHSs in Fig. 1. Even though the tube is metallic, absorption at lower energies is suppressed due to the dipole-selection rules. The position of the first absorption peak in C-tubes not only depends on the tube radius but also (for fixed radius) on the index pair and varies up to 2 eV for very small tubesli01 ; liu02 ; mach02 ; tolis03 . In contrast, the onset of absorption in BN-tubes corresponds to the threshold in the BN-sheet and is mostly independent of the tube indices (only the peak structure above the onset varies with the tube indices). Between 7 and 12 eV, both C and BN tubes display a similar pattern of peaks which are absent in the corresponding sheets. As in the case of the sheets, LFE are almost negligible for parallel polarization but lead to a strong depolarization in perpendicular direction: The C(3,3) tube is almost transparent up to 5 eV tolis03 in agreement with the experimental observation li01 .
In conclusion, the calculations for optical absorption of small C and BN-nanotubes display a variety of features beyond the excitation between first and second Van-Hove singularities. In C-tubes the position of the first absorption peak strongly varies with the tube indices while in BN-tubes the first peak is determined by the band gap of BN and is therefore mostly independent of . Some of the fine-structure which distinguishes BN-tubes and C-tubes of different chirality is only visible in the UV region which gives rise to the hope that this energy regime will be probed in the future. Still, features related to electron-hole attraction (excitonic effects) are missing in the calculations. They can play a role in both C and BN tubes, leading to new structure in the band-gap and a redistribution of oscillator strength. They may explain the anomalous ratio bac03 measured recently for C-tubes contribs . Work along these lines for BN-tubes is in progress.
References
- (1) A. Rubio, J. L. Corkill, and M. L. Cohen, Phys. Rev. B 49, 5081 (1994).
- (2) X. Blase et al., Europhys. Lett 28, 335 (1994); Phys. Rev. B 51, 6868 (1995).
- (3) N. G. Chopra et al., Science 269, 966 (1995).
- (4) R. S. Lee et al., Phys. Rev. B 64, 121405(R) (2001).
- (5) S. M. Bachilo et al., Sciene 298, 261 (2003).
- (6) Z. M. Li et al., Phys. Rev. Lett. 87, 127401 (2001).
- (7) The dielectric function is defined in the context of 3-dim. periodic systems. Isolated tubes have only a 1-dimensional translational symmetry. However, the use of a plane-wave expansion requires effectively the use of a three-dimensional super-cell. Therefore, we perform calculations for a periodic array of nanotubes with an intertube distance of 10 a.u. This keeps the interaction between neighboring tubes low and renders nearly isolated tubes. Analogously, for the 2-dim. “single” sheets of C and BN, we perform calculations for an infinite stacking of sheets with an inter-sheet distance of 12 a.u. The absolute value of scales with the dimension of the employed super-cell, but we are interested only in the relative absorption cross section in arbitrary units.
- (8) For a recent review article with an extensive list of references see, e.g., G. Onida, L. Reining, and A. Rubio, Rev. Mod. Phys. 74, 601 (2002).
- (9) The ABINIT code is a common project of the Université Catholique de Louvain, Corning Incorporated, and other contributors (URL http://www.abinit.org).
- (10) The cutoff energy of the plane-wave basis is 50 Ry. Core-electrons are simulated by Troullier-Martins pseudopotentials. Calculations are performed in the local-density approximation (LDA).
- (11) is expanded in reciprocal lattice vectors and depends besides on on the momentum transfer . It describes the change of the density in response to the change of the total potential (which in turn is composed of the Hartree, the exchange-correlation and the external potentials): .
- (12) We use the linear response code DP (URL http://theory.polytechnique.fr/codes/dp)
- (13) For all systems, we compute bands up to , where is the number of occupied bands.
- (14) For the 2-dim. Brillouin zone of the C-sheet, we use a sampling of -points, for the BN-sheet . For the 1-dim. Brillouin zones of the C-tubes, we use of -points, for the BN-tubes .
- (15) H. J. Liu and C. T. Chan, Phys. Rev. B 66, 115416 (2002).
- (16) M. Machón et al., Phys. Rev. B 66, 155410 (2002).
- (17) A. G. Marinopoulos et al., submitted (2002).
- (18) See also the contributions of S. G. Louie and E. Mele in this volume.
- (19) Work supported by the European research and training networks COMELCAN (HPRN-CT-2000-00128) and NANOPHASE (HPRN-CT-2000-00167), by NABOCO and by MCyT (MAT2001-0946).