Electronic transport and vibrational modes in the smallest molecular bridge: H2 in Pt nanocontacts
Abstract
We present a state-of-the-art first-principles analysis of electronic transport in a Pt nanocontact in the presence of H2 which has been recently reported by Smit et al. in Nature 419, 906 (2002). Our results indicate that at the last stages of the breaking of the Pt nanocontact two basic forms of bridge involving H can appear. Our claim is, in contrast to Smit et al.’s, that the main conductance histogram peak at is not due to molecular H2, but to a complex Pt2H2 where the H2 molecule dissociates. A first-principles vibrational analysis that compares favorably with the experimental one also supports our claim.
pacs:
73.63.Fg, 71.15.MbPrediction ability is, possibly, the most important attribute associated with first-principles numerical implementations of quantum transport theory in molecular and atomic-scale systems. This desirable property relies on the correct handling of two closely-related factors: The atomic structure and the electronic structure of the nanoconstriction or molecular junction. The calculation of the electronic structure in current-carrying situations is a topic of increasing interest and has received due attention in recent yearsLang (1995); Yaliraki et al. (1999); Taylor et al. (2001); Palacios et al. (2001, 2002); Damle et al. (2001); Brandbyge et al. (2002). The computation of the atomic structure, which is well-established on standard geometry relaxation methods, is, however, much more demanding from a first-principles computational point of view and it is not subject to scrutinity on a regular basis in molecular electronics. Besides, there are inherent uncertanties associated with the various experimental procedures that can only be addressed by statistical analysis.
In this paper we show how a combination of state-of-the-art current-carrying first-principles electronic structure calculations and a careful structural analysis can shed light on a recent experimentSmit et al. (2002); Smit of electronic transport in Pt nanocontacts where, apparently, H2 molecules anchor themselves to the metal and modify the standard conductance histogram of Pt. A H2 molecule is the simplest molecule and is ideal to carry out a detailed structural, vibrational, and transport analysis. On the basis of the extensive ab initio calculations we have performed, our main conclusion is the following: Contrary to the authors’ explanation for the conductance histograms where the main peak around (for ) is attributed to a configuration where a H2 molecule bridges the gap between Pt electrodes (see also Ref. Heurich et al., ), we attribute this peak to a situation where the H2 molecule dissociates at the nanocontact and forms a stable complex Pt2H2 where the two H atoms chemisorb between electrode tip atoms [see left inset in Fig. 2]. Our proposed structure presents vibrational modes in accordance with the reported inelastic effectsSmit et al. (2002) and with a more recent vibrational analysisSmit . Finally, we speculate that the bridge with H in molecular form could account for the peak around reported in Ref. Smit et al., 2002, but not commented on there.
For the structural and vibrational analysis of the Pt nanocontact with H we have used the GAUSSIAN98 codeFrisch et al. and for the transport calculations we have employed the Gaussian Embedded Cluster Method (GECM), recently developed by the authorsPalacios et al. (2001, 2002); Louis et al. which, in turn, makes use of GAUSSIAN98. The GECM consists of a first-principles evaluation at the density functional theory (DFT) level of the density matrix and the Fock matrix (or selfconsistent hamiltonian) of the region determining the transport (here the H atoms and the Pt electrode atoms in proximity to them) in a current-carrying situation. As regards the DFT calculations for the core clusters (see insets in Figs. 1 and 3) we used the B3LYP functionalFrisch et al. , the basis sets and core pseudotentials described in Ref. Pacios and Christiansen, 1985; Hurley et al., 1986; Ross et al., 1990 for Pt and the cc-pVTZ basis for HFrisch et al. . Here we are concerned with the linear response conductance which is calculated in the standard mannerAgrait et al. :
| (1) |
In this expression, Tr denotes the trace over all the orbitals in the cluster. The matrix is given by
| (2) |
where the Green function matrix (in orthogonal basis) is
| (3) |
while is the unity matrix. The matrices and are given by and , respectively, where the self-energy represents the contribution of the semiinfinite left and right leads not included in the self-consistent evaluationPalacios et al. (2001, 2002). In order to single out the contribution of individual channels to the current we diagonalize the matrix .
As a starting point we consider the conductance of a clean Pt nanocontact without H2. It would be desirable to simulate the whole breaking(formation) process of the nanocontact on stretching(indentation). This is, unfortunately, computationally not feasible from first principles for Pt. Out of the many possible atomic arrangements, we have chosen to study the conductance for the following nanocontact atomic configurations: 9-4-1-4-9 (single-atom contact) and 9-4-1-1-4-9 (chain contact) for the (001) direction and 6-3-1-3-6 (single-atom contact) and 6-3-1-1-3-6 (chain contact) for the (111) direction (the numbers indicate the number of atoms per plane). We have considered two possible plane orderings for the (111) direction: 6B-3A--3A-6B and 6C-3A--3C-6A (remember that the bulk one is A-B-C-A-B-C ). These nanocontacts correspond to cases with and without mirror symmetry with respect to the middle plane perpendicular to the stretching axis [the (001) nanocontact has also been chosen with mirror symmetry]. Specifically, we have taken bulk atomic distances for the atoms in the outer planes, but we have performed full relaxation in all the other coordinates, including the distance between the two outer planes. The resulting structures are thus representative of the ones responsible for the last(first) conductance plateau on stretching(indentation) cycles.
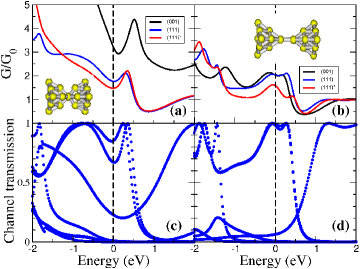
The conductance reaches at the Fermi energy (set to zero) for the two short-chain cases with mirror symmetry and drops slightly for the other one [see Fig. 1(b)]. Two conduction channels mainly contribute to the conductance in the three clusters considered with the two-atom chain [see Fig. 1(d)]. Given the polycrystalline nature of the electrodes, one should not expect mirror symmetry to be the dominant situation in the experiment so we can expect an average conductance around . This value nicely coincides with the position of the lowest conductance histogram peak reported in Ref. Smit et al., 2002. The conductance of the single-atom contacts presents similar values for the (111) direction (although, as Fig. 1(c) shows, three channels now contribute to transport), but is appreciable higher in the (001) direction [see Fig. 1(a)]. Although we cannot afford a statistical analysis, the fact that the position of the lowest conductance histogram peak shifts to higher values when single-atom contacts are favoured (on only considering indentation cycles or higher bias voltages as reported in Ref. Nielsen et al., ) is consistent with our results. The conductance is also here noticeably dependent on the detailed atomic arrangement of the electrodes (note that the conductance increases appreciably on the scale of 1 eV below and above the Fermi energy). This is due to the fact that the Fermi level lies on the edge of the band for bulk and the contact atom has almost bulk coordination. This is also fairly consistent with the fact that Pt histogram peaks are broad in comparison to, e.g., those of AuAgrait et al. .
When the same conductance measurements are performed in a H2 atmosphere the histograms change noticeably. Inelastic vibrational spectroscopy along with theoretical support lead the authors in Ref. Smit et al., 2002 to conclude that a H2 molecule can position itself along the stretching axis of the Pt nanocontact right before it breaks apart. The authors claim that this configuration accounts for the main histogram peak for conductance where . With this claim in mind we consider nanocontacts like that shown in the inset of Fig. 1(b), but with a H2 molecule anchored in between electrode tip atoms. The results presented below are for the smallest cluster in the (001) direction, 4-1-H2-1-4, but we have performed similar calculations for (111) nanocontacts for reassurement. We maintain bulk interatomic distances for the four atoms in the two outer planes whose variable respective distance mimics the effect of the piezo voltage. For every we let the positioning of the H atoms and that of the two contacting Pt atoms relax, starting from a configuration where the H2 molecule sits along the stretching axis. Full blue circles in Fig. 2 represent the total energy vs. for all the stable configurations we have found in which the molecule stays on the -axis (see right inset in Fig. 2). Beyond Å the molecule sticks to one of the electrodes or dissociates. Below Å the molecule tends to loose its alignment with the -axis. (As a guide to the eye we also present with empty circles the energy for configurations where the molecule is forced to stay along the -axis). In all these points the H2 retains its molecular form. At the middle point ( Å) the H-H bond distance and the H-Pt distance turn out to be similar to those proposed in Ref. Smit et al., 2002. Figure 3(a) shows for Å (we chose the distance that more closely reproduced the vibrational mode frequency reported in Ref. Smit et al., 2002, see Table I). The conductance at the Fermi energy turns out to be remarkably smaller than . A similar calculation for the whole range of stable configurations shown in Fig. 2 gave a conductance in the range 0.2-0.5. To our ease this result agrees with the intuitive picture: Closed-shell molecules cannot conduct if the molecular character is maintained after contact with the electrodes and the charge transfer is much smaller than one. Both conditions apply here. The charge transfer from the H2 molecule to the electrodes is typically or smaller and the bonding and antibonding molecular levels maintain their character since they are clearly visible in the density of states (not shown here) around -6 eV and 17 eV, respectively. A value of conductance close to is still possible through hybridization of the Pt states with those of the moleculeHeurich et al. . In our calculations, however, this does not occur at the Fermi energy, but at eV. We believe that this H2 bridge actually accounts for a secondary peak around not discussed, but clearly present in the reported dataSmit et al. (2002).
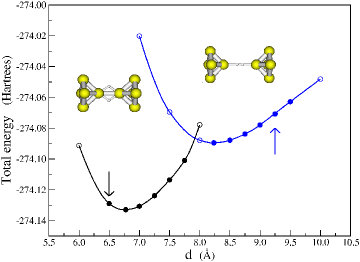
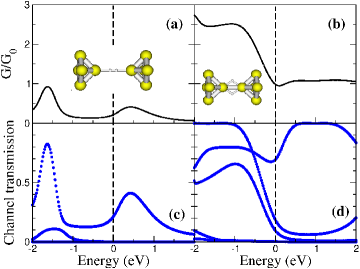
So, what accounts for the main conductance peak at ?. There is little doubt that this peak is H-related, but here we propose an alternative to the H2 molecular bridge discussed above. We now perform calculations similar to the previous ones, but initially placing the molecule axis perpendicular to the stretching -axis. We let the Pt tip atoms and the H atoms relax towards equilibrium for several values of without assuming the H2 to be in molecular form. The total energy of the stable configurations we have found are represented by full black circles in Fig. 2. (Again, for completeness, we also present results when the H atoms are not allowed to leave the plane perpendicular to the -axis). The two H atoms are only in molecular state at the upper limit of this curve ( Å). For smaller values of the H2 molecule breaks apart and the H atoms position themselves up to 2.0 Å apart from each other forming a double atomic H bridge as the one shown in the left inset of Fig. 2. The results of conductance for Å (a distance for which vibrational modes are closer to the experimental ones, see below and Table I) are depicted in Fig. 3(b). The conductance at the Fermi energy approaches closely . The eigenchannel transmission results are also consistent with the noise analysis in Ref. Smit et al., 2002 since, the fact that fluctuations do not strictly vanish at may indicate that more than one channel is contributing to the conductance. At this point the distance between tip Pt atoms is approximately that of bulk Pt and that between tip Pt atoms in Fig. 1(b). When comparing with the results presented in Fig. 1(b) we see that the H seems to block out one of the channels. It is important to finally stress here that the exact value of the conductance is not very dependent on the basis set and the functional. However, the atomic configuration of the electrodes in the cluster and the model used to represent the bulk of these electrodes introduces a source of uncertainty in the results. We believe that this is the source of the discrepancy between our results and those presented in Refs. Smit et al., 2002 and Heurich et al., . After considering various other possibilities in terms of cluster sizes and orientations, we can safely conclude that the stark difference between the conductance of the two basic bridge structures studied in this work is robust.
We have also performed a full analysis of the H-H vibrational modes in a configuration in which the H2 axis is perpendicular to the -axis and for the distance that gives a conductance close to one quantum (Å see Figs. 2 and 3). The results for the mode frequencies are reported in Table I. The first mode shown in the table (H atoms moving in opposite directions along the stretching axis) is the one that has a frequency closer to the experimental data (a frequency of 51621 cm-1 was reported in Smit et al. (2002)). The isotopic effect shows up clearly with frequencies 439 and 386 cm-1 for H-D and D-D, to be compared with those obtained by multiplying the H-H frequency by the mass ratii (445 and 392 cm-1, respectively). It is worth mentioning that, although for D-D the isotopic effects shows up for all modes, this is no longer true for H-D. This mode induces a large variation of the conductance (see Table I), again, an effect that is not the same for all modes. Note also that the mode with the two H atoms moving in the same direction along the stretching axis, which also induces a significant change in the conductance (see second row in Table I), has a frequency close to that of a second mode observed in the experiments (around 1200 cm-1, see Ref. Smit, ). The latter is not reproduced by configurations with a molecular H2 bridge (see Table I).
| mode | H-H | H-D | D-D | |
|---|---|---|---|---|
| 552 (4028) | 439 | 386 | 1.6% | |
| 1315 (552) | 1155 | 934 | 0.82% | |
| 1380 (366) | 1036 | 979 | 0.36% | |
| 1596 (1707) | 1508 | 1131 | 5.16% | |
| + | 250 (366) | 207 | 191 | 0.13% |
| + | ||||
| + | 341 (1707) | 307 | 241 | 0.012% |
| – |
In conclusion we have analyzed the conductance and vibrational modes of a Pt nanocontact in the presence and absence of H. Our results for clean Pt agree with most data reported in the literature. On the contrary, our results on Pt with H question the current interpretation of the experiments reported in Ref. Smit et al., 2002. While H2 seems to block the current, a novel complex Pt2H2 formed at the neck could be responsible for the reported histogram peak near . The vibrational modes of this complex also agree with the experimental ones.
We acknowledge support from the Spanish Ministry of Science and Technology under Grants No. 1FD97-1358 and No. MAT2002-04429-C03 and from the Universidad de Alicante. We thank C. Untiedt for sharing with us his point of view on the experimental results.
References
- Lang (1995) N. D. Lang, Phys. Rev. B 52, 5335 (1995).
- Yaliraki et al. (1999) S. N. Yaliraki, A. E. Roitberg, C. Gonzalez, V. Mujica, and M. A. Ratner, J. Chem. Phys. 111, 6997 (1999).
- Taylor et al. (2001) J. Taylor, H. Guo, and J. Wang, Phys. Rev. B 63, 245407 (2001).
- Palacios et al. (2001) J. J. Palacios, A. J. Pérez-Jiménez, E. Louis, and J. A. Vergés, Phys. Rev. B 64, 115411 (2001).
- Palacios et al. (2002) J. J. Palacios, A. J. Pérez-Jiménez, E. Louis, E. SanFabián, and J. A. Vergés, Phys. Rev. B 66, 035322 (2002).
- Damle et al. (2001) P. S. Damle, A. W. Ghosh, and S. Datta, Phys. Rev. B 64, 201403 (2001).
- Brandbyge et al. (2002) M. Brandbyge, J. L. Mozos, P. Ordejón, J. Taylor, and K. Stokbro, Phys. Rev. B 65, 165401 (2002).
- Smit et al. (2002) R. H. M. Smit, Y. Noat, C. Untiedt, N. D. Lang, M. C. van Hemert, and J. M. van Ruitenbeek, Nature (London) 419, 906 (2002).
- (9) R. H. M. Smit, Ph.D Thesis, University of Leiden, 2003.
- (10) J. Heurich, F. Pauly, J. C. Cuevas, W. Wenzel, and G. Schoen, arXiv:cond-mat/0211635.
- (11) M. J. Frisch, G. W. Trucks, H. B. Schlegel, M. A. R. G. E. Scuseria, J. R. Cheeseman, V. G. Zakrzewski, J. A. Montgomery, Jr., R. E. Stratmann, J. C. Burant, et al., GAUSSIAN98, Revision A.7, Gaussian, Inc., Pittsburgh PA, 1998.
- (12) E. Louis, J. A. Vergés, J. J. Palacios, A. J. Pérez-Jiménez, and E. SanFabián, arXiv:cond-mat/0212115.
- Pacios and Christiansen (1985) L. F. Pacios and P. A. Christiansen, J. Chem. Phys. 82, 2664 (1985).
- Hurley et al. (1986) M. M. Hurley, L. F. Pacios, P. A. Christiansen, R. B. Ross, and W. C. Ermler, J. Chem. Phys 84, 6840 (1986).
- Ross et al. (1990) R. B. Ross, J. M. Powers, T. Atashroo, W. C. Ermler, L. A. LaJohn, and P. A. Christiansen, J. Chem. Phys. 93, 6654 (1990).
- (16) N. Agrait, A. Levi-Yeyati, and J. van Ruitenbeek, arXiv:cond-mat/0208239.
- (17) S. K. Nielsen, Y. Noat, M. Brandbyge, R. H. M. Smit, K. Hansen, L. Y. Chen, A. I. Yanson, F. Besenbacher, and J. M. van Ruitenbeek, arXiv:cond-mat/0212062.