Evolution of the isotropic to nematic phase transition in octyloxycyanobiphenyl+aerosil dispersions
Abstract
High-resolution ac-calorimetry has been carried out on dispersions of aerosils in the liquid crystal octyloxycyanobiphenyl () as a function of aerosil concentration and temperature spanning the crystal to isotropic phases. The liquid-crystal is elastically stiffer than the previously well studied octylcyanobiphenyl ()+aerosil system and so, general quenched random disorder effects and liquid-crystal specific effects can be distinguished. A double heat capacity feature is observed at the isotropic to nematic phase transition with an aerosil independent overlap of the heat capacity wings far from the transition and having a non-monotonic variation of the transition temperature. A crossover between low and high aerosil density behavior is observed for +aerosil. These features are generally consistent with those on the +aerosil system. Differences between these two systems in the magnitude of the transition temperature shifts, heat capacity suppression, and crossover aerosil density between the two regimes of behavior indicate a liquid crystal specific effect. The low aerosil density regime is apparently more orientationally disordered than the high aerosil density regime, which is more translationally disordered. An interpretation of these results based on a temperature dependent disorder strength is discussed. Finally, a detailed thermal hysteresis study has found that crystallization of a well homogenized sample perturbs and increases the disorder for low aerosil density samples but does not influence high density samples.
pacs:
64.70.Md, 61.30.Eb, 65.40.BaI INTRODUCTION
The effect of quenched random disorder on phase structure and transitions is an important area of study that continues to attract a great deal of research. Disorder is ubiquitous (ideal pure transitions being the exception rather than the rule in nature) and the effect on phase transitions can be profound. Phase transitions are modified depending on the aspect of the system affected by the disorder, on the dimensionality, and on the number of components to the order parameter. Of particular interest is a linear coupling between quenched random disorder and the order parameter, which allows for a random-field theoretical approach. Also, the order of the transition is crucial as first-order transitions have additional considerations compared to continuous transitions. This is due to the presence of two-phase coexistence (hence interfaces between ordered and disordered regions), intrinsically finite correlation length at the transition, and hysteresis effects for first-order compared to continuous phase transitions. This has made the experimental and theoretical studies of quenched random disorder effects at first-order transitions challenging.
Liquid-crystals (LC) are a particularly attractive system for the study of phase transitions into partially ordered phases. This makes them especially interesting for the study of the effects of quenched random disorder (QRD), which are typically introduced by the random fixed dispersion of solid surfaces. In LC+aerosil systems, the quenched random disorder is created by a dispersed gel of aerosil particles and is varied by changing the density of aerosils in the dispersion. A convenient measure of the introduced disorder is the grams of silica per cm3 of liquid-crystal, denoted the conjugate silica density , which is directly related to the surface area of solids as well as the mean-distance between solid surfaces Iannacchione et al. (1998, 2003). The aerosils used are silica spheres that can hydrogen bond together to form a fractal-like random gel. Studies have previously been carried out by various groups on liquid crystals in an aerogel medium Bellini et al. (2001). Aerogels are self-supporting structures and this places a lower limit on the disorder strength that can be probed. By contrast, the aerosil gel provides a weaker and more easily controlled perturbation, and thus opens up a physically interesting regime.
In this work, we study the effect of quenched random disorder due to a dispersed thixotropic aerosil gel on the weakly first-order isotropic to nematic (I-N) phase transition. The calorimetric results for the nematic to smectic-A phase transition in +aerosil samples have been previously reported and were shown to be consistent with results in +aerosil samples Clegg et al. (2003). At the I-N transition, the orientational order has a finite correlation length and is established in three dimensions, which is describable by a symmetric and traceless rank tensor de Gennes and Prost (1993) (as such, it possesses only five independent components). Thus, nematic order belongs, in principle, to a , Heisenberg class. However, by ignoring any biaxial character and aligning the orientation axis with a principle axis of a local frame, this tensor can be split into a scalar order parameter () measuring the magnitude of orientational order about the orientation axis and a ”headless” vector called the nematic director () describing the spatial orientation of this axis. In this simplified view, nematic order is described on short length scales by and on longer length scales by , which is useful in describing the elastic properties of the nematic structure. These measures of nematic order are related to the quadrupolar nematic order parameter by .
In principle, the effect of the aerosil gel network on the orientational order of the nematic phase is two fold. The silica gel firstly dilutes the liquid crystal and secondly creates a preferred local orientation Gingras (1995); Feldman (2000). In addition, the first-order transition from the isotropic to the nematic phase necessitates the formation of interfaces between coexisting domains/phases, which must occur within the available void spaces. The latter effect is the classic result of quenched random disorder; a distribution of transition temperatures due to the nucleation of ordered domains within voids having some size distribution. This leads to short-range order (SRO), a rounding of the transition, and suppression of the first-order character of the transition Imry and Wortis (1979). The contribution of a random preferred local orientation effect to the total hamiltonian can be represented as
| (1) |
where is the orientation of the molecules over some small region where the orientation is approximately constant and is the random influence of the silica surface. The variance of this random field should be proportional to the density of solids dispersed in the LC medium. This term is squared due to the effective inversion symmetry of the molecules in the nematic phase. Since the nematic order parameter is quadratic in due to the same inversion symmetry de Gennes and Prost (1993), Eq. (1) is also linear in the order parameter and hence constitutes a random field (RF) interaction. Recently, Eq. (1) has also been interpreted as a random-anisotropy (RA) interaction Feldman (2000) but this seems only applicable to systems describable by a pure vector order parameter. The formation of interfaces and the resulting surface energy penalties places restrictions on the effects of depending on the elasticity of the nematic. Light scattering measurements have shown that the nematic phase in liquid crystal and aerosil dispersions breaks up into large (micron size) but finite-size domains Bellini et al. (1998). In addition, more extensive optical studies focussing on the nature of the nematic director structure well below the I-N transition have shown that the director correlation length decays exponentially with distance, which is a hallmark of short-range order Bellini et al. (2000, 2002). These features are consistent with an RF interaction for nematics with QRD.
To date, the most thoroughly studied LC+aerosil system is the dispersion of type-300 aerosil in octylcyanobiphenyl (), denoted +aerosil. Detailed calorimetric Zhou et al. (1997); Iannacchione et al. (1998); Marinelli et al. (2001), x-ray scattering Park et al. (2002); Leheny et al. (2003), x-ray intensity fluctuation spectroscopy Retsch et al. (2002), static and dynamic light-scattering Bellini et al. (1998, 2000, 2002), and deuterium NMR Jin and Finotello (2001) studies on the nematic to smectic-A (N-SmA) and the isotropic to nematic (I-N) phase transitions of this system have shown that there are clear quenched random-field characteristics as well as finite-size scaling effects Iannacchione et al. (2003).
Calorimetry measurements on +aerosil samples have been particularly useful in yielding detailed information on both the I-N and the N-SmA phase transitions Iannacchione et al. (1998). The results for both transitions show a complex dependence of the transition temperature on the aerosil density. While the N-SmA heat capacity peak remains sharp and evolves towards 3D-XY behavior with increasing silica density, the I-N behavior is more complicated. For silica densities below g cm-3, two heat capacity peaks, closely spaced in temperature, were observed. At higher aerosil densities, the heat capacity peaks for both the I-N and the N-SmA transitions displayed a highly smeared and non-singular features. Deuterium NMR measurements on deuterated +aerosil dispersions, which were carried out over a wide range of silica densities, showed that the magnitude of the orientational order below the I-N transition temperature was essentially unchanged from bulk behavior Jin and Finotello (2001). The amount of liquid crystal reorientation for field-cooled samples upon rotation within the DNMR field is small and decreases continuously with silica density up to g cm-3 (the units will be dropped hereafter) confirming distinct low and high behavior. A x-ray intensity fluctuation spectroscopy (XIFS) study have found evidence of aerosil gel dynamics in +aerosil dispersions indicating an elastic coupling between the gel and LC Retsch et al. (2002). The optical, calorimetric, DNMR, and XIFS results all appear to be consistent with a model in which director fluctuations are suppressed with increasing aerosil density.
The present work focusses on a different liquid crystal – octyloxycyanobiphenyl () – having dispersed in it the same type of aerosil over a comparable range of silica densities as the well-studied +aerosil system. This liquid-crystal has several important differences from the closely related . The liquid-crystal has stronger smectic and nematic interactions than as evidenced by the higher transition temperatures, the larger bare correlation lengths for smectic interactions Litster et al. (1979), and the larger elastic constants. More specifically, has a larger bend, larger twist, and larger splay nematic elastic constants than (in the single elastic constant approximation, has a greater than with an overall uncertainty of ) Bradshaw et al. (1985). Thus, comparison of behaviors between +aerosil and +aerosil systems allow for the isolation of general quenched random-disorder (QRD) effects from material specific effects, in this case the elasticity of the liquid-crystal host medium.
In general, this work reveals a non-monotonic silica density dependence of the I-N and N-SmA transition temperatures similar to that observed for +aerosil but occurring over a larger range for +aerosil. The calorimetric results presented here for the I-N transition reveal the onset of a double transition peak for with a dependence on the temperature distance between the two heat capacity peaks. Evidence is presented that the first-order character of the I-N transition continuously decreases with silica content, becoming approximately zero for . Over the entire range of studied here, the heat capacity temperature dependence away from the immediate vicinity of the transition region is bulk-like and independent of silica content.
We speculate that the variance of the disorder may change through a first-order transition for nematics to account for these observations. Such a variation of the disorder strength may be due to the silica surfaces introducing a low-order, paranematic-like, boundary layer initially screening the remaining liquid crystal material. The thickness of this boundary layer is strongly temperature dependent in the immediate vicinity of the I-N transition and as it shrinks, the screening becomes weaker.
Section II describes the preparation of the +aerosil dispersions as well as the ac-calorimetry technique employed. Given in Section III is a presentation of the results. All results are then discussed in Section IV and related to results from previous LC+aerosil studies. Directions for future study will also be discussed.
II EXPERIMENTAL TECHNIQUES
The liquid crystal , purchased from Aldrich, was used after degassing in the isotropic phase for hour. This liquid-crystal molecule has an aliphatic tail attached by an oxygen link to the rigid biphenyl core and a polar cyano head group ( g mol-1 ). This oxygen link constitutes the sole molecular difference between and . Pure has a weakly first-order isotropic to nematic transition at K and a second-order nematic to smectic-A transition at K. At lower temperatures, the strongly first-order Crystal-SmA transition occurs reproducibly on heating at K and, as usual, can be greatly supercooled.
The hydrophilic type-300 aerosil obtained from Degussa Deg was thoroughly dried at under vacuum for a couple of hours prior to use. The hydrophilic nature of the aerosils arises from the hydroxyl groups covering the surface and allows the aerosil particles to hydrogen bond to each other. This type of bonding is weak and can be broken and reformed, which leads to the thixotropic nature of gels formed by aerosils in an organic solvent. Crystallization severely disrupts the gel. The specific surface area measured by the manufacturer via BET nitrogen isotherms is m2 g-1 and each aerosil sphere is roughly -nm in diameter. However, SAXS studies have shown that the basic aerosil unit consists of a few of these spheres fused together during the manufacturing process Iannacchione et al. (1998). Each +aerosil sample was created by mixing appropriate quantities of liquid crystal and aerosil together, then dissolving the resulting mixture in spectroscopic grade (low water content) acetone. The resulting solution was then dispersed using an ultrasonic bath for about an hour. As the acetone evaporates from the mixture, a fractal-like gel forms through diffusion-limited aggregation. Small angle x-ray studies have shown that the aerosil gel dispersion has a fractal structure and no preferred orientation Iannacchione et al. (1998) on the micron-long length scales of nematic order Bellini et al. (2000).
At room temperature, is a crystalline solid even in the presence of high aerosil density. Care was taken to avoid crystallization of and possible damage to the aerosil gel, especially for low silica densities. For this calorimetry study, the mixture after slow solvent evaporation was allowed to crystallize, and the solid sample was transferred into the calorimetry cell. The cell was then sealed, the heater and thermometer attached, and the cell was heated into the isotropic phase. The sample was then remixed by placing the assembly in an ultrasonic bath for over an hour. The cell and sample temperature was kept elevated during the mounting of the sealed cell into the calorimeter by maintaining current through the heater. This sample preparation protocol also allows a controlled entry into the crystal phase. However, since the cell is sealed, the in situ remix could not be inspected and so some small dispersion inhomogeneity may remain.
High-resolution ac calorimetry was performed using two home-built calorimeters at WPI. The sample cell consisted of a silver crimped-sealed envelope mm long, mm wide, and mm thick (closely matching the dimensions of the heater). After the sample was introduced into a cell having an attached - strain-gauge heater and -M carbon-flake thermistor, a constant current was placed across the heater to maintain the cell temperature well above . The filled cell was then placed in an ultrasonic bath to remix the sample. After remixing, the cell was mounted in the calorimeter, the details of which have been described elsewhere Yao and Garland (1998). In the ac-mode, power is input to the cell as resulting in temperature oscillations with amplitude and a relative phase shift of , where is the absolute phase shift between and the input power. The specific heat at a heating frequency is given by
| (2) |
| (3) |
where and are the real and imaginary components of the heat capacity, is the heat capacity of the cell and silica, is the mass in grams of the liquid crystal (the total mass of the +aerosil sample was mg, which yielded values in the range of mg), and is the thermal resistance between the cell and the bath (here, K W-1). Equations (2) and (3) require a small correction to account for the finite internal thermal resistance compared to , and this was applied to all samples studied here Iannacchione et al. (1997). Measurements were conducted at various frequencies in order to ensure the applicability of Eqs. (2) and (3) by checking that through the effective N-SmA transition at and that was independent of . All data presented here were taken at s-1 at a scanning rate of less than mK h-1, which yield essentially static results. All +aerosil samples experienced the same thermal history after mounting; six hours in the isotropic phase to ensure homogeneous gelation, then a slow cool deep into the smectic phase before beginning the first detailed scan upon heating.
III RESULTS
III.1 General description
The heat capacity of the pure liquid-crystal is in good agreement with previously published results Kasting et al. (1980); Birgeneau et al. (1981). For our pure material the transition temperatures were K and K. The I-N two-phase coexistence width was mK wide, and the N-SmA transition enthalpy was J g-1. These thermal features indicate that the liquid-crystal used in this study was of reasonably good quality. A summary of the calorimetric results for pure and +aerosil samples is given in Table 1.
In order to determine the excess heat capacity associated with the phase transitions, an appropriate background was subtracted. The total sample heat capacity over a wide temperature range had a linear background, (background), subtracted to yield
| (4) |
as the excess due to the I-N and N-SmA phase transitions. The resulting data are shown for pure and all +aerosil samples in Fig. 1 over a wide temperature range about , where the units are J K-1 per gram of liquid crystal. The transition temperature, , is determined as the highest temperature where any nematic phase is present and corresponds to the highest temperature peak in .
As seen in Fig. 1, the values away from the N-SmA transition and the I+N coexistence regions overlap with bulk behavior independent of silica concentration. The detailed variations of associated with the N-SmA transition with has been reported previously Clegg et al. (2003). The deviations of some of the points in the nematic phase is likely a consequence of sample inhomogeneity. The ”wings” of the I-N transition are associated with short-range fluctuations of nematic order. Given the simplification of the nematic order parameter, the short-range fluctuations in bulk nematics are mainly composed of thermal fluctuations of the scalar part S. For the +aerosil system, the temperature dependence of being independent of suggests that thermal fluctuations of S are independent of disorder over the whole range of studied in this work. The wing behavior shown here for +aerosil is completely consistent with similar results for +aerosil Iannacchione et al. (1998) and low-density +aerogel samples Wu et al. (1995).
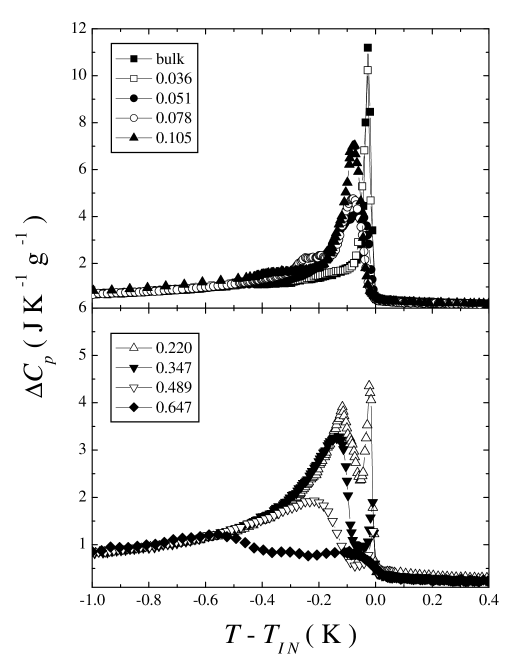
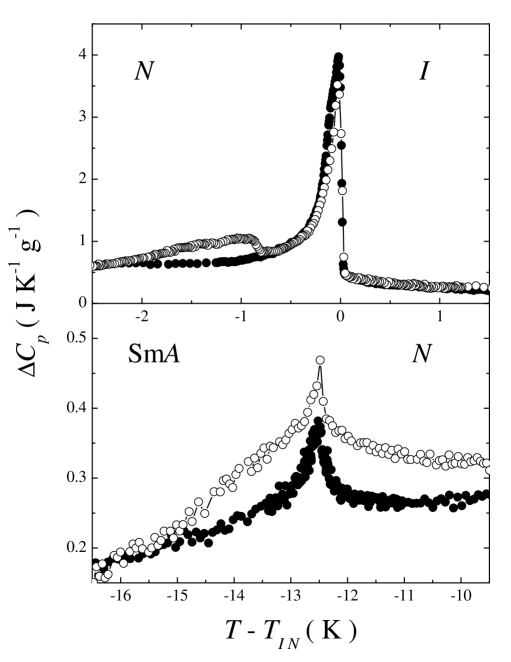
In stark contrast to the behavior of in the one-phase regions, the two-phase coexistence region of the I-N transition exhibits strong effects of silica concentration, as shown in Fig. 2. From 1 K below to 0.4 K above , the peaks for the pure and the sample are essentially the same not (a). Upon increasing silica density, the peak in is substantially lower in temperature relative to the peak in and considerably broader than for the bulk or the sample. See the upper panel in Fig. 2. In addition, there is a small and very broad shoulder below the main specific heat peak, also seen in bulk, which moves toward the main peak with increasing . The nature of this subsidiary feature is not known. It is likely, given the similarity of the materials used here with the +aerosil system, that the percolation threshold for type-300 aerosil in is essentially the same at Iannacchione et al. (1998) and so a true gel should be present for all samples studied in this work. This is supported by a visual inspection of these samples holding their shape above the crystal melting temperature. The I-N transition regions shown in Fig. 2 for appear to be quite sensitive to small inhomogeneities in the silica gel dispersion and so, are grouped together. Given the dominance of a large, broad, specific heat peak and relatively erratic transition temperature shifts, discussed below, the effect of the silica gel on the I-N phase transition is strongly dependent on the quality of the dispersion.
Beginning with the sample and for increasing silica content there is a systematic variation of the excess heat capacity, which is shown by the lower panel in Fig. 2. At , a double heat capacity feature is observed with a sharp high-temperature peak corresponding closely to (but very slightly below) a sharp peak in , followed at lower temperature by a broader peak also having an associated broad peak in . Clearly, both are first-order signatures and they are separated by K. For the and samples, the feature remains sharp but decreases in magnitude while the feature becomes increasingly rounded and moves to lower temperature relative to by and K, respectively. For the sample, both heat capacity features are rounded and separated now by K. Over this entire range of silica density, the size of the peak decreased monotonically with increasing . Such a double I-N heat capacity feature was observed in +aerosil samples for silica concentrations up to , but exhibited a single, rounded feature above this density Iannacchione et al. (1998). Only a single rounded feature was observed for all +aerogel samples Wu et al. (1995).
III.2 The I-N transition enthalpies
The I-N transition enthalpy also exhibits a dependence on aerosil concentration and can be a quantitative measure of the strength of the transition. For a second-order (or continuous) phase transition, the change in enthalpy through the transition is given by
| (5) |
where the limits of integration are as wide as possible about the heat capacity peak. However, for first-order transitions the situation is complicated by the presence of a two-phase coexistence region, in this work I+N, as well as a latent heat . The total enthalpy change through a first-order transition is the sum of the pretransitional enthalpy and the latent heat. In an ac-calorimetric measurement, values observed in the two-phase region are artificially high and frequency dependent due to partial phase conversion during a cycle. The pretransitional enthalpy is typically obtained by substituting a linearly truncated behavior between the bounding points of the two-phase coexistence region into Eq. (5), and an independent experiment is required to determine the latent heat Iannacchione et al. (1998). A direct integration of the observed yields an effective transition enthalpy and this contains some of the latent heat contributions; thus .
For our analysis, the observed was directly integrated over a wide temperature range of K below to K above for all bulk and +aerosil samples where the N-SmA transition enthalpy contribution was subtracted. This will be referred to hereafter as the ac-enthalpy and denoted as , as it represents only a part of the total transition enthalpy. As seen in Fig. 1, an integration of a linearly truncated in the two-phase coexistence region over a similar range yields a pretransitional enthalpy J g-1 that is independent of aerosil density. Integration over a similar temperature range yielded a pretransitional value of J g-1 for +aerosil samples, also independent of silica density Iannacchione et al. (1998). In addition, the integration of the imaginary heat capacity given by Eq. (3) and normalized to the LC mass, defines an imaginary transition enthalpy, referred to as im-enthalpy and denoted as , which is an indicator of the first-order character of the transition. Although is a measure of the dispersive component of the complex enthalpy, it is only approximately proportional to the transition latent heat due to the fixed- ac-technique employed in this work. As the silica content changes, the two-phase conversion rate may change and so alter the proportionality between and ; thus a detailed frequency scan for each sample would be needed to fully characterize the relationship. This was done for a few samples and the frequency employed in this work is sufficiently close to the static limit that this effect should be minimal.
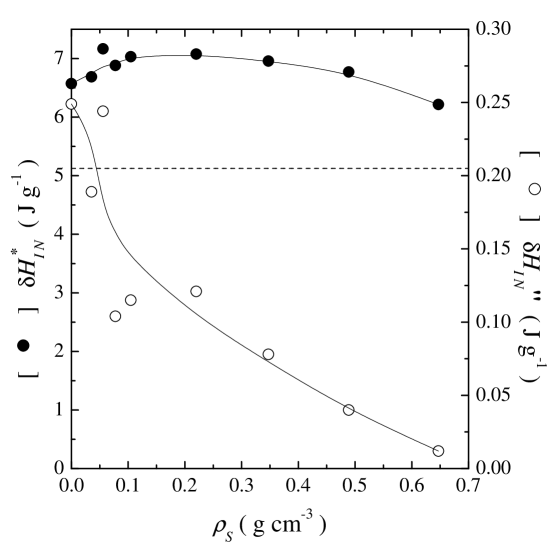
The results of both the ac- and im-enthalpy for +aerosil samples are shown in Fig. 3 as a function of the silica density. There is a slight variation (first increasing for increasing up to then decreasing for larger ) of the ac-enthalpy due mainly to changes in values within the two-phase coexistence range since the heat capacity wings away from the transition are independent (except for , which is systematically high for from K to K). Given the fixed- aspect of the technique, any variation observed in the ac-enthalpy in the two-phase region can be attributable to changes in either the dynamics or magnitude (or both) of the latent heat evolution. The small non-monotonic variation of for +aerosil samples is in contrast to the systematic decrease of with increasing for +aerosil samples. This may reflect a difference in the phase conversion dynamics between and and how they are modified by the presence of aerosils.
The interpretation of the im-enthalpy is more straight-forward as it is closely related to the latent heat of the transition. With increasing , the im-enthalpy appears to monotonically decrease to almost zero for . See Fig. 3. This suggests that for the highest sample studied, the I-N latent heat has become nearly zero. Similar trends were observed for +aerosil Iannacchione et al. (1998) where a continuous I-N transition is estimated to occur near . Also, a nearly continuous I-N transition was reported for +aerosil for silica densities near Jamee et al. (2002). The above observations are consistent with the general view that with increasing QRD, first-order transitions are driven continuous Imry and Wortis (1979).
III.3 Transition temperatures and crystallization
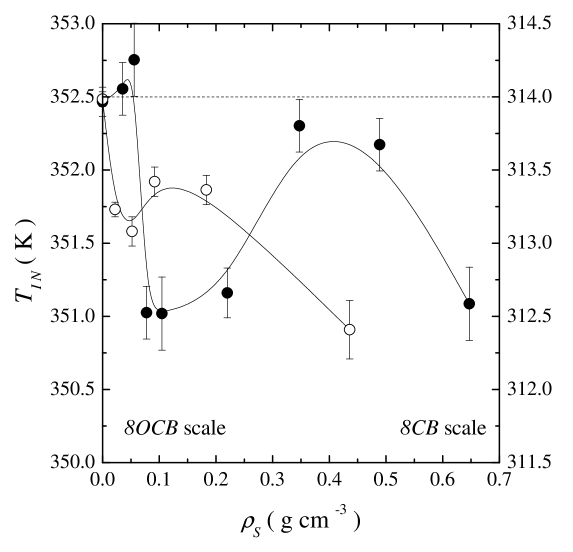
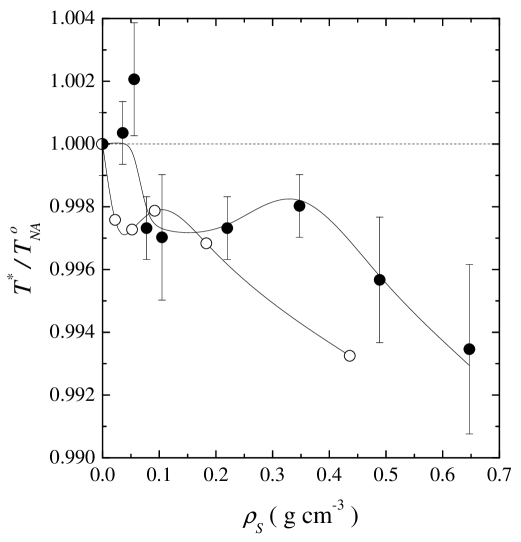
The I-N transition temperature, defined here as the peak in for the highest temperature feature, for the +aerosil samples as well as those for the +aerosil system taken from Ref. Iannacchione et al. (1998) are shown in Fig. 4 as a function of silica density. For the +aerosil system, is essentially unchanged up to then decreases sharply by K at , , and . It then rises strongly for , nearly recovering the bulk value. Upon further increase in , decreases monotonically (with a concave downward character) until it is again about K below for the sample. The non-monotonic evolution of with silica content for the +aerosil system is similar to that seen in the +aerosil system, suggesting that the initial depression of , recovery, then continued depression is a general phenomena of quenched random disorder on nematics while the specific dependence is liquid crystal material dependent. Over this same range in silica density, the width of the two-phase coexistence region also has a non-monotonic dependence on , as seen in Table 1. However, is sensitive to local inhomogeneities of the aerosil dispersion that may account for its variation when . Beginning at , increases monotonically by a factor of while increases by a factor of . The observed broadening of the two-phase coexistence width in nearly direct proportion with increasing QRD is generally consistent with the behavior of first-order transitions with quenched disorder Imry and Wortis (1979).
The N-SmA pseudo-transition temperatures scaled by the bulk transition temperature for +aerosil and +aerosil systems are shown in Fig. 5. The pattern of fractional changes in the is essentially the same for both LC+aerosil systems with an initial rapid depression, recovery, then more gradual decrease with a total change of less than from . The primary difference with the +aerosil system is that this behavior is ”stretched” in for the +aerosil samples. This is consistent with the evolution seen of shown in Fig. 4 and described above.
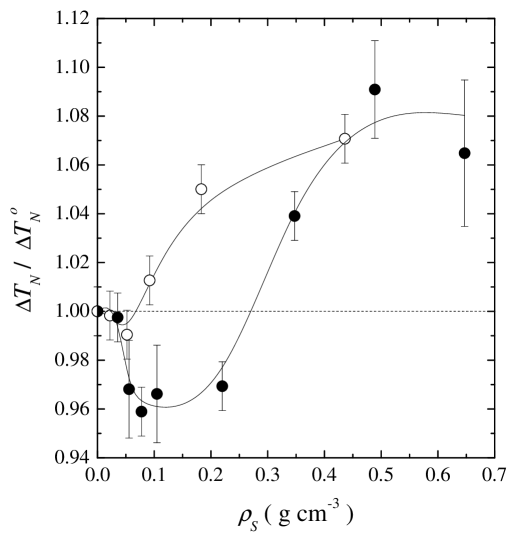
The nematic phase temperature range, , normalized by the bulk nematic range , is shown in Fig. 6. While the individual transition temperature changes reflect the absolute stability limit of the nematic and smectic phases, reflects the relative stability of both phases. For +aerosil, a decrease of in was seen up to , corresponding to the the local maximum of and . This was originally thought to be scatter in the data of Ref. Iannacchione et al. (1998). For +aerosil samples, a similar and far more pronounced decrease in is seen from to . This decrease in reflects a greater depression of than and indicates that in this range of silica density, the disorder primarily effects nematic (orientational) ordering. Upon further increasing , the nematic range begins to increase and appears to saturate at an increase similar to that seen in the +aerosil system. This growth in the nematic range occurs because of the greater suppression of relative to and so, reflects that above , the effect of the silica gel is to mainly disorder smectic (1D-translational) ordering.
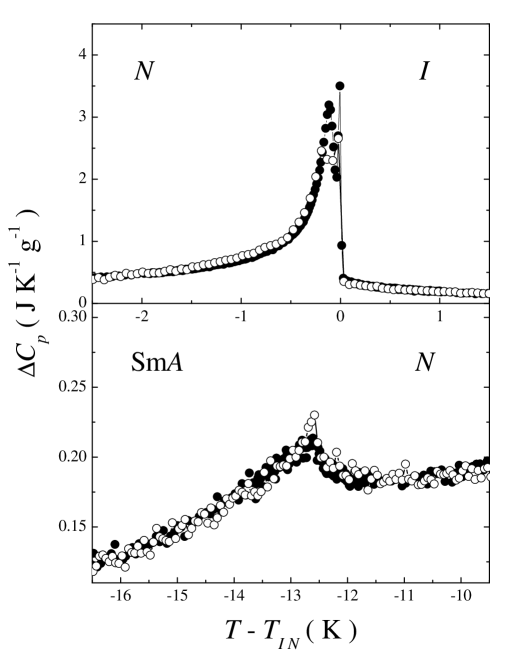
The calorimetric results on the I-N transition temperature described above suggest the importance of sample homogeneity. As a test of the fragility of the silica gel, heat capacity scans were performed on a low and high density +aerosil sample immediately before and after crystallization of the LC. Such a thermal cycle for the sample is shown in Fig. 7 and for the sample in Fig. 8 as a function of in order to suppress hysteresis effects of the I-N transition. The effect of crystallization on the sample is striking, revealing significant distortion of the signature at both the I-N and N-SmA transitions. The appearance of an additional broad feature beginning K below as well as a broadened feature over the N-SmA transition region after crystallization may indicate increased sample inhomogeneity, presumably caused by the local expulsion of silica particles as LC crystallites form. However, there are two puzzling aspects; (1) the shift in is downward by K and (2) the specific distortion seen in about reveals an increased N-SmA transition enthalpy. The first aspect is counter-intuitive as the expulsion of impurities upon crystallization should have moved the system closer to bulk behavior by increasing the size of pure LC domains (regions where no silica is present). The second aspect is particularly puzzling as the N-SmA transition enthalpy after crystallization surpasses the N-SmA transition enthalpy for bulk (, , and all given in units of J g-1). Visual inspection of the sample immediately after the first crystallization revealed no obvious inhomogeneities. A recent Raman spectroscopy study of crystallizing within a gel matrix provides evidence of new solid and semi-solid phase at low temperature Fehr et al. (2003). The additional enthalpy observed here could indicate new solid phases for +aerosil samples. These results are only observed upon initial crystallization of a freshly dispersed +aerosil sample. Bulk behavior is eventually approached upon repeated thermal cycling through the crystallization transition. Clearly, at these low silica densities, the silica gel is, at least locally, quite fragile and short range restructuring of the gel can strongly affect the liquid-crystal.
The results of initial cycling through the crystallization transition for the sample shown in Fig. 8 do not reveal any significant changes. Aside from a very small, sharp, additional heat capacity feature at the N-SmA transition, the curves are almost perfectly reproducible. The shift in after the initial crystallization is small and upward by K, as expected by the expulsion of impurities. This indicates that for higher silica densities, the gel is robust and well behaved. Note that there is no appreciable change in the nematic range, as seen in both Fig. 7 and 8.
IV DISCUSSIONS AND CONCLUSIONS
Results have been presented from high-resolution ac-calorimetric experiments on +aerosil dispersions with emphasis on the weakly first-order I-N phase transition. These results for +aerosil dispersions have been compared with existing results for +aerosil dispersions Iannacchione et al. (1998, 2003) and reveal new aspects of the effect of quenched random disorder on liquid crystal phase transitions. In particular, these two LC+aerosil systems are very similar except for the relative elasticity of the LC material. The material is elastically stiffer, having an effective (single) nematic elastic constant larger by approximately , than , and this is reflected by the higher transition temperatures for the nematic, smectic, and crystal phases. Thus, aspects that are LC material dependent and those that are general to quenched random disorder can be distinguished.
From the very good overlap of the wings away from the I-N two-phase coexistence region and from direct NMR studies on +aerosil Jin and Finotello (2001) a general feature of LC+aerosils is that the magnitude of the nematic order, , is essentially the same as in the bulk LC. Thus, the main effect of QRD is on the director structure with the elasticity of the LC and the kinetics of the ordered phase growth as likely important factors. This is supported by the differences seen between +aerosil and +aerosil systems; in particular, the different dependence is likely connected to the difference in elasticity for the two liquid-crystals.
The effect of quenched random disorder on first-order phase transitions is substantially different than that on continuous phase transitions. First-order transitions have an additional energy penalty for the formation of interfaces between coexisting phases, which complicates random-field type theoretical approaches. In the classical treatment, first developed by Imry and Wortis Imry and Wortis (1979), the QRD effect on first-order transitions is that a quenched random-field creates domains having a randomly shifted transition temperature. This would have the effect of smearing the overall transition, a monotonic decrease in the transition latent heat and temperature with increasing QRD, and a low-temperature phase possessing only short-range order for arbitrarily weak QRD. These predictions are generally consistent with the behavior of nematic in aerogels Wu et al. (1995). For nematics in aerosils, the transition latent heat appears to decrease and the width of the coexistence region to increase monotonically with increasing disorder as well as the transition becoming apparently continuous for high disorder strength. These features are generally consistent with the classical picture. However, the character of the transition and the non-monotonic transition temperature shifts do not appear to be consistent with this view. More strikingly, the I-N transition in aerosils in some range of , appears to proceed via two transitions. This could only occur in the classical view if a bimodal distribution of the random-field variance , connected to a bimodal distribution in , is present. This is not supported by SAXS studies, which revealed the fractal-like nature of the aerosil gel structure Iannacchione et al. (1998), nor the behavior at the N-SmA transition Haga and Garland (1997a, b); Iannacchione et al. (1998). However, nematics are very ”soft” materials and the QRD imposed by aerosils appears to be much weaker than that of aerogels, thus elasticity of the LC (and possibly the gel) can play an important role.
In LC+aerosil systems, is thought to depend on the given concentration of silica and interaction with the LC, whereas the LC elasticity is strongly temperature dependent (being proportional to ) near and below . Since the aerosil gel is thixotropic and formed in the isotropic phase, any high energy strains or deformations that may exist are likely quickly annealed, the anisotropy of the gel should be fixed and essentially zero, especially for rigid gel structures like aerogels. However, the disordering nature of the gels may evolve with thermal history of the LC in aerosil gels. As seen by the result of cycling through crystallization presented here as well as the DNMR Jin and Finotello (2001) and electro-optical Bellini et al. (2000, 2002) studies, the gel can be compliant with respect to distortions in the director structure for a range of silica densities. Note that the quantity differs by at most 10% between and thus the energy scales are similar while the twist elastic constant differs by 36%.
The features described above suggests a possible physical scenario for the origin of the double feature at the I-N (or any ”soft” first-order not (b)) transition in LC+aerosil systems. As the nematic elastic constant strongly increases with decreasing temperature for , a ”skin” of low nematic order (due to the undulations of the aerosil strands) may coat the silica strands. The thickness of this paranematic boundary layer would be strongly temperature dependent, shrinking with decreasing below . The presence of such layer a would serve to partially decouple the disordering (or field) effect of the silica gel from the void nematic (acting as a kind of ”lubricant”). Once the layer thickness reaches its minimum value (roughly equivalent to a molecular length) the elasticity of the void nematic becomes strongly coupled to that of the aerosil gel. This would effectively increase, for a given , the disorder strength.
A consequence of this speculation for a first-order transition induced change in disorder strength (through the onset of coupling between the director fluctuations and gel) would be the alteration of the gel dynamics (i.e., vibrational modes). This would be consistent with large changes in the relaxation times of aerosil gels observed by dynamic x-ray studies on +aerosil near Retsch et al. (2002). In addition, this coupling should dampen director fluctuations and could account for the variation in the critical behavior seen at the N-SmA transition for LC+aerosil samples. Another consequence of this view is that the director correlation length (the relevant aspect of nematic order) would jump to a large isotropic value at the first transition and upon further cooling cross a second transition into a more strongly disordered state having a smaller correlation length. The isotropic nature of and the final SRO state of the nematic with QRD are consistent with recent optical studies Bellini et al. (2002) and the detailed evolution of through the two transitions is the subject of current optical and calorimetric study not (c).
The different silica density dependence of and the temperature distance between the two peaks () between +aerosil and +aerosil would also be consistent with the difference in the nematic elasticity of the two liquid-crystals. A stiffer silica gel (higher ) would be required to influence a stiffer LC, thereby stretching the shift in with respect to as seen between the +aerosil and +aerosil systems. The dependence in the high-density regime of for +aerosil (see Table 1) compared to the nearly constant K seen only in the low density regime of +aerosil Iannacchione et al. (1998) would be compatible with a transition induced increase in the variance of the gel disorder strength. The liquid-crystal being much softer would only be able to stress a very weak (low ) gel while the much stiffer would be able to distort a wider range of gels. Since the dependence of the critical behavior for the N-SmA transition is quite similar between +aerosil and +aerosil Clegg et al. (2003), these observations suggest that the effects observed at the I-N transition are not directly connected to those at the N-SmA.
Finally, the unexpected behavior of low silica density sample when initially cycled through the crystallization transition is not fully understood. The expulsion of silica impurities by the strongly first-order crystallization transition seems to lead to a more disordered system. One possibility to explain this phenomena is that the initial crystallization causes the expulsion of the silica particles locally and transforms the flexible fractal structure into a more rigid, foam-like, gel. The depression of is then a consequence of the greater elastic distortions imposed by the new gel arrangement. Repeated cycling through crystallization would continue to expel impurities, eventually destroying the foam-like structure. Once the silica has been compacted sufficiently, percolation is no longer possible and free-floating silica particles would represent an annealed disorder. The gels formed in the high silica density samples are more robust and would not be expected to change significantly when the LC crystallize. This view can be directly tested with a detailed structural study by small-angle x-ray scattering where the thermal history is carefully controlled. The increase in the enthalpy of the N-SmA transition after the initial crystallization to a value greater than the bulk LC value remains a puzzle. Note that the speculations presented here for the double I-N transition peaks and the unusual hysteresis behavior are intended to motivate future experimental and theoretical studies.
Acknowledgements.
The authors wish to thank C. W. Garland, Robert Leheny, and Tommaso Bellini for many helpful and useful discussions. Funding in Toronto was provided by the Natural Science and Engineering Research Council of Canada, and the work at WPI was supported by the NSF under the NSF-CAREER award DMR-0092786.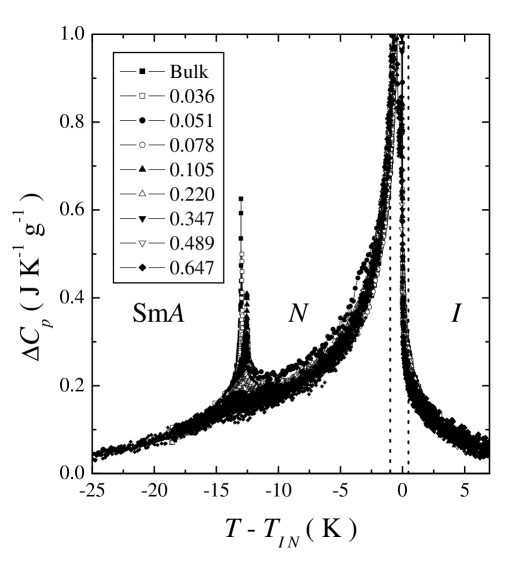
References
- Iannacchione et al. (1998) G. S. Iannacchione, C. W. Garland, J. T. Mang, and T. P. Rieker, Phys. Rev. E 58, 5966 (1998).
- Iannacchione et al. (2003) G. S. Iannacchione, S. Park, C. W. Garland, R. J. Birgeneau, and R. L. Leheny, Phys. Rev. E 67, 011709 (2003).
- Bellini et al. (2001) T. Bellini, L. Radzihovsky, J. Toner, and N. A. Clark, Science 294, 1074 (2001), and references therein.
- Clegg et al. (2003) P. S. Clegg, C. Stock, R. J. Birgeneau, C. W. Garland, A. Roshi, and G. S. Iannacchione, Phys. Rev. E 67, 021703 (2003).
- de Gennes and Prost (1993) P. G. de Gennes and J. Prost, The Physics of Liquid Crystals (Clarendon Press, Oxford, England, 1993), 2nd ed.
- Gingras (1995) M. J. P. Gingras, private communication.
- Feldman (2000) D. E. Feldman, Phys. Rev. Lett. 84, 4886 (2000).
- Imry and Wortis (1979) Y. Imry and M. Wortis, Phys. Rev. B 19, 3580 (1979).
- Bellini et al. (1998) T. Bellini, N. A. Clark, V. Degiorgio, F. Mantegazza, and G. Natale, Phys. Rev. E 57, 2996 (1998).
- Bellini et al. (2000) T. Bellini, M. Buscaglia, C. Chiccoli, F. Mantegazza, P. Pasini, and C. Zannoni, Phys. Rev. Lett. 85, 1008 (2000).
- Bellini et al. (2002) T. Bellini, M. Buscaglia, C. Chiccoli, F. Mantegazza, P. Pasini, and C. Zannoni, Phys. Rev. Lett. 88, 245506 (2002).
- Zhou et al. (1997) B. Zhou, G. S. Iannacchione, C. W. Garland, and T. Bellini, Phys. Rev. E 55, 2962 (1997).
- Marinelli et al. (2001) M. Marinelli, A. K. Ghosh, and F. Mercuri, Phys. Rev. E 63, 061713 (2001).
- Park et al. (2002) S. Park, R. L. Leheny, R. J. Birgeneau, J.-L. Gallani, C. W. Garland, and G. S. Iannacchione, Phys. Rev. E 65, 050703(R) (2002).
- Leheny et al. (2003) R. L. Leheny, S. Park, R. J. Birgeneau, J. L. Gallani, C. W. Garland, and G. S. Iannacchione, Phys. Rev. E 67, 011708 (2003).
- Retsch et al. (2002) C. Retsch, I. McNulty, and G. S. Iannacchione, Phys. Rev. E 65, 032701 (2002).
- Jin and Finotello (2001) T. Jin and D. Finotello, Phys. Rev. Lett. 86, 818 (2001).
- Litster et al. (1979) J. D. Litster, J. Als-Nielsen, R. J. Birgeneau, S. S. Dana, D. Davidov, F. Garcia-Golding, M. Kaplan, C. R. Safinya, and R. Schaetzing, J. Phys. (France) Coll. 40, C3 (1979).
- Bradshaw et al. (1985) M. J. Bradshaw, E. P. Raynes, J. D. Bunning, and T. E. Faber, J. Phys. (France) 46, 1513 (1985).
- (20) Degussa Corp., Silica Division, 65 Challenger Road, Ridgefield Park, NJ 07660. Technical data is given in the Degussa booklet AEROSILS.
- Yao and Garland (1998) H. Yao and C. W. Garland, Rev. Sci. Instrum. 69, 172 (1998).
- Iannacchione et al. (1997) G. S. Iannacchione, S. Qian, D. Finotello, and F. M. Aliev, Phys. Rev. E 56, 554 (1997).
- Kasting et al. (1980) G. B. Kasting, K. J. Lushington, and C. W. Garland, Phys. Rev. B 22, 321 (1980).
- Birgeneau et al. (1981) R. J. Birgeneau, C. W. Garland, G. B. Kasting, and B. M. Ocko, Phys. Rev. A 24, 2624 (1981).
- Wu et al. (1995) L. Wu, B. Zhou, C. W. Garland, T. Bellini, and D. W. Schaefer, Phys. Rev. E 51, 2157 (1995).
- not (a) A very small feature whose exact origin is unclear but may reflect an annealed impurity is seen in bulk at K and shifts upward relative to for the sample.
- Jamee et al. (2002) P. Jamee, G. Pitsi, and J. Thoen, Phys. Rev. E 66, 021707 (2002).
- Fehr et al. (2003) C. Fehr, P. Dieudonne, J. L. Sauvajol, and E. Anglaret, Phys. Rev. E 67, 061706 (2003).
- Haga and Garland (1997a) H. Haga and C. W. Garland, Liq. Cryst. 23, 645 (1997a).
- Haga and Garland (1997b) H. Haga and C. W. Garland, Phys. Rev. E 56, 3044 (1997b).
- not (b) In fact, double peaks were observed at the N-SmA transition in +aerosil samples, which is first-order due to the proximity of the I-N transition. See H. Haga and C. W. Garland, Liq. Cryst. 23, 645 (1997).
- not (c) T Bellini and F Mantegazza and A Roshi and G Iannacchione, in progress.