[
High pressure phases in highly piezoelectric PbZr0.52Ti0.48O3
Abstract
Two novel room-temperature phase transitions are observed, via synchrotron x-ray diffraction and Raman spectroscopy, in the PbZr0.52Ti0.48O3 alloy under hydrostatic pressures up to 16 GPa. A monoclinic (M)-to-rhombohedral (R1) phase transition takes place around 2-3 GPa, while this R1 phase transforms into another rhombohedral phase, R2, at 6-7 GPa. First-principles calculations assign the R3m and R3c symmetry to R1 and R2, respectively, and reveal that R2 acts as a pressure-induced structural bridge between the polar R3m and a predicted antiferrodistortive Rc phase.
pacs:
PACS:64.70.Kb,77.80.Bh,62.50.+p]
PbZr1-xTixO3 (also called PZT) solid solutions with x 0.5 are used, already for decades, in virtually all piezoelectric devices from ultrasound generators to micropositioners, due to their outstanding electromechanical performance [1]. All PZT compositions have the cubic perovskite structure at high temperatures, while they undergo a phase transition, at about 650 K, to a ferroelectric rhombohedral R3m phase (with a polarization pointing along the [111] pseudo-cubic direction) for Zr-rich samples and to a ferroelectric tetragonal P4mm phase (with a polarization lying along [001]) for Ti-rich samples [1, 2]. Recently, higher resolution synchrotron x-ray experiments at low temperatures in high quality samples have made possible the resolution of the region around the R3m-P4mm boundary, and have revealed the existence of a third ferroelectric phase with a lower monoclinic (M) Cm symmetry within a narrow compositional range [3]. This M phase can be considered as a structural bridge between the R3m and P4mm phases since its polarization continuously rotates in the (10) plane from the [111] to the [001] pseudo-cubic directions, as the Ti content increases [4]. Raman measurements in PZT have also found mode splitting which are consistent with monoclinic symmetry [5, 6], and first-principles calculations have shown that the polarization rotation is responsible for the large piezoelectric coefficients observed in PZT [7, 8, 9].
Furthermore, antiphase oxygen rotations, superimposed on polar displacements, have been recently observed within the monoclinic phase of PZT at low temperature [10, 11]. This is consistent with first-principles calculations predicting that oxygen rotations and polar displacements are close in energy [12]. Interestingly, the energetical order between different phases in perovskite materials can be modified by applying an external pressure. This is clearly evidenced by earlier works observing that pressure lowers the Curie temperature of phase transitions induced by softening of zone-center phonons, like the polar modes in PbTiO3 [13] — and thus leads to a cubic paraelectric phase at high enough pressure, as recently reported for PbZr0.52Ti0.48O3 [14] — while it increases the temperature of the transitions related to zone-boundary modes like the antiferroelectric mode in PbZrO3 [15]. These opposite effects [12, 13], the fact that Cm is a structure bridging the R3m and P4mm phases (and is thus very sensitive to a small change of interactions [16]), and the observed coexistence of polar displacements and oxygen rotation suggest that the phase diagram of PZT versus pressure can be extraordinary rich.
Motivated to precisely determine and fully understand this phase diagram, we combined three complementary techniques, synchrotron x-ray diffraction, Raman spectroscopy and first principles calculations, to investigate PbZr0.52Ti0.48O3 under hydrostatic pressure. These studies revealed (1) two novel phase transitions, (2) two different pressure-induced bridging structures, and (3) the absence of a high pressure cubic paraelectric phase.
The same PbZr0.52Ti0.48O3 ceramic pellets of Ref. [3] were used. A piece was crushed into powder and loaded in a diamond anvil cell using both nitrogen and a 4:1 methanol-ethanol-mixture as pressure media for the x-ray and Raman measurements, respectively. A maximum pressure of 16 GPa was reached in hydrostatic conditions. The pressure was measured by the ruby fluorescence method [17]. X-ray diffraction data were taken at room temperature in the ID9 beamline at the ESRF with a monochromatic beam of =0.414 Å focused to a 30x30 spot and using an angle dispersive set-up with image plate detector. The unit cells for the different pressures were obtained by means of a full profile Le Bail analysis [18, 19], using a pseudo-voigt peak shape with asymmetry correction [20]. A second cubic phase was used to account for the diffuse scattering found in the monoclinic phase, as in ref. [3]. Depolarized Raman spectra of the sample powders were recorded at room temperature in back-scattering geometry with a Jobin Yvon T64000 spectrometer equipped with a microscope objective and the 514.5 nm line of an Ar+ ion laser as excitation line. The Raman spectra after pressure release were identical to the initial spectra attesting the reversibility of pressure-induced changes.
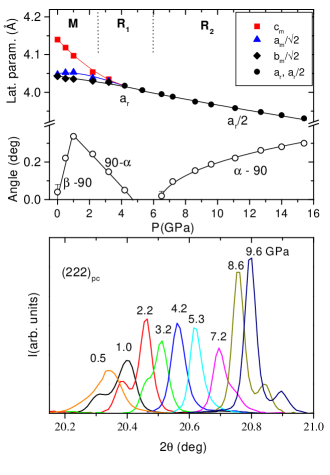
As shown in Figure 1(top), at atmospheric pressure PbZr0.520Ti0.48O3 is just at the monoclinic-tetragonal phase transition showing a very small monoclinic distortion, with lattice constants am, bm, cm and a angle. Pressure induces fairly large and continuous changes in , in agreement with ref.[14], and far more subtle changes in am, bm and . Small pressures below 2 GPa increase the monoclinic distortion by increasing both and the difference between am and bm. At 2-3 GPa, am= bm=cm, and the triplet of the pseudo-cubic (222) reflection (see Fig. 1 (bottom) ) observed at low pressures changes into a doublet. The corresponding phase, denoted by R1, is rhombohedral with an angle 90o , or unit cell elongated along [111] [21]. The most plausible space group for R1 is R3m since this latter is ferroelectric with polarization along [111]. For P 3 GPa, the rhombohedral distortion of R1 decreases with increasing pressure, until at about 5 GPa when the diffraction pattern seems to be cubic with no visible peak split in agreement with ref.[14]. However, an analysis of the peak widths shows that they are not resolution limited, suggesting local non-cubic distortions. Interestingly, when the pressure is further increased, above 7 GPa, the distortion from cubic continuously increases and the diffraction peaks start splitting again. As seen in Figure 1(bottom), the diffraction pattern is again that of a rhombohedral phase but this time with 90o [21]. This new phase (denoted by R2) is thus associated to a unit cell flattened along [111]. One good candidate for the symmetry of R2 is Rc since all known rhombohedral perovskites with 90o adopt this space group[22], a well-known example being LaAlO3. In this non-polar structure the distortion from cubic is due to anti-phase rotations of the oxygen octahedra around the [111] direction, which results from the condensation of zone-boundary modes (R25) and thus double the unit cell [23]. This type of rotations is also observed in Zr-rich PZT at atmospheric pressure and low temperature, although in this case polar displacements are also present and the structure has the space group R3c with 90o [24].
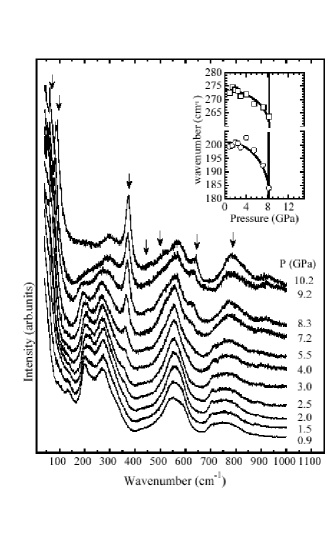
Raman measurements were performed to complement the x-ray data. Figure 2 presents the evolution of the Raman spectra of the same sample with increasing pressure until 10.2 GPa. A particularly striking finding is that the Raman signal is fairly well-defined for any pressure, including the ones around 5-7 GPa for which x-ray shows a cubic-like structure, implying the existence of non-cubic distortions on the Raman characteristic length scale, too small for x-rays to resolve it. Furthermore, the spectra at low pressures are similar to those reported in the recent literature [5, 6, 14] for similar compositions. Several changes are noticed upon increasing pressure. The most obvious one being the appearance of several new bands at high pressures (marked with arrows in the figure) and the suppression of some others. Most of the changes appear in between 5.5 and 7.2 GPa, in agreement with the critical pressure observed by x-ray diffraction for the transition to the R2 phase. The strong and sharp band at 380 cm-1 has been observed under pressure in other perovskites and has been associated with rhombohedral symmetry [25, 26]. Its narrow width at high pressures is indicative of the long-range character of the distortion, and the increase in the number of bands is also consistent with a doubling of the unit cell. Furthermore, we observe a softening (inset Figure 2) and progressive disappearing of the two modes in the 200-to-350 cm-1 range, clearly supporting the occurence of a phase transition, most possibly related to fundamental changes of the Zr/Ti-cation displacement.
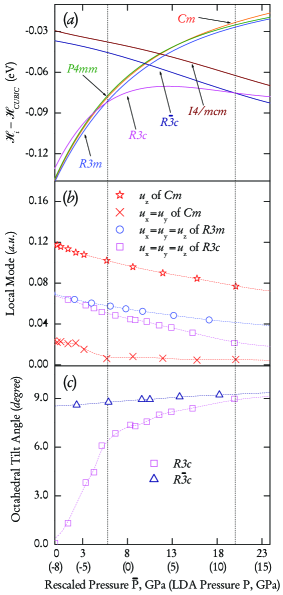
In order to gain further insights, we also perform 0K calculations within the local density-approximation (LDA) [27], using the virtual crystal approximation (VCA) proposed in Ref. [28] (in which further details of the calculations can be found). We limit ourselves to the study of 7 phases: the paraelectric cubic Pm-3m state; the ferroelectric monoclinic Cm, rhombohedral R3m and tetragonal P4mm phases; the antiferrodistortive rhombohedral Rc and tetragonal I4/mcm phases; and the rhombohedral R3c state that can exhibit both polar and antiferrodistortive degrees of freedom. The lattice vectors of the Cm, R3m and P4mm phases are those experimentally determined in Refs. [29, 30] for an atmospheric pressure, and the associated strain tensors – with respect to the cubic case – are kept frozen in our calculations. On the other hand, for computational convenience, the lattice vectors of the Rc, I4/mcm and R3c phases do not contain any strain with respect to the cubic phase. Fig 3a shows the difference between the enthalpy of each phase and the enthalpy of the cubic paraelectric phase as a function of pressure. It is well known that LDA usually underestimates the lattice constant, which explains why the LDA-predicted pressure corresponding to the experimental volume determined in Ref [29] for the Cm phase, at low temperature and at an atmospherique pressure, is found to be 8 GPa. Therefore, in order to compare with the experiments, we have performed an uniform shift of the theoretical scale by 8 GPa, as indicated in Figs 3 by the rescaled theoretical pressure .
One can notice that our simulations yield a R3m phase that is slightly more favorable than Cm for . This discrepancy between theory and experiments for the ground-state symmetry is likely due to the fact that we neglect an important feature of monoclinic phases in our VCA calculations, namely the significant disorder existing between local dipoles located in different 5-atom cells [31, 32]. On the other hand, further using this rescaled pressure scale leads to a R3m–R3c transition occurring around 6 GPa. This is in remarkable agreement with the experimentally-determined R1–R2 transition pressures mentioned above [33], and thus strongly suggests that the spaces groups of R1 and R2 are R3m and R3c, respectively. The calculations further predict that R3c transforms into a Rc phase for pressure around 20 GPa. (Note that of the R3c and Rc phases are quite negative even for larger than 20 GPa, which further confirms the absence of a high pressure cubic phase.)
Fig 3b and Fig 3c show the pressure behavior of the local soft-mode (directly related to the spontaneous polarization [34]) and the rotation angle of the oxygen octahedra, respectively, for the relevant phases. One can clearly see that the z-coordinate of in the Cm phase significantly decreases when increasing from 0 to 2 GPa, while the corresponding x- and y-components are barely affected by this change of pressure. (Note that the x-, y- and z- axes are chosen along the pseudo-cubic [100], [010] and [001] directions, respectively). These simulated behaviors are consistent with the pressure changes of am, bm and cm depicted in Fig 1 for the M phase, since ferroelectrics are well-known to exhibit a coupling between polarization (related to ) and strain (related to lattice vectors) [34]. Similarly, the continuous decrease predicted for every component of in the R3m phase – when increasing from 2 to 6 GPa – is consistent with the experimentally observed increase (see, Fig 1) towards for the rhombohedral angle of R1 in this range. Figs 3b and 3c further indicate that in the R3c phase for rescaled pressures above 3 GPa, the spontaneous polarization decreases in magnitude while the rotation of the oxygen octahedra increases, at increasing pressure. First-principles calculations thus provide a successful explanation for the unusual phase that is Raman-active but characterized by a angle between its lattice vectors, and that is observed for pressure ranging between 5 and 7 GPa (see Figs 1 and 2): this phase is simply a R3c structure in which polar displacements (favoring ) compete with the rotation of the oxygen octahedra (favoring ). When further increasing pressure, the simulations yield a significant increase (decrease) of the antiferrodistortive (polar) structural features. This explains why increases with pressure after 7 GPa (see Fig.1), and also indicates that R3c behaves as a pressure-induced bridging structure between the R3m and Rc phases (which are not in a simple super- or subgroup relation).
In summary, complementary synchrotron x-ray diffraction, Raman spectroscopy and first principles calculations in piezoelectric PbZr0.52Ti0.48O3, under pressure, reveal two novel room-temperature phase transitions. The first transition occurs around 2-3 GPa from the ferroelectric monoclinic Cm phase to a ferroelectric rhombohedral R3m phase. The second transition occurs at 6-7 GPa, from the ferroelectric rhombohedral R3m phase to a rhombohedral R3c phase exhibiting both polar and antiferrodistortive structural features. The first transition thus involves polarization rotation, while the second transition leads to a smooth suppression of the polar displacements and continuously increases the oxygen rotations around the Zr/Ti cations with increasing pressure. The pressure phase diagram of PZT thus contains two peculiar bridging structures: polar Cm that can be seen as the natural evolution of polar P4mm to polar R3m, and R3c that brings polar R3m to antiferrodistortive Rc. The absence of a high-pressure cubic phase is, therefore, reported. Our results may also be relevant to thin films because of the crucial role played by the stress in these two-dimensional systems. Finally, we would like to raise the possibility that the mysterious (cubic-like while polar) so-called X-phase, recently reported in some complex perovskites [35], is a phase similar to the one we observe at the R3m-R3c transition, namely a phase in which polar distortions compete with antiphase oxygen rotations.
We would like to thank R. Guo and the late S.K. Eagle Park for the excellent samples and D.E. Cox and G. Shirane for very useful discussions. The theoretical part of this work is supported by Office of Naval Research Grants N00014-01-1-0600 and N00014-01-1-0365 (Center for Piezoelectrics by Design), and National Science Foundation Grant DMR-9983678.
REFERENCES
- [1] B. Jaffe et al., Piezoelectric ceramics, London: Academic Press, 1971.
- [2] G. Shirane et al. J. Phys. Soc. Jpn 7, 5 (1952)
- [3] B. Noheda et al. Appl. Phys. Lett. 74, 2059 (1999); Phys. Rev. B 61, 8687 (2000); Phys. Rev. B63, 014103 (2001).
- [4] R. Guo et al. Phys. Rev. Lett. 84, 5423 (2000)
- [5] J. Frantti et al., Jpn. J. Appl. Phys. 38, 5679 (1999).
- [6] K.C.V. Lima et al. Phys. Rev. B63, 184105 (2001).
- [7] L. Bellaiche et al. Phys. Rev. Lett. 84, 5427 (2000).
- [8] H. Fu and R. Cohen, Nature 403, 281 (2000).
- [9] Z. Wu and H. Krakauer, Phys. Rev. B68, 014112 (2003)
- [10] B. Noheda et al. Phys. Rev. B66, 054104 (2002)
- [11] D.M. Hatch et al. Phys Rev. B65 , 212101 (2002); Ragini et al. Phys Rev. B 64 , 054101 (2001).
- [12] M. Fornari and D.J. Singh, Phys. Rev B63, 092101 (2001)
- [13] G.A. Samara et al. Phys Rev. Lett. 35, 1767 (1975)
- [14] J. Rouquette et al. Phys. Rev. B65, 214102 (2002); Solid State Sciences 5, 451 (2003).
- [15] G.A. Samara et al. Phys Rev. B1, 3777 (1970)
- [16] A.M. George, J. Íñiguez and L. Bellaiche, Phys. Rev. Lett. 91, 045504 (2003).
- [17] H. K. Mao et al. J. Geophys. Res. 91 4673 (1986)
- [18] Le Bail et al., Mater. Res. Bull., 23, 447 (1998)
- [19] Rietica v.1.7.7: IUCR Powder Diffraction 22, 21 (1997)
- [20] L. W. Finger et al. J. Appl. Crystallogr. 27, 892(1994); P. W. Stephens, ibid 32, 281 (1999)
- [21] A doublet with intensity ratio 1:3 (3:1) is expected for the (hhh) reflection of a Rhomboedral phase with 90o ( 90o).
- [22] H. Megaw, C.Darlington, Acta Cryst.A31, 161 (1975)
- [23] J. D. Axe et al., Phys. Rev. 183, 183 (1969)
- [24] A.M. Glazer et al. Acta Cryst.B34, 1060 (1978)
- [25] J. Kreisel et al. Phys Rev. B65, 172101 (2002).
- [26] B.Chaabane et al., Phys Rev. Lett. 90, 257601 (2003).
- [27] P. Hohenberg and W. Kohn, Phys. Rev. 136, B864 (1964); W. Kohn and L.J. Sham, ibid. 140, A1133 (1965).
- [28] L. Bellaiche and D. Vanderbilt, Phys. Rev. B 61, 7877 (2000).
- [29] B. Noheda et al., Phys. Rev. B 61, 8687 (2000).
- [30] B. Noheda et al., Ferroelectrics 237, 237 (2000).
- [31] I. Grinberg et al. Nature 419, L909 (2002)
- [32] A.M. George, J. Íñiguez and L. Bellaiche, Phys. Rev. B, 65, R180301 (2002).
- [33] The uncertainty of the theoretical transition pressure between R3m and R3c is estimated to be 1 GPa.
- [34] W. Zhong, D. Vanderbilt, and K. M. Rabe, Phys. Rev. B 52, 6301 (1995); Phys. Rev. Lett. 73, 1861 (1994).
- [35] G. Xu et al., Phys. Rev. B 67, 104102 (2003)