Intrusion and extrusion of water in hydrophobic mesopores
B. LEFEVREa, A. SAUGEYb,c, J.L. BARRATd,
L. BOCQUETd, E. CHARLAIXd, P.F. GOBINb and G. VIGIERb
.
a Laboratoire de Matériaux Catalytiques et Catalyse en Chimie Organique,
8, rue de l’Ecole Normale, 34296 Montpellier Cedex 05, France
b Groupe d’Etudes de Métallurgie Physique et de
Physique des Matériaux, 20, Avenue Albert
Einstein, 69621 Villeurbanne Cedex, France
c Laboratoire de Tribologie et Dynamique des Systèmes, Ecole Centrale de Lyon,
36 Avenue Guy de Collongues, BP163, 69134 Ecully Cedex, France
d Laboratoire de Physique de la Matière Condensée et Nanostructures,
Université Claude Bernard, 6 rue Ampère, 69622 Villeurbanne Cedex, France
∗
ABSTRACT
We present experimental and theoretical results on intrusion-extrusion cycles of water in hydrophobic mesoporous materials, characterized by independent cylindrical pores. The intrusion, which takes place above the bulk saturation pressure, can be well described using a macroscopic capillary model. Once the material is saturated with water, extrusion takes place upon reduction of the externally applied pressure; Our results for the extrusion pressure can only be understood by assuming that the limiting extrusion mechanism is the nucleation of a vapour bubble inside the pores. A comparison of calculated and experimental nucleation pressures shows that a proper inclusion of line tension effects is necessary to account for the observed values of nucleation barriers. Negative line tensions of order are found for our system, in reasonable agreement with other experimental estimates of this quantity.
1 Introduction
Porous materials are involved in many industrial processes such as catalysis, filtration, chromatography, etc… In order to understand such processing technologies, accurate information on the porous texture (surface area, pore size distribution and pore shape) is needed. The most widely used characterization methods are based on adsorption isotherms and capillary condensation, usually described as a gas-liquid phase transition shifted by confinement [1]. Other methods, based on capillary evaporation (mercury or water porosimetry on hydrophobic porous materials) often provide a useful alternative. Experimental data obtained with either type of method are generally characterized by a strong hysteresis phenomenon, the precise nature of which is still a matter of debate[2].
Recently, a new field of application for porous materials, devoted to the storage or dissipation of mechanical energy, has begun to develop [3]. This application is based on forced intrusion-extrusion cycles of water in hydrophobic (non-wetting) porous media. The range of pore sizes necessary for this application is typically less than nm, i.e. in the range of mesopores as defined by IUPAC, and the energetic characteristics of devices based on this process are directly related to the hysteresis of the intrusion/extrusion cycles. It is therefore of importance to develop a quantitative understanding of hysteresis phenomena involved in the condensation/drying transition in mesoporous materials.
One promising material in this area are materials of the ’MCM41’ type [4], in which the pore are essentially independent, parallel cylinders with diameters in the nanometer range. The relative simplicity of these materials, in which the pore geometry is well understood and the connectivity between pores is believed to be absent, makes them ideal for studying the hysteretic behaviour. In the range of size of mesopores, two types of effects compete to induce hysteresis: on one hand kinetic effects associated with the phase transition control the apparition of one phase when the material is saturated with the other phase ; on the other hand effects related to the complexity of the solid matrix determine the propagation of liquid/vapor meniscii in the material. The contribution of those two types of mechanism is not well understood. Disorder effects are often addressed using a mean field approach to model capillary condensation or drying. In these treatments, hysteresis is related either to the disorder induced by the porous matrix (treated in the simplest approaches by introducing different advancing and receding contact angles) or to percolation effects (’pore blocking’ models). In such approaches quantitative predictions are limited by the need of using a precise description of pore geometry. As far as the kinetics of phase transition is concerned, two types models have been proposed to deal with capillary evaporation (also called as the drying transition) in hydrophobic systems. The first approach is to envision the process as driven by the nucleation of a vapour bubble. In this scheme, drying is topologically equivalent to capillary condensation by nucleation. An exemple of this approach can be found in the work of Restagno et al. [5], who used a macroscopic approach to predict the behavior of critical nuclei in two and three dimensional slit pores, and made a comparison with a time dependent Landau-Ginzburg simulation of condensation in two dimensions. Talanquer and Oxtoby [6] implemented a density functional theory for the nucleation in slit pores and improved the macroscopic model by incorporating a line tension. Bolhuis and Chandler [7] combined the transition path sampling method with molecular dynamics and Monte Carlo simulations to study the drying transition path in narrow pores. The second type of model is based on the idea that density fluctuations lead to a spinodal type of instability for a liquid film between parallel plates. Under this category, one may for example cite the work by Lum et al. [8, 9], who used Glauber dynamics Monte Carlo simulations for a lattice gas confined in a slit pore with strongly hydrophobic walls. Their work showed that the drying transition can be, in this situation, driven by a large wavelength fluctuation of the density at the interface. Wallqvist et al. [10] also considered the influence of attractive Van Der Waals forces on the density fluctuations near the interface, and showed that these interactions could strongly reduce the width of the interfacial region, therefore reducing the fluctuations that lead to spinodal decomposition.
In view of this rather confusing situation, it appears useful to investigate the drying transition in well characterized materials, and to attempt a quantitative comparison between model calculations and model experiments in order to understand which route towards drying can account for the experimental results. The work presented in this paper represents a first step in this direction.
We first present an experimental study of intrusion-extrusion cycles of water in hydrophobic MCM41. In these model materials made of independent pores of cylindrical shape, effects related to the disorder of the solid matrix such as ”pores blocking” are not expected to be important. The hysteretic behaviour of intrusion/extrusion cycles should be a kinetic phenomenon associated with the dynamics of the phase transition in the confined system. We find that the intrusion pressure of water is governed by the Laplace law of capillarity and scales as the inverse of the pore radius down to a pore size of . In contrast, the extrusion pressure is governed by the nucleation of a vapor phase in the pores and varies much more rapidly with the pore size than the intrusion pressure.
Part III addresses the nucleation of a bubble in a cylindrical pore. We use a simple macroscopic model based on classical capillarity for calculating the energy barrier. The macroscopic approach, in spite of its limitations when dealing with nanometer sized pores, has proven to be quite robust down to very small length scales and is well adapted here since it describes successfully the intrusion process. We show that depending on the ratio between the pore size and the Kelvin’s radius, the shape of the critical nucleus is either an annular cylindrical bump, or an asymmetric bubble growing on one side of the cylinder.
Part IV is devoted to a quantitative comparison between theory and experiment. The plain classical capillarity model is in good qualitative agreement with the data and describes quantitatively well the temperature dependence of the hysteresis cycle. However it fails to describe accurately the variation of the extrusion pressure with the pore size. We show that excellent quantitative agreement is recovered if one takes into account line tension effects, i.e. the energy of the three-phase line of the critical nucleus. Experimental extrusion occurs when the energy barrier has a constant value of about for all pore sizes and temperature investigated.
2 Experimental section
2.1 Parent materials
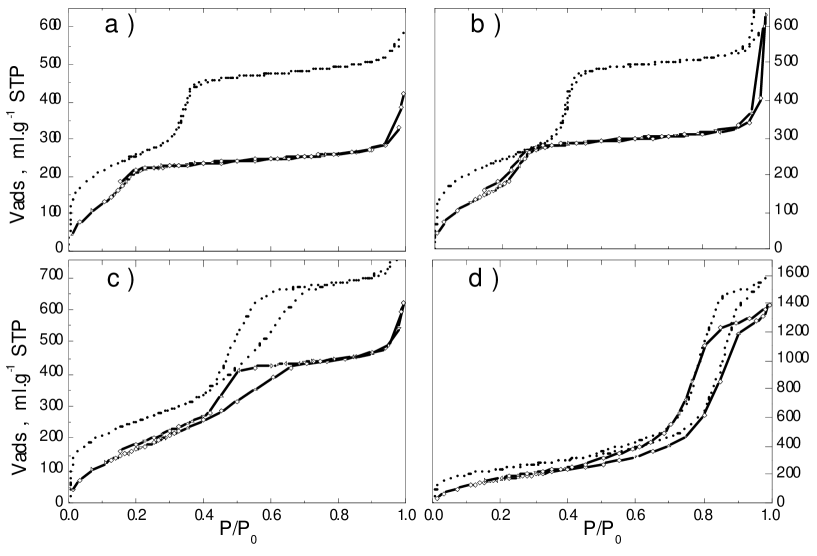
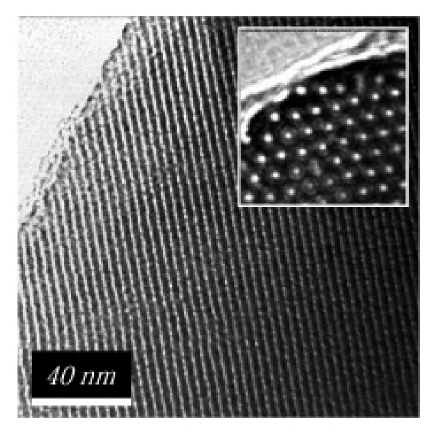
The materials used in this work are micelle-templated silicas, MTS, of the MCM-41 type synthetised from an alkaline silicate solution in the presence of surfactants [4]: hexadecyltrimethylammonium bromide (CTAB) and octadecyltrimethylammonium bromide, were used in the synthesis of samples MTS-1 and MTS-2 respectively. Following standard procedures [4] [11] , materials with larger pores were obtained by incorporating a swelling agent of the micelles such as trimethylbenzene (TMB). Samples MTS-3 and MTS-4 were prepared by incorporating TMB in the ratios TMB/CTAB of 2.7 and 13 respectively. Low temperature (77 K) nitrogen sorption isotherms of the corresponding calcined materials are gathered in Figure 1. The sharp condensation steps for samples MTS-1 and MTS-2 are typical from MCM-41 materials and reveal low pore size distributions. The regularity of the mesopores arrangement and the model structure are confirmed by Transmission Electron Microscopy (TEM). Images of sample MTS-2 are given in Figure 2 as an example. Less ordered pore textures are expected when TMB is used as a swelling agent (samples MTS-3 and MTS-4). Anyway, because the mechanisms involved in the pore generation during the synthesis are similar for the four samples, it is quite reasonable to believe that their porous textures also consist in cylindrical and independent channels. From nitrogen sorption data, the specific surface areas, , were calculated using the BET theory [12]. Mean pore radii, , were calculated from Broekhoff-De Boer theory (BdB) [13] applied to the relative pressure corresponding to the inflection point of the desorption step. This determination was previously shown to be in good agreement with nonlinear density functional approaches (NDFT) [14] and geometrical arguments for MCM-41 materials [15]. Mesoporous volume, V, were measured as the amount adsorbed at the top of the condensation step. Textural properties are gathered in table 1.
| Parent materials | MTS-1 | MTS-2 | MTS-3 | MTS-4 |
| / | 0.71 | 0.76 | 1.06 | 2.38 |
| / | 932 | 855 | 898 | 856 |
| / | 1.8 | 2.0 | 2.4 | 5.9 |
| Grafted materials | MTS-1g | MTS-2g | MTS-3g | MTS-4g |
| / | 1.39 | 1.17 | 1.34 | 1.35 |
| / | 0.35 | 0.44 | 0.68 | 2.01 |
| / nm | 1.3 | 1.5 | 2.3 | 5.6 |
| / nm | 1.3 | 1.6 | 2.0 | 5.4 |
2.2 Hydrophobized materials
Hydrophobicity at the surface of the pores was generated by covalent grafting of n-octyl-dimethylchlorosilane by a pyridine-assisted reaction following a procedure described elsewhere [16][17]. Grafted materials are referred to as MTS-1g, MTS-2g, MTS-3g and MTS-4g. Grafted chains densities, , were determined from carbon analysis and from of the parent silica (see table 1). Nitrogen sorption isotherms on grafted-MTS materials are reported per gram of bare silica in figure 1 together with sorption data on parent materials. This correction allows a more intuitive visualization of the textural modification induced by the grafting treatment [18]. In a first approach, BdB theory can be applied to estimate the mean pore radius of the grafted materials, R (see results in table 1), but the presence of high amounts of organic ligands may strongly modify the interactions between the pore surface and the adsorbate during the sorption experiment and affect the desorption pressure. Therefore, the values of pore radii determined by BdB theory on these samples are questionable. To overcome this uncertainty, one can estimate the pore radii of the modified samples by considering the change in pore volumes measured by nitrogen sorption. A similar approach was used by Fadeev et al [19] to estimate the grafted layer thickness in similarly modified silica gels. In the case of cylindrical pores, the volume which becomes unaccessible to nitrogen molecules after the surface treatment is actually represented as a muff according to this interpretation. Using equation 1 [19], the pore radius for a modified sample, R, can be calculated (V is the mesopore volume of the modified sample expressed per gram of parent material).
| (1) |
One of the interests of such a calculation in the present study is that no assumption is done on the mechanisms of adsorption on a grafted surface.
2.3 Water intrusion-extrusion study
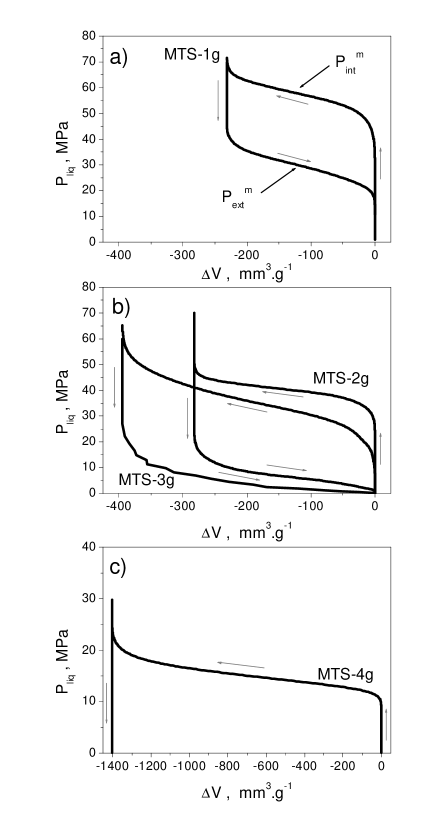
Water intrusion experiments were performed on a specially designed apparatus described elsewhere [20]. About 2 grams of outgassed hydrophobized material were gathered with a large excess of deionized water (compared to the corresponding disposable pore volume) into a thermosealed shrinkable polymer container. In a typical experiment, the pressure was first continuously increased from atmospheric pressure, to 80 MPa by means of a mechanical increasing constraint, and then decreased back to . The time required for a complete cycle was about 4 minutes. No significant difference was observed in our experiments for 1 minute to 1 hour long cycles. The pressure of the liquid and the volume variations were simultaneously recorded. The volume values were corrected to eliminate deformation and the compressibility contributions, following a procedure described elsewhere [21]. The representation of the water pressure as a function of the corrected volume variation (expressed per gram of parent material) are denoted P/V curves. In these plots, volume variations reflect the cumulative intruded and extruded volumes of water into the pores during compression and decompression steps respectively. Therefore, the corresponding plots will be denoted as ”intrusion branch” and ”extrusion branch”. Tens of cycles could be recorded on samples MTS-1g, MTS-2g and MTS-3g, allowing the system to stay at for 10 minutes between each run. Slight evolutions were observed from the first to the third cycle, probably corresponding to irreversible intrusion in some parts of the material (see [22]). The next cycles were completely reproducible. Data presented in this paper correspond to these last cycles designed as ”stable” cycles. For sample MTS-4g only one intrusion could be recorded as no water extrusion took place during the decompression step, and even after several hours at . For this material, spontaneous extrusion of water does not take place. The corresponding P/V curves are reported in Figure 3. The absolute value of the pore volume can be deduced from the water capacity at the end of intrusion branch. This value is systematically smaller than the pore volume determined by nitrogen sorption. This may be a consequence of the strong difference between a good wetting of the grafted chains by nitrogen and a non-wetting behavior in the case of water. The mean intrusion (extrusion) pressure () related to the inflexion point of the intrusion (extrusion) branch are gathered in table 2 for the four selected samples. The dependance of and with mean pore radius and surface chemistry will be discussed in the next sections.
| Grafted materials | MTS-1g | MTS-2g | MTS-3g | MTS-4g |
|---|---|---|---|---|
| / | 59.5 | 44.4 | 35.0 | 14.4 |
| / | 30.8 | 6.2 | 2.5 | - |
2.4 Variation of intrusion pressure with pore size
The Laplace equation is generally used to described the pressure
drop trough a curved interface. Assuming that the liquid / vapor
interfaces are spherical caps and that the pores are cylindrical,
the equilibrium pressure drop trough a meniscus in a
pore of radius is :
| (2) |
where is the interfacial tension of the liquid/vapor interface and the equilibrium contact angle. Then, assuming that the pressure of the vapor is negligible, and that during the intrusion process the triple line advances by adopting an advancing contact angle () we can in theory express the applied pressure required for intrusion by means of local parameters and . This relation, used to derive pore-size distributions from mercury injection experiments, is known as the Laplace-Washburn equation:
| (3) |
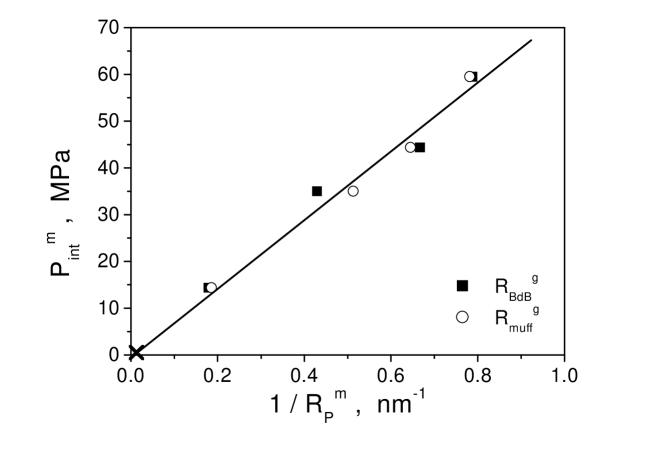
If we now consider the set of data obtained on our materials, the validity of this equation to describe the variation of the intrusion pressure as a function of the pore size can be checked by plotting against (figure 4). In this representation, a straight line is obtained with a good correlation when the pore radius is calculated following the muff model (). Several conclusions can be extracted from this result: (1) First, this linear plot includes with a reasonably good agreement the origin, which is consistent with the fact that as . (2) Second, a constant advancing contact angle for all the samples is expected, since the plot is linear. This indicates close values of the grafting densities for the four samples. Assuming the macroscopic value from the tables for , the slope allows to estimate , a reasonable value for this type of grafted materials. (3) Third, this results indicates that the representation of the grafted phase as a muff is suitable to describe the pore space and to estimate the pore size for this type of modified materials. (4) Finally, it is remarkable to note that the Laplace-Washburn equation is still successful to describe the intrusion of a non-wetting liquid into cylindrical mesopores of diameters as small as 2.6 nm, which had not been evidenced before for model materials (Eroshenko et al [23] [24] [25]. Gusev [26] and Gomes et al [27] reported interesting results for diameters down to 5 nm but in modified silica gels presenting a disordered porosity). Therefore, it could be said that confinement has no significant effect on the intrusion process -apart from the trivial effect expected from a macroscopic description.
2.5 Variation of drying pressure with pore size
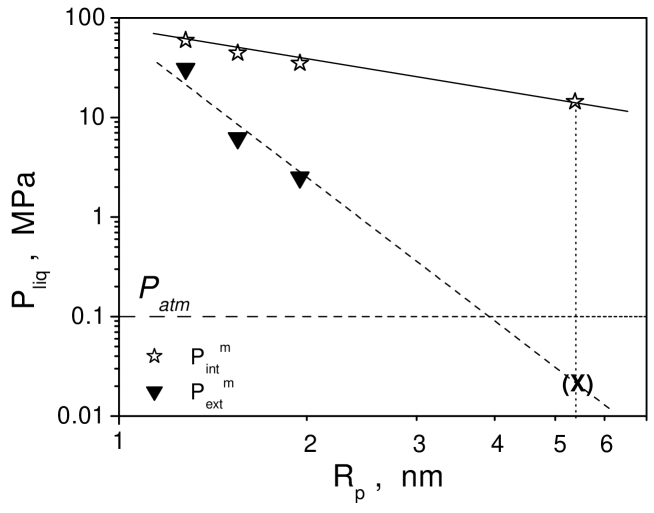
We now consider the mean extrusion pressure, . The conventional approach used to describe the withdrawal of mercury is to consider a receding contact angle, to express by means of the Laplace-Washburn equation. As concluded from the previous section, the surface properties (chemistry, rugosity) for the present samples are believed to be quite similar in terms of hydrophobicity as a single value of was found for the four materials. Therefore, if the propagation of menisci according to a receding contact angle was an accurate description of the extrusion process, should vary as , in the same way as . This dependency was tested by plotting both and as a function of in logarithmic scales in figure 5. While the intrusion law (Laplace-Washburn) appears as a line of slope , the tendency is completely different for the extrusion law, as indicated by the experimental mean extrusion pressures measured on samples MTS-1g, MTS-2g and MTS-3g. seems to be more sensitive to as revealed by the larger slope ( compared to ). In addition, the extrusion pressure for the large pores material (MTS-4g), which can be extrapolated from this tendency, is expected to be lower than (see the corresponding cross between brackets on Figure 5). This prediction is in agreement with the fact that this sample does not undergo extrusion in the range of pressure accessible to our device. This clearly demonstrates that the Laplace-Washburn equation is not adequate to describe the pressure threshold for water withdrawal in this set of model materials. Describing the extrusion process as the propagation of a meniscus with a receding contact angle would lead to pore size dependant values of , which are not consistent with the intrusion data on the same samples. To our knowledge, this failure of Laplace-Washburn equation had not been clearly established before for mercury withdrawal, probably because experimental results have not been reported for the intrusion of mercury in model porous materials such as MCM-41.
Another mechanism has then to be considered to explain the extrusion. Taking a pore full of liquid at a given pressure, the creation of the vapor phase has actually to be considered as the first step towards emptying, the second one being the propagation of the resulting menisci. In the range of pore size of our experiments, the propagation stage is clearly not the limiting one. We propose that extrusion is governed by the nucleation of a vapor phase in each pore independently, water withdrawal taking place subsequently through the fast, non-equilibrium propagation of menisci at the pressure for which the nucleation event has occurred.
2.6 Influence of temperature
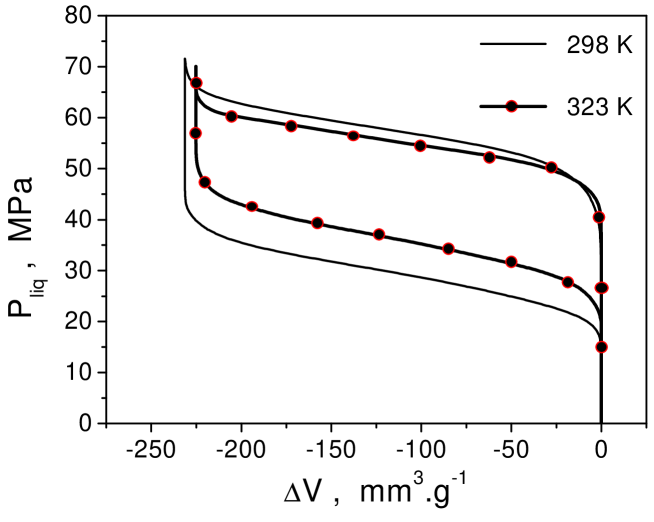
In phase transitions, nucleation processes are thermally activated and therefore highly temperature dependant. A feature arguing in favor of a nucleation mechanism for water extrusion in our system is the behaviour of the intrusion-extrusion cycle when the temperature is changed. Figure 6 shows a plot of the cycle in one sample (MTS-1g), at two different temperatures : K and K. The intrusion pressure at K is slightly lower than at ambiant temperature. This shift is quantitatively consistent with the temperature variation of the water surface tension. In contrast, the extrusion pressure increases significantly with temperature : MPa at 298 K and at 323 K. This temperature shift of the extrusion pressure is much more important than the one observed on the intrusion pressure. The high sensitivity of the extrusion pressure to temperature confirms the hypothesis of a nucleation mechanism for this process.
3 Modelling the nucleation path
In order to develop a quantitative understanding of the nucleation process of a vapor phase in the hydrophobic MCM41, we calculate in this section the energy barrier to overcome for creating a critical vapor nucleus in a hydrophobic cylinder. The words ”vapor” and ”hydrophobic” are used here only for convenience ; the calculation describes more generally the formation of a wetting phase in a cylinder filled with the non-wetting phase. The only limitation is that the contact angle must have a finite value : the situation of perfect wetting with a wetting film adsorbed at the wall is not described here. This calculation uses a relatively simple macroscopic model based on classical capillarity. This is justified for comparison with the experiments since the macroscopic law of capillarity has been shown to describe quantitatively the intrusion pressure.
Let us consider a pore of radius . The interfacial tensions between the solid boundary, vapour and liquid will be, as usual, denoted by , and . The chemical potential of the fluid molecules is fixed at some imposed value . According to classical thermodynamics, liquid-vapour coexistence inside the pore is possible when the pressure difference between the liquid and the solid, , verifies Kelvin’s equation [28] :
| (4) |
Alternatively, can be replaced by where is the contact angle of the liquid on the solid surface. For water on an hydrophobic substrate, , and the pressure inside a vapour ’meniscus’ is lower than in the surrounding fluid.
In the grand-canonical ensemble, a critical nucleus corresponds to a saddle point of the grand potential. The grand potential of a pore filled with liquid can be written as
| (5) |
while the potential of a pore partially filled with vapor is
| (6) |
. Here (resp. ) is the volume of liquid (resp. vapor) phase () and , , are the solid-liquid, solid-vapor and liquid-vapor surface areas. With these notations, the excess grand potential for a pore containing a vapor nucleus can be expressed as
| (7) |
In order to determine the shape of the critical nucleus, it will prove convenient to introduce reduced quantities, by using , and as units of length, area and volume, respectively. Using , , , one obtains:
| (8) |
where and is Kelvin’s radius. Coexistence takes place when , and a a pore filled of liquid becomes metastable when .
3.1 Cylindrical critical nucleus : the annular bump
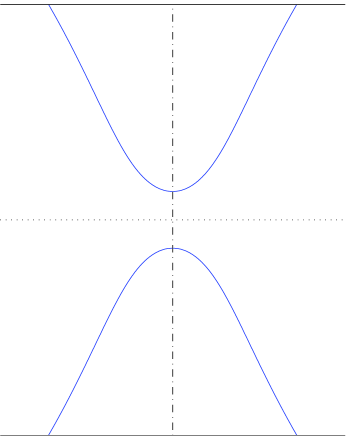
In view of the cylindrical symmetry of the problem, it is natural to investigate first nucleation paths that preserve this symmetry. The shape of a cylindrically symmetric vapour nucleus can be described by a function , as shown in figure 7.

Using the reduced variables and , the expression for the excess grand potential can be written as:
| (9) |
The shape of the nucleus is obtained by solving the Euler-Lagrange equation . This gives the mechanical and contact equilibrium in terms of the local curvature and of the contact angle as [29]:
| (10) | |||
| (11) |
Using the boundary condition (11), the second order differential equation (10) can be integrated once, which yields:
| (12) |
At , : the profile has a tangent parallel to the cylinder axis, and the critical nucleus displays an annular shape. The profile can be explicitly written as
| (13) |
which can be integrated numerically or by using special functions (cf. fig. 8). The reduced energy barrier is obtained from equation (8). Under equilibrium conditions, and the meniscus is the classical spherical cap.
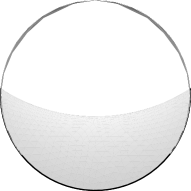
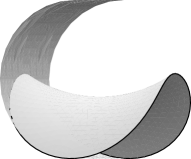
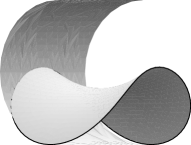
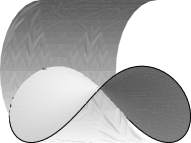
3.2 Nucleation of a bubble in contact with the wall
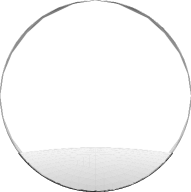
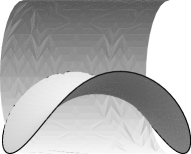
A second nucleation path is proposed without taking into account cylindrical symmetry. It consists in the growing of a vapor bubble on the cylindrical wall, that eventually occupies the whole width of the cylinder and forms two spherical menisci. To determine surface and volume energies along such a nucleation path we have to determine the shape of the asymmetric bubble as a function of volume. This shape is determined by a minimization of the total energy, which implies mechanical equilibrium at each point. This is a complex variational problem, that can only be tackled numerically. We have used the Surface Evolver code, which provides an efficient way of solving this type of variational problems. The resolution is based on a discretisation of the surfaces using triangular facets [30]. Energies are obtained using surface and line integrations. Using a gradient method, Surface Evolver yields the shape of minimal surface energy for a given volume.
For a bubble in contact with the pore wall, the surface is made of liquid vapor interface of tension and solid vapor interface of tension :
| (14) |
For numerical stability, the solid-liquid interface is removed from the code and surface energy is substituted by a line energy of the three phase line using the Stokes theorem :
| (15) |
with and being a vector field with zero divergence (, that reduces to the normal vector for points on the solid liquid surface. In the same spirit, the volume integral is first reduced to surface integrals using the Ostrogradski theorem:
| (16) |
and likewise replaced by a contour integral as :
| (17) |
Results are presented in figures 9 and 10. On each picture, one can check that contact angle is equal to .
 |
 |
 |
 |
 |
 |
 |
 |
 |
 |
 |
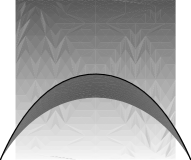 |
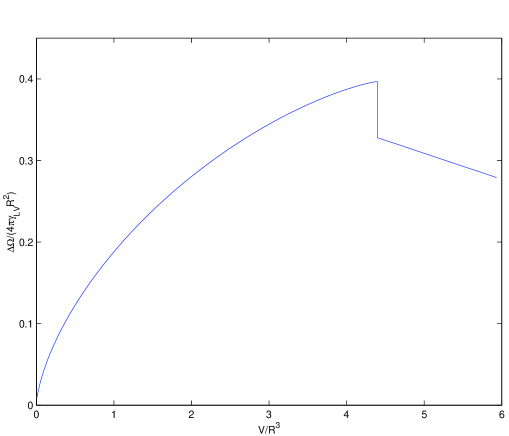
The reduced excess grand potential, along the nucleation path obtained from equation 8, is plotted in figure 11. For a maximum value of the volume, the vapour bubble becomes unstable and a change of topology is observed, with formation of a vapour cylinder occupying the whole cylinder width and limited by two spherical caps. The energy barrier along this path is obtained for the maximum value of the bubble energy, which is reached at this stability limit. The critical nucleus corresponds in this case to the unstable endpoint in a family of bubble like surfaces.
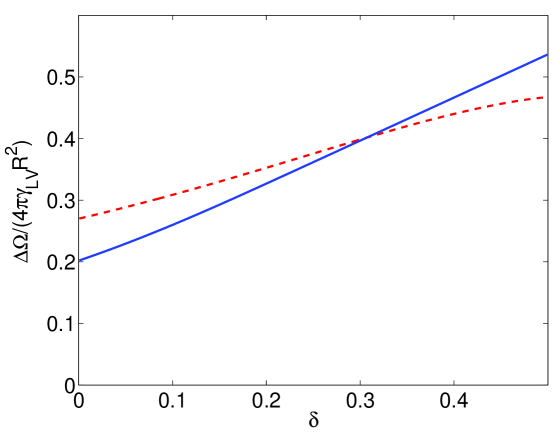
A comparison of the reduced energy barriers for the two nucleation mechanisms is presented in figure 12, for . Depending on the value of , the asymmetric nucleation path (low delta, i.e. high metastability) or the annular nucleus (low metastability) is favoured.
3.3 An approximate expression for the energy barrier of nucleation
Figure 13 gathers the numerical results for the energy barrier obtained for various values of the contact angle, as a function of . For each value of , only the energy barrier corresponding to the more favourable configuration (bubble or annular bump) is represented.
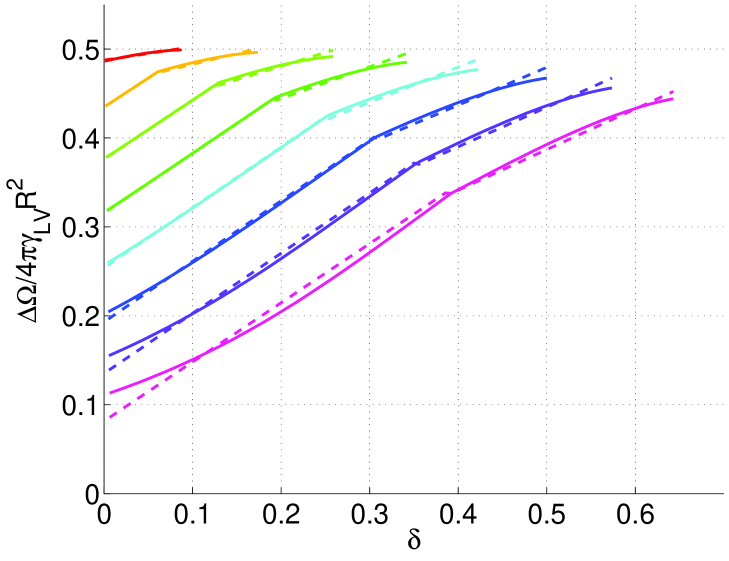
A good approximation for estimating the reduced energy barrier is to write it as a piecewise linear function of the dimensionless parameter . In this approximation, is written in the form
| (18) |
where and are functions only of the contact angle and of the shape of the nucleus (bubble, , or cylindrical, ) and do not depend on the size of the capillary. The relative error made by using approximation 18 instead of the actual value of the energy barrier is at most for values of ranging between and . Numerical values for and in this range of contact angle are given in table 3 for various contact angles.
It is of interest to notice that equation 18 if of the general form that would be obtained if the critical nucleus was keeping a constant shape when the radius of the capillary is varied. It is easily seen from equation 8 that if this were the case, the resulting energy barrier would be of the form , with a dimensionless function. Equation 18 is of this form, being moreover closely approximated by a linear function.
| 95.0000 | 4.06 | 0.94 | 6.16 | 6.13 | 11.85 | 12.56 |
| 100.0000 | 4.11 | 1.51 | 5.46 | 5.77 | 12.00 | 12.56 |
| 105.0000 | 4.17 | 1.93 | 4.73 | 5.27 | 12.16 | 12.56 |
| 110.0000 | 4.22 | 2.24 | 3.97 | 4.68 | 12.28 | 12.56 |
| 115.0000 | 4.27 | 2.49 | 3.19 | 4.04 | 12.38 | 12.56 |
| 120.0000 | 4.28 | 2.67 | 2.42 | 3.35 | 12.43 | 12.56 |
| 125.0000 | 4.25 | 2.79 | 1.70 | 2.67 | 12.46 | 12.56 |
| 130.0000 | 4.18 | 2.87 | 1.02 | 1.99 | 12.48 | 12.56 |
4 Comparison between theoretical and experimental results
In the usual theory of thermally activated nucleation, the number of critical nucleus created per unit time and unit volume (here unit length) in the system writes
| (19) |
The prefactor of this Arrhenius law includes
a microscopic length and a microscopic time
whose value can depend on the pore size but in a much
weaker way than the exponentiel factor. Hence the essential variation
in the nucleation rate comes from this exponential
factor. Experimentally, the transition is observed when the
probability of creation of a critical nucleus in an average capillary of
length over an experimental time becomes unity, i.e. .
This occurs for a rather well defined value of the energy barrier
.
Neglecting the variation of the microscopic
prefactors and with temperature and pore size,
the theory and the experiment will be in good agreement if
i) the model reproduces the experimental value of the extrusion
pressure for various temperatures and pore sizes using a single
value of , and
ii) the numerical value of
lies in the range of the expected order
of magnitude of the prefactor .
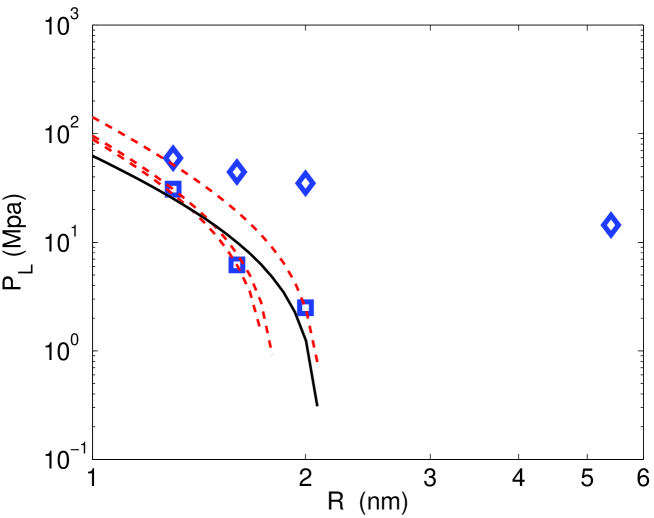
In figure 14 the dotted lines show the plots of the theoretical extrusion pressure as a function of the pore size obtained in our model by assuming that extrusion takes place at a constant value of . In this calculation we have used equation 18 to obtain the value of that results in the desired , assuming and . One sees that for a given value of , the theoretical extrusion pressure decreases extremely quickly with increasing pore radius. This variation is much more rapid than for the intrusion pressure, and is even stronger than the one observed experimentally for the extrusion pressure. The model thus provides the correct qualitative tendency but no quantitative agreement with experiment. The disagreement can be quantified by computing the values of the energy barrier needed to provide the measured values of the extrusion pressure. Using equation 18 we have calculated for each experimental extrusion data point (, ). The resulting values of are , and for samples MTS-1g, MTS-2g and MTS-3g respectively. It is seen that that the nucleation model is much better than the Laplace-Washburn law for describing the extrusion process : the relative variation of the energy barrier obtained for the different data points is only 40% whereas the extrusion pressure varies by one order of magnitude. However the quantitative agreement is not perfect. There is a tendency for the calculated energy barrier to increase with the pore size, which means that the model overestimates the energy barrier for large pores.
It is of interest to point out that this overestimation is present only for the pore size variation of the extrusion pressure. Its variation with temperature seems very well described by the nucleation model. We have calculated the energy barrier of nucleation for the experimental data point corresponding to the sample MTS-1g at (), taking into account the tabulated value of water surface tension at and assuming that the equilibrium contact angle remains unchanged (). We find . We have checked that changing the value of in a range consistent with the intrusion pressure does not modify significantly this energy barrier. This excellent agreement with the value obtained at confirms that the extrusion mechanism in the sample under study is indeed governed by a thermally activated nucleation process.
However, besides failing to describe precisely the pore radius dependency of the extrusion pressure, another drawback of the simple nucleation model expressed by equations 8 and 19 is the high value found for the activation energies. The numerical value of the exponential factor found is about . Taking for microscopic parameters a molecular size and a typical time between molecular collisions s, and for macroscopic parameters an average length of nm for the capillaries and a value of s for the experimental time, one hardly reaches the order of magnitude for the prefactor entering the probability of nucleation. Therefore nucleation should not be observable experimentally for the activation energies found with the calculation.
This is a serious drawback. Of course the range of size under study is close to the nanometer and the use of plain classical capillarity at this length scale may seem a too rough approach. It is however puzzling that classical capillarity works so well to describe the intrusion pressure, and fails to provide reasonable values for the activation energy controlling the extrusion pressure. The fact that the experimental intrusion pressure scales as the inverse of the pore radius shows that the Laplace low of capillarity is not affected by the nanometric range of the pore size. The most natural way to improve the model is then to introduce another macroscopic parameter which has been neglected, i.e. the tension of the three-phase contact line between the free surface of the nucleus and the solid wall. Line tension is a macroscopic thermodynamic parameter similar to surface tension, whose microscopic source is the modification of molecular interaction energies close to a three-phase line. These interactions induce a deviation of the liquid-vapor interface from the macroscopic shape it would have if only surface tension were taken into account, and results in an excess energy which scales extensively with the system size i.e. with the length of the contact line. Line tension effects are usually neglected in classical capillarity when dealing with large systems. A crude argument for this is that the ratio of line tension to surface tension has the dimension of a length, and can only be of the order of a molecular size. Hence line tension will influence only objects of size comparable to molecular sizes. Based on this argument, an order of magnitude for the line tension can also be constructed by dividing a cohesion energy by a molecular size, yielding .
For nucleation problems which involve an object of size comparable to Kelvin’s radius, line tension effects may however become important. Oxtoby et al [6] have shown indeed that incorporating line tension effects improve significantly macroscopic models for the nucleation in slit pores.
It is important to mention that line tension effects should not change the value of the intrusion pressure in the case of a cylindrical capillary. The reason is that in that particular geometry, the existence of a line energy does not change the contact angle of a spherical-cup meniscus with the solid wall. Therefore, in the case of a model porous medium like MCM41, line tension is expected to affect only the free energy of the critical nucleus and the value of the extrusion pressure, but not the intrusion pressure.
Since there are very few data available for the values of line tension, we choose to treat it as an adjustable parameter . For the simplicity of calculations, we make use of two extra hypothesis for incorporating line tension in our model. The first one is to assume that the shape of the critical nucleus does not depend on the value of the line tension. This amounts to neglect the variation of the contact angle with the line tension. This variation would be a second order effect here and can be neglected in a first estimation. With this first hypothesis, incorporating the line tension contribution to the energy barrier is very simple. One adds to the energy barrier calculated in section 3 the free energy of the three-phase line of the critical nucleus. The length of this three-phase line can be calculated from the shape of the critical nucleus found in section 3. We find that its reduced value varies slightly with the pore radius (see figure LABEL:errorplotcomp, which gathers the maximum range of variation of the reduced length of the critical nucleus contact line for several values of the contact angle). As a second hypothesis, we neglect this variation and consider that the length of the contact line entering in the energy barrier is , where the constant depends only on the contact angle and on the shape of the nucleus . The values of are listed in table 3, as well as the maximum relative error induced by this assumption. Using approximation 18, the energy barrier for nucleation in presence of line tension effects writes simply :
| (20) |
The procedure we use to compare this expression to the experimental data is to treat (the value of the barrier for which extrusion is observed) and as two adjustable parameters and fit equation 20 against the three experimental data points () obtained for the three samples in which extrusion is observed. We then plot in figure 14 the curve derived from equation 20 with the value of and obtained from the fit. This curve represents the theoretical prediction for the extrusion pressure, which takes place for each sample at the same value of the activation energy. One can see that the nucleation model with line tension accounts reasonably well for experimental data, considering the approximations made. The optimal value for the line tension is , which is a realistic order of magnitude [31]. The sign of this tension is negative, which explains that nucleation occurs relatively more easily in small pores than expected. We have no explanation based on microscopic arguments on why should be negative in this particular system, but we note that negative have already been reported previously [6, 31]. Finally, the value found for the energy barrier with the line tension effect is . This value is quite reasonable. Using as above the estimates s and for the microscopic parameters in equation 19, a probability of nucleation equal to 1 in a channel of length nm is obtained after a macroscopic time of .
5 Conclusion
In this paper, we have presented a combination of experimental and theoretical approaches to describe the intrusion/extrusion cycle of a nonwetting liquid (water) in an ”ideal” hydrophobic porous material, made of parallel cylindrical pores. The situation is somewhat similar to the more standard case of capillary condensation of a wetting liquid in a porous material, with intrusion taking place at a pressure higher than the bulk coexistence pressure.
The intrusion data can be well accounted for by using standard capillarity theory, with an intrusion pressure that scales as the inverse of the pore radius. The advancing contact angle obtained is close to , which is perfectly reasonable for this type of materials, and suggests that the intrusion branch is close to equilibrium.
The description of the extrusion process is somewhat more difficult. Our data suggests that a description similar to that of the intrusion branch, but using a receding contact angle, is not appropriate. Rather, it appears that the limiting step in the extrusion process is the nucleation of the wetting phase (here the vapour) that we describe using standard nucleation theory. The free energy barrier for nucleation is calculated using a standard capillary description, allowing for various shapes of the critical nucleus. The experimental data is analyzed by assuming that extrusion occurs at a fixed value (relative to ) of the energy barrier. This allows a quantitative comparison between predicted and measured extrusion pressures, as a function of pore radius. When line tension effects are neglected, the theory cannot account for the experimental data, and predicts nucleation barriers that are far too large. However, inclusion of a negative line tension as an adjustable parameter results in an excellent agreement between nucleation theory and experiment. The optimal value of the line tension is in reasonable agreement -as far as order of magnitude is concerned- consistent with values obtained using completely different approaches [31]. Our work confirms the importance of line tension effects on some aspects of capillary phenomena at the nanometer scale, and provides an independent estimate of the line tension.
Two predictions of the present model remain to be tested experimentally. According to figure 14, the extrusion pressure should vanish for pores of radius larger than 2-3nm. This is consistent with our result that no extrusion is observed for a sample with nm, but samples with intermediate radius values would be needed to confirm the theory. On the small pores side, our calculation predicts that extrusion pressure should equal intrusion pressure for . Hysteresis should vanish for such small pores, for which however the validity of the macroscopic analysis may become questionable.
Acknowledgements
We are indebted to T. Martin, C. Biolley, A. Galarneau, D. Brunel, F. Di Renzo, F. Fajula (Laboratoire des Matériaux Catalytiques et Catalyse en Chimie Organique, Montpellier, France) for providing us with the materials and for fruitful discussions as well as to R. Denoyel (Centre de Thermodynamique et Microcalorimétrie, Marseille, France). We also thank G. Thollet (Groupe d’Etudes en Métallurgie Physique et Physique des Matériaux, Lyon, France) for TEM images. B. Lefevre and A. Saugey are supported by the French Ministry of Defense (DGA).
Références
- [1] J.N. Israelachvili. Intermolecular and Surface Forces. Academic Press, 1985.
- [2] E. Kierlik, P.A. Monson, M.L. Rosinberg, L. Sarkisov, and G. Tarjus. Physical Review Letters, 87:055701, 2001.
- [3] V. A. Eroshenko, R. C. Regis, M. Soulard, and J. Patarin. Energetics: a new field of applications for hydrophobic zeolites. J. Am. Chem. Soc., 123:8129–8130, 2001.
- [4] J. S. Beck, J. C. Vartuli, W. J. Roth, M. E. Leonowicz, C. T. Kresge, K. D. Schmitt, C. T. W. Chu, D. H. Olson, E. W. Sheppard, S. B. McCullen, J. B. Higgins, and J. L. Schlenker. J. Am. Chem. Soc., 114:10834, 1992.
- [5] F. Restagno, L. Bocquet, and T. Biben. Physical Review Letters, vol. 84:pp 2433–2436, 2000.
- [6] V. Talanquer and D.W. Oxtoby. Journal of chemical physics, 114:2793, 2001.
- [7] P.G. Bolhuis and D. Chandler. Journal of chemical physics, 113:8154, 2000.
- [8] K. Lum, D. Chandler, and J.D. Weeks. Journal of physical chemistry B, 103:4570, 1999.
- [9] K. Lum and A. Luzar. Physical Review E, 56:6283, 1997.
- [10] A. Wallqvist, E. Gallicchio, and R.M. Levy. Journal of physical chemistry B, 105:6745, 2001.
- [11] K. Hanna, I. Beurroies, R. Denoyel, D. Desplantier-Giscard, A. Galarneau, and F. Di Renzo. J. Colloid Interface Science, 252:101, 2002.
- [12] S. Brunauer, P. H. Emmett, and E. Teller. J. Am. Chem. Soc., 60:309–319, 1938.
- [13] J. C. P. Broekhoff and J. H. d. Boer. J. Catal., 10:377, 1968.
- [14] P. I. Ravikovitch and A. V. Neimark. Stud. Surf. Sci. Catal., 129:597, 2000.
- [15] A. Galarneau, D. Desplantier, D. Dutartre, and F. di Renzo. Microporous Mesoporous Mater., 27:297, 1999.
- [16] T. Martin, A. Galarneau, D. Brunel, V. Izard, V. Hulea, A. C. Blanc, S. Abramson, F. Di Renzo, and F. Fajula. Stud. Surf. Sci. Catal., 135:29, 2001.
- [17] B. Lefevre, P. F. Gobin, T. Martin, A. Galarneau, and D. Brunel. Mat. Res. Soc. Proc., 726(Q11.9.6), 2002.
- [18] I. Rustamov, T. Farcas, F. Ahmed, F. Chan, R. LoBrutto, H. M. McNair, and Y. V. Kazakevich. J. Chromatogr. A, 913:49, 2001.
- [19] A. Y. Fadeev and S. M. Staroverov. J. Chromatogr., 447:103–116, 1988.
- [20] B. Lefevre, E. Charlaix, P. F. Gobin, P. Perriat, and J.F. Quinson. Second international conference on silica science and technology, silica 2001. Proceedings Cd-Rom, Mulhouse, France, 2001.
- [21] B. Lefevre. PhD thesis n¡ 02ISAL0054, University Lyon 1 / INSA, Lyon, France. 2002.
- [22] V. A. Eroshenko and A. Yu. Fadeev. Russian Journal of Physical Chemistry, 70(8):1380, 1996.
- [23] A. Y. Fadeev and V. A. Yaroshenko. Wettability of porous silicas chemically modified with fluoroalkylsilanes according to data on water porosimetry. Colloid J., 58:654–657, 1996.
- [24] A. Y. Fadeev and V. A. Eroshenko. Mendel. Chem. J., 39(6):109, 1997.
- [25] V. A. Eroshenko and A. Yu. Fadeev. Colloid Journal, 57(4):446, 1995.
- [26] V. Y. Gusev. Langmuir, 10:235, 1994.
- [27] F. Gomez, R. Denoyel, and J. Rouquerol. Langmuir, 16:4374, 2000.
- [28] J.S. Rowlinson and B. Widom. Molecular Theory of Capillarity. Oxford University Press, 1989.
- [29] P. Kralchevsky and K. Nagayama. Particules at Fluid Interfaces and Membranes. Elsevier, 2001.
- [30] K.A. BRAKKE. Surface evolver manual. code available at http://www.susqu.edu/facstaff/b/brakke/evolver/evolver.html, 1999.
- [31] T. Pompe and S. Herminghaus. Physical Review Letters, vol. 85:pp 1930–1934, 2000.