Self-diffusion in dense granular shear flows
Abstract
Diffusivity is a key quantity in describing velocity fluctuations in granular materials. These fluctuations are the basis of many thermodynamic and hydrodynamic models which aim to provide a statistical description of granular systems. We present experimental results on diffusivity in dense, granular shear flows in a 2D Couette geometry. We find that self-diffusivities are proportional to the local shear rate with diffusivities along the direction of the mean flow approximately twice as large as those in the perpendicular direction. The magnitude of the diffusivity is where is the particle radius. However, the gradient in shear rate, coupling to the mean flow, and strong drag at the moving boundary lead to particle displacements that can appear subdiffusive or superdiffusive. In particular, diffusion appears to be superdiffusive along the mean flow direction due to Taylor dispersion effects and subdiffusive along the perpendicular direction due to the gradient in shear rate. The anisotropic force network leads to an additional anisotropy in the diffusivity that is a property of dense systems and has no obvious analog in rapid flows. Specifically, the diffusivity is supressed along the direction of the strong force network. A simple random walk simulation reproduces the key features of the data, such as the apparent superdiffusive and subdiffusive behavior arising from the mean velocity field, confirming the underlying diffusive motion. The additional anisotropy is not observed in the simulation since the strong force network is not included. Examples of correlated motion, such as transient vortices, and Lévy flights are also observed. Although correlated motion creates velocity fields which are qualitatively different from collisional Brownian motion and can introduce non-diffusive effects, on average the system appears simply diffusive.
I Introduction
I.1 Overview
Despite the prevalence of granular materials in nature and industry, a coherent understanding of granular flows is still lacking. Particularly in dense systems, features such as jamming, shear bands, and the coexistence of solid- and liquid-like regions make it difficult to offer a simple theoretical description. Fluctuations in both the force network and particle velocities can be of the same magnitude as the mean values and are known to be important aspects of the microscopic behavior of dense granular flowsHowell.ea:99:Fluctuations . Due to the complexity of these systems, one of the key goals of current research is to develop a statistical description of steady state behavior, such as a thermodynamic or hydrodynamic model. Fundamental to statistical approaches is understanding the mean fluctuating part of particle motion, which is described by a granular diffusivity.
Sheared granular systems have received considerable attention recently Mueth.ea:00:Signatures ; Losert.ea:00:Particle ; Howell.ea:99:Fluctuations as an important example of granular flow. Diffusion, in particular, has been studied in a variety of granular systems, such as vibrated grains Barker.ea:93:Transient ; Wildman.ea:99.Self , tumblers Seymour.ea:00:Pulsed ; Hill.ea:03:Structure , chute flows Hsiau.ea:93:Shear ; Menon.ea:97:Diffusing ; Natarajan.ea:95:Local , and sheared systems Hsiau.ea:99:Fluctuations ; Hsiau.ea:02:Stresses ; Hunt.ea:94:Particle ; Makse.ea:01:Thermodynamic ; Radjai.ea:02:Turbulent ; Savage.ea:93:Studies ; Garzo.ea:02:Tracer ; Campbell:97:Self ; Latzel.ea:03:Comparing , but these studies have predominantly focused on rapid flow regimes. Understanding slow, high density, flow is not trivial Campbell:97:Self ; there is no replacement at the fundamental level for collisionally based kinetic theories that are expected to apply only in the dilute rapid flow regime.
In this paper, we characterize the self-diffusivity of grains in a 2D Couette shearing experiment by studying individual particle trajectories over time. In contrast to most previous results, we focus on quasistatic dense flows. In this regime, since particles are constantly in contact with their neighbors, interactions are not collisional and material flow is largely confined to a shear band with a nominal thickness on the order of 5 particle diameters.
Several observations from the present experiments are noteworthy: 1) We find that particle diffusivity is proportional to the local shear rate, with diffusivities approximately twice as large along the mean flow direction as the perpendicular direction. 2) We show that unlike rapid flows, the anisotropic force network induces a substantial anisotropy in the diffusivity. This is in addition to the usual anisotropy induced by the direction of mean flow. 3) Care must be taken when calculating diffusivities in a shear gradient Sierou.ea:03:Shear , as motion can appear to be subdiffusive or superdiffusive due to a gradient in the shear rate or Taylor dispersion Taylor:53:Dispersion . We show through a simple Fokker-Planck model that apparent sub- or super-diffusive behavior can be attributed to shear gradient and boundary effects. 4) Hence, the grain motion is statistically consistent with a simple random walk in the presence of shear gradients. 5) Nevertheless, at larger spatial scales, we occasionally observe correlated motion and Lévy flights. But these events are rare and do not have a significant impact in the mean.
I.2 Models for Granular Diffusion
In the kinetic theory approach, a granular temperature is often defined as T , with instantaneous particle velocity and mean velocity , in which the velocity fluctuations contribute to a temperature in analogy with molecular gases.
A different approach was recently proposed by Makse and Kurchan, who applied uniform shear in a numerical experiment and measured diffusivity and mobility to define a temperature by analogy with fluid systems Makse.ea:01:Thermodynamic . In their model, they report that the law (thermal equilibration) is satisfied in a bidisperse mixture, supporting the thermodynamic picture. This is in contrast to experimental measurements of kinetic granular temperature which find a lack of equipartition when different types of particles are present Feitosa.ea:02:Breakdown ; Wildman.ea:02:Coexistence .
Isotropic Brownian diffusion in an unbounded system is often characterized by the time evolution of the second moments of a probability distribution function (PDF). For example,
| (1) |
where is the particle position relative to its initial position ( for a small time step ), is the diffusivity, and is time.
More generally, diffusion must be described by a tensor. For instance, diffusivities along the flow direction in granular gases are in general different from transverse diffusivities Garzo.ea:02:Tracer ; Hsiau.ea:02:Stresses ; Campbell:97:Self .
Diffusion in even a simple shear flow is complicated by Taylor dispersion effects Taylor:53:Dispersion , in which diffusive motion couples to the mean flow leading to larger dispersion along the flow direction, as recently elucidated in systems of noncolloidal particles Sierou.ea:03:Shear . In this case, is nonlinear in time, i.e. it contains higher order corrections due to the coupling of the shear to the diffusive motion. Simply subtracting the mean flow from particle trajectories and computing diffusivities does not give accurate results in this system Sierou.ea:03:Shear .
In particular, for flow of the form , i.e. uniform unbounded shear flow in two dimensions in which there is a constant shear rate creating a velocity gradient in the direction, the second order moments are given by Elrick:62:Source ; Sierou.ea:03:Shear :
| (2) | |||||
| (3) | |||||
| (4) |
These equations describe an ensemble average of particle positions relative to the particle’s initial location (i.e. ((x(0), y(0)) = (0,0)), without subtracting the mean flow.
These relations follow naturally for a PDF described by Brownian anisotropic diffusion with mean local flow as above, and a diffusion tensor, , with elements , and where
| (5) |
Here, corresponds to the streamwise direction and is perpendicular to . The left hand sides of Eq. 2-4 correspond to the , , and moments of .
The higher order terms in Eq. 4 are due to Taylor dispersion. For instance, the term arises because diffusive motion along moves grains to regions of different mean velocity which tends to increase their separation or dispersion along the direction. These higher order terms contribute to mean squared displacements which therefore appear superdiffusive.
It must be emphasized that equations 2-4 are derived assuming that the diffusivities and shear rate are constant in space and time over an infinite plane. This condition is not met in the current experiment which changes the specific form of the correction terms.
Several issues concerning a diffusive picture must be addressed for sheared dense granular materials to determine whether Brownian diffusion applies. Two of these issues are the presence of a shear band and the limiting boundary at the shearing surface. Even assuming that a diffusive description is applicable, it remains to be determined on what temporal or spatial scales such a description should apply. In dense quasistatic flows, grains are generally close to a jammed state in which particles are in constant contact. Motion of grains requires the creation of voids, so correlated motion might be expected to be particularly important in dense 2D systems where paths are constrained. Short-lived vortex structures have been seen in 2D granular simulations Radjai.ea:02:Turbulent and experiments on 2D shearing of foamsDebregeas.ea:01:Deformation . These are potential deviations fom Brownian diffusive behavior which might affect the time evolution of the moments.
I.3 Previous Measurements and Simulations
The full diffusion tensor has been measured in granular gases using kinetic theory Garzo.ea:02:Tracer , simulations of rapid granular shear Campbell:97:Self , and shearing of non-colloidal suspensions Breedveld.ea:02:Measurement .
Substantial work on granular diffusivity in rapid flows has been done by Hsiau and coworkers who have measured self-diffusion coefficients in a variety of granular systems Hsiau.ea:93:Kinetic ; Hunt.ea:94:Particle ; Hsiau.ea:99:Fluctuations ; Hsiau.ea:02:Stresses . They find that fluctuations are anisotropic, with the largest fluctuations along the flow. Diffusivities are found to increase with shear rate and depend on the square root of the granular temperature T in agreement with kinetic gas theory. Other results in a similar chute flow were subsequently presented by Natarayan et al.Natarajan.ea:95:Local .
Losert et al. studied a 3D fluidized Couette experiment Losert.ea:00:Particle , in which velocity fluctuations were found to be slightly larger in the direction along the mean flow. These fluctuations decrease roughly exponentially far from the inner cylinder, but decrease more slowly than the average velocity.
Radjai and Roux studied particle velocity fluctuations in numerical simulations under homogeneous strain in which there was no shear band formation Radjai.ea:02:Turbulent . They measured anomalous diffusion with an exponent of 0.9 (rather than 0.5 for ordinary diffusion) which they attributed to long-time configurational memory of a granular medium in quasistatic flows.
Diffusivities have also been measured in a 3D rotating tumbler Seymour.ea:00:Pulsed ; Hill.ea:03:Structure , 2D swirling flow Scherer.ea:96:Swirling , chute flow Menon.ea:97:Diffusing , simulations of shaken spheres Barker.ea:93:Transient , and simulations of small numbers of spheres in suspension Marchioro.ea:01:Shear . Earlier studies primarily addressed rapid flows from kinetic theory Savage.ea:93:Studies .
Although these studies are relevant here, we note that the displacements were assumed to be purely induced by the shear flow and no attempt was made to investigate the role of the force chain network.
I.4 Organization of Presentation
The paper is organized as follows. In Section II, we describe the experimental techniques. We present diffusion measurements in Section III and results from a random walk simulation in Section IV. We show the impact of the anisotropic force network in Section V. We discuss diffusivities determined from the velocity autocorrelation functions in Section VI. In Section VII, we show examples of intermittent vortices and Lévy flight trajectories, and in Section VIII, we draw conclusions.
II Experimental Techniques
The experiment is performed with a 2D Couette apparatus, as sketched in a top view in Fig. 1. The granular material (B) consists of a bidisperse mixture of about 40,000 disks (diameters = 0.42 cm, = 0.50 cm, thickness = 0.32 cm) in a ratio of 3 small : 1 large. The bidisperse mixture is used to inhibit crystalline ordering of the disks. The disks lie flat on a Plexiglas sheet bounded by an outer ring ( 51 cm)(C) and an inner shearing wheel ( 20.5 cm) (A). A Plexiglas sheet covers the experiment to protect the experiment from external perturbations, but the sheet does not contact the particles. The shearing wheel is rotated at a frequency of 0.1-10.0 mHz or a speed of cm/s at the shearing surface. The experiment is initially run for at least one revolution of the shearing wheel in order to avoid effects from transients, an issue that will be addressed in another paper Utter.ea:03:Transients . The shearing wheel and the outer ring have teeth with gaps comparable to the size of the smaller particles.
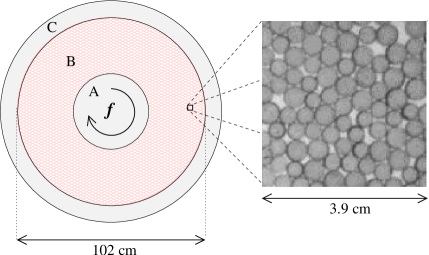
The system is lit from below and observed from above using a 2 megapixel CCD camera at a frame rate of up to 7.5 Hz. Sequences of approximately 1500 images are analyzed to determine particle trajectories. Disks within about 20 particles diameters of the shearing wheel are marked with lines, thus allowing us to track particle position and orientation and to identify particles by size. Approximately 4000 grains are typically in the field of view, of which 2500 are marked. Images are threshholded and the orientation and position of lines on the disks are found. Sufficient temporal resolution is used such that each particle in a frame can be connected with the closest grain in the subsequent frame to establish particle trajectories.
The force network can also be visualized since the grains are made of a photoelastic material PSM4 . When polarized light travels through the disks, it experiences a phase shift (birefringence) proportional to the difference in principle stresses . When the disks are illuminated between crossed polarizers, grains under larger stress are seen as regions of larger gradients in light intensity. In this way, the force network is visualized as a network of bright lines on a dark background. Additional details were presented by Howell et al.Howell.ea:99:Fluctuations . The polarizers are removed for measuring particle trajectories and diffusivities.
III Diffusion Measurements
III.1 Mean Velocity Profiles
We first consider the mean properties of the flow. In Fig. 2, we show the mean tangential velocity, , versus radial distance from the shearing surface, , where is the distance from the center of the shearing wheel. The velocities are scaled by the velocity of the shearing surface s where is the mean particle diameter (). For this particular run, we used a frame rate of 1.08 Hz, so that the shearing wheel was displaced 0.25 between each of the 1080 images, which, in total, correspond to one revolution of the shearing wheel. The limiting value for of approximately corresponds to the sensitivity of the measurement for a typical number of images and spatial resolution, e.g. for an image resolution of 20 pixels per diameter, a grain displacement of 1 pixel over the entire run would give a mean velocity Hz (or ) and velocities smaller than this cannot be resolved. Motivated by previous results for Couette shear Mueth.ea:00:Signatures ; Veje.ea:99:Kinematics , we fit the data ( 7.5 d) to an exponential ( = 1.071 exp(-0.521 )) and to a gaussian ( = 0.925 exp(-0.284 - 0.0534 )) .
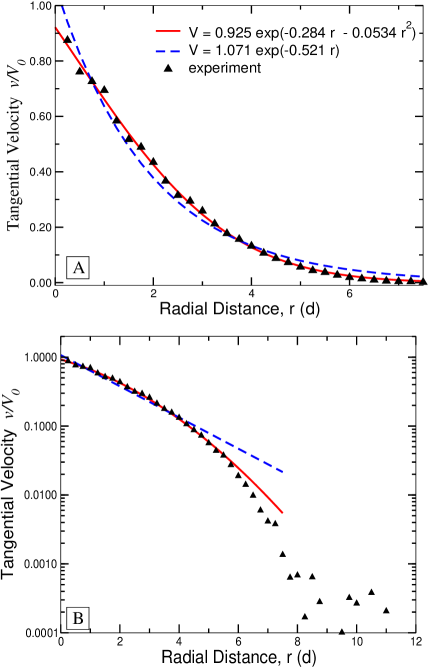
From this individual run, the Gaussian fit seems most appropriate. However, this is an artifact of the data resolution. Additional data with slower frame rates points to an important issue concerning particle tracking velocimetry. If the number of images remains fixed, by taking data using slower frame rates, velocities of slower particles further from the shearing surface can be accurately measured while faster particles at the shearing surface can no longer be accurately tracked. We show these results in Fig. 3 in which the frame rate (t) is varied for different runs at the same imposed shear rate ( = 1 mHz, = 1500). The individual curves are accurate over a particular range of velocities based on the frame rate and number of pictures in the run. In Fig. 3B, we show data for each set within this range. It becomes evident that the velocity profile has an exponential tail which is obscured when simply analyzing a single run. Previous results have shown exponential Latzel.ea:03:Comparing ; Howell.ea:99:Fluctuations , Gaussian Mueth.ea:00:Signatures , and similar strongly decaying Losert.ea:00:Particle velocity profiles for Couette flow. Authors of these studies Mueth.ea:00:Signatures ; Howell.ea:99:Fluctuations have suggested that the differences in measured profiles may depend on whether the flow is 2 or 3D or on whether the particles are rough or smooth. The present data suggest that an additional factor may be spatio-temporal resolution. Particle tracking issues in particular have been addressed recently by Xu et al.Xu.ea:03:Measurement .
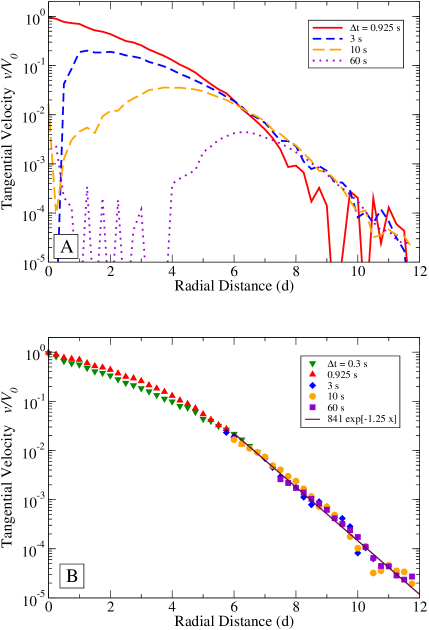
We conclude that correct tracking occurs for velocities that approximately satisfy
| (6) |
where = number of pictures, and the image resolution is 20 pixels per diameter . The lower speed limit is set by image and temporal resolution. The upper limit is chosen to resolve the occasionally fast displacements well above the mean. Note, however, that the upper cutoff is not an issue when the speed of the shearing surface is less than , since generally, all particle displacements can be resolved, e.g. for = 0.3 s and 0.925 s, the requirement that is not necessary.
III.2 Radial and Tangential Diffusivities, and
We measure diffusivities by tracking individual particles, and hence their displacements, over time in both the radial () and tangential () directions. We subtract the mean flow (Fig. 2) from the tangential velocity component at each time step.
Although Eqs. 2-4 characterize absolute and displacements without subtracting the mean flow, they are also predicated on a velocity profile such that which is true for a uniform shear rate in an infinite domain, neither of which are true here. The exponential velocity profile observed in the experiment invalidates this and prevents us from directly comparing to Eqs. 2-4. Deriving the corresponding moment evolution equations with the exponential profile of the velocity and diffusion fields is significantly more complicated and beyond the scope of this paper. Instead, we use a random walk model in Section IV to model the system. Nonetheless, the theory above explains the origin of the Taylor dispersion effects that we observe. In order to avoid the effects of a mean displacement due to the locally varying shear rate, we remove the mean flow. The resulting mean displacement squared is plotted versus time and averaged for different particles initially within the same radial bin (bin size = or ). An initially linear evolution indicates ordinary diffusive behavior with the slope of the line equal to 2.
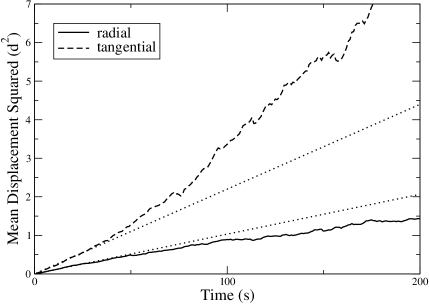
Fig. 4 shows a typical example of the mean displacement squared for the tangential and radial directions for particles in the shear band. Here, the notation reminds us that the mean flow is subtracted from the data. The dotted lines are linear fits for s giving diffusivities proportional to the slopes. The tangential diffusivity is approximately double the radial diffusivity at small times. The former is expected to deviate from a straight line due to the higher order terms similar to those in Eq. 4. Note, however, that for small , the linear term in Eq. 4 dominates, and Taylor dispersion effects are not present.
One might worry that using early times would be inaccurate when diffusivity is generally defined as a long time behavior. In particular, results for more rapid flows show an initial ballistic regime Wildman.ea:99.Self ; Menon.ea:97:Diffusing ; Campbell:97:Self , and significant velocity autocorrelations appear in noncolloidal suspensions Sierou.ea:03:Shear . However, in the quasistatic motion of the present experiment, there is no ballistic behavior because grains are constantly in contact with each other. Moreover, as seen in the velocity autocorrelation shown in Fig. 5, the velocities quickly become uncorrelated. The time for the correlation to reach zero corresponds to a mean relative grain displacement of 0.25 and occurs within 4 seconds for this data. Therefore, diffusivities measured for 5s 30s can be expected to be beyond the correlated regime and are at times before significant Taylor dispersion effects are observed. We show below, using a random walk simulation, that the apparent subdiffusivity of the radial component in Fig. 4 is due to the radial gradient in shear rate, an effect that is not included in Eqs. 2-4 above.
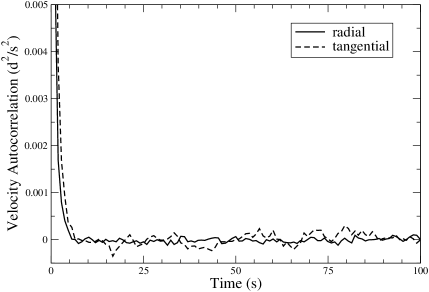
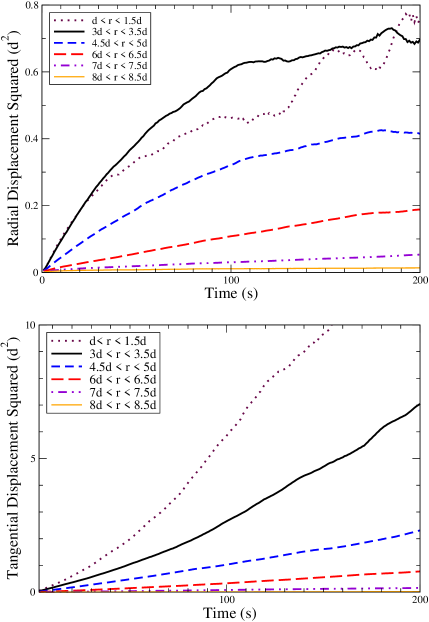
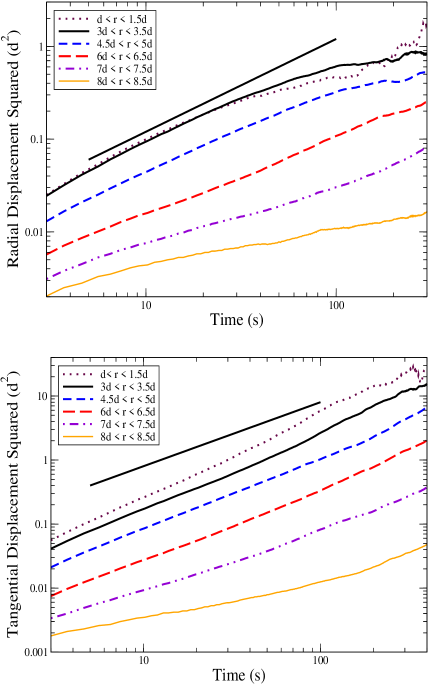
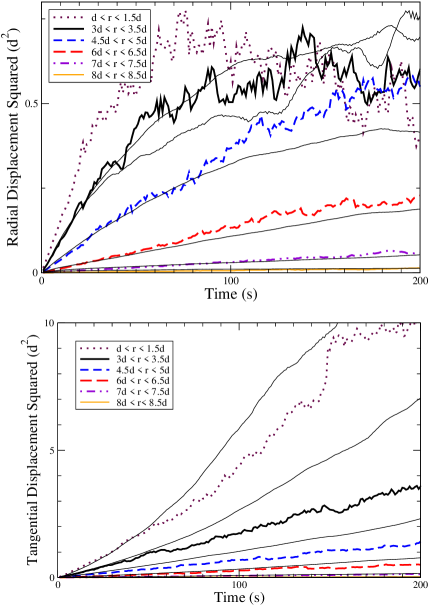
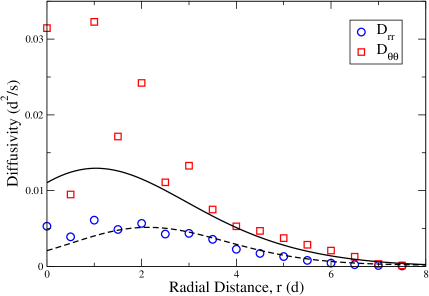
Fig. 6 shows and for particles initially at various distances from the shearing surface. It is evident that the diffusivity is larger close to the shearing surface, i.e. in regions of large shear, as observed previously. In addition, the maximum diffusivity occurs at . The fact that the maximum diffusivity does not occur at is due to non-diffusive motion of particles in contact with the shearing wheel. Since most of these particles () are dragged by the wheel at the same speed and the mean velocity has been subtracted, the fluctuations are smaller. In Fig. 7, we show the RMS displacements versus time on a log-log scale. The solid line shows the expected slope for diffusive behavior.
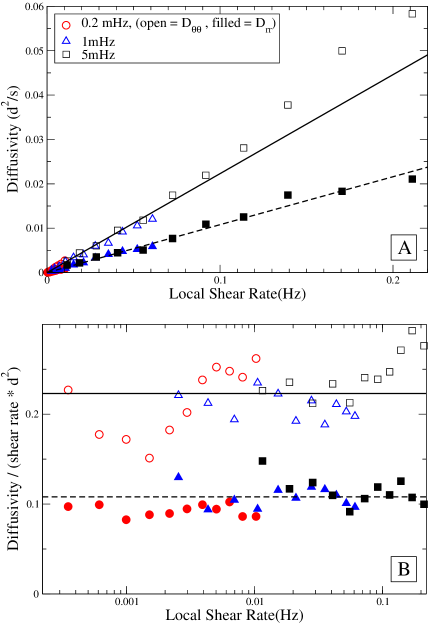
As seen in Fig. 8, the diffusivity is proportional to the local shear rate . For this figure, we use the local shear rate determined from the slope of Fig. 2, and a diffusivity that is half the slope of vs. for 30 s. The decrease in diffusivity at large shearing rate (i.e. close to the shearing surface) is due to particles being dragged by the shearing wheel and hence exhibiting ballistic behavior. For the radial and tangential directions, where is the particle radius, i.e. the scale of the diffusivity is approximately given by . As a consequence of the exponential tail of the velocity profile, the diffusivity also decays roughly exponentially, such that the diffusive motion is effectively confined to the shear band.
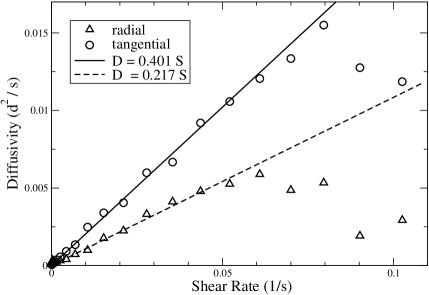
Fig. 9A shows results for diffusivity versus local shear rate () for three different rotation frequencies of the shearing wheel. The diffusivity is approximately proportional to local shear rate over a large range of shearing rates from separate experimental runs, and . In Fig. 9B, the diffusivity at each data point was divided by the local shear rate. The resulting data () is roughly constant over 3 orders of magnitude of shear rate. The lines show fits for tangential diffusivities = 0.223 and radial diffusivities = 0.108 . The data for is noisier than that for since due to the mean flow the magnitude of the tangential motion is much larger than radial motion.
III.3 Off-diaganol Diffusivity
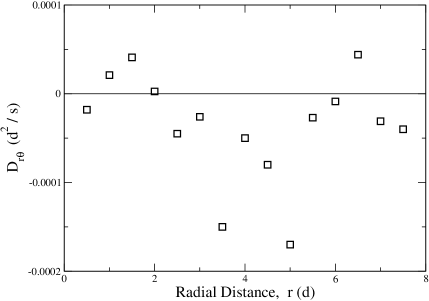
The off-diagonal diffusion constant is shown in Fig. 10. This diffusion coefficient is an order of magnitude smaller than and . Away from the shearing surface, is also negative. This is due to the anisotropic force network and will be addressed below.
IV Random Walk Simulation
As mentioned earlier, direct comparison of the data to Eq. 2-4 is not possible. The fact that and decay exponentially and the presence of the boundary at in the experiment are inconsistent with the assumptions leading to the moment evolution equations in Section I.2. An exact solution of the moment equations with the appropriate boundary conditions and spatial dependence of and is difficult. However, a numerical simulation with appropriate spatial dependence in and using a random walk model is relatively simple.
In this section, we present such a simulation in which we assume diffusive motion and impose an exponential velocity profile and impenetrable inner boundary so as to parallel the experiment. To model radial diffusion, a walker makes a step each time with equal probability along with a radial step length Lr() proportional to , where is the experimentally measured shear rate. That is, Lr() = , where is a constant. This imposes a diffusivity D L(/ () in agreement with Fig. 9. Radial motion is bounded by the shearing wheel, so any step that would move a particle through that boundary is automatically forced to be a step away from the shearing wheel (i.e. towards positive ). Tangential motion is modeled in a similar way. At each time step, the walker is advected at the experimentally measured mean velocity based on its radial position (Fig. 2) and also randomly takes an additional step along with tangential step length Lθ() = ()1/2 This model contains two free parameters, and , corresponding to the magnitude of and . Equivalently, the fit parameters can be thought of as determining an overall scale factor for the data and the ratio of radial to tangential diffusivities. Here, we do not consider additional anisotropies associated with the force chain network.
Fig. 11 shows a mean-square displacement versus time for the simulated data. The experimental data from Fig. 6 is also included for reference as thin solid lines. The simulation is performed assuming ( = 0.48, = 0.66). As noted, the two free parameters set the scale of the radial and tangential displacements. We emphasize that the relative magnitudes of the data at different distances from the shearing wheel and the apparent subdiffusive and superdiffusive behavior at longer times result from the experimentally measured velocity profile.
Although the initial slope of the lines in Fig. 11 is equal to 2, the long time behavior and deviation from a straight line is due to the coupling to the mean flow. The horizontal and vertical scales of Figures 6 and 11 are identical in order to compare the long time behavior. This confirms that the apparent subdiffusion and superdiffusion is due to the mean flow.
In particular, it is clear that the curvature of the data for particles close to the shearing surface, which appeared to be subdiffusive, arises from the gradient in local shear rate. That is, the grains next to the wall diffuse away to a region of slower shearing rate and, once away from the wall, diffuse more slowly. If this gradient is removed from the simulation (i.e. is assumed constant), the lines become straight with approximately the same slope. The presence of a wall ( = 0) also tends to decrease the diffusivity at small , but this is a much less pronounced effect than that of the gradient in shear rate. Note in Fig. 11 that simulated grains close to the shearing wheel show an apparent superdiffusive behavior due to Taylor dispersion.
We note that in the experiment, grains at are generally dragged by the shearing wheel which tends to decrease the apparent radial diffusivity and add to the effects of Taylor dispersion (which accounts for the slight difference in the magnitudes of Fig. 6 and 11). However, Fig. 11 reveals that the dominant effects are the shear gradient and Taylor dispersion. Thus, the main features of the apparent subdiffusive and superdiffusive behavior are observed even though the simulation does not include the effect of ballistic motion due to dragging of particles by the shearing wheel.
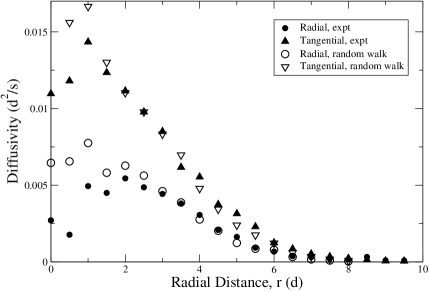
We show the measured diffusivities for the experiment and the random walk simulation together in Fig. 12. There is very good agreement except for , where the simulation overestimates the diffusivity.
V Effects Due to Anisotropic Force Network
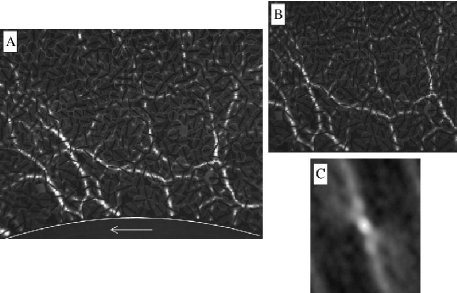
In the previous discussion, we tacitly assumed that the natural coordinate sytem for diffusion measurements is set by the radial and tangential directions, corresponding to the anisotropy of the imposed shear. However, dense systems, unlike dilute rapid flows, have anisotropic force networks due to imposed shear which are in general at a different orientation from the flow direction. This is seen by using the photoelasticity of the grains to image the force chains, as in Fig. 13A. This figure shows a typical case where the force chains are preferentially oriented to oppose the motion of the shearing wheel, at an angle that is intermediate between the and directions. We might expect the minimum diffusivity to be oriented along the mean direction of the force chains. To determine this angle, images such as Fig. 13A can be transformed from polar to cartesian coordinates, such that the shearing wheel is located at y = 0 (Fig. 13B). In this figure, each vertical line corresponds to a radial line in the original image. Since the curvature of the wheel is relatively small, the transformation is not dramatic and distortion of the image is small. A 2D autocorrelation of image 13B, then provides a measure of the mean force chain orientation (13C). The mean angle of the force chains fluctuates strongly in time around a mean value of relative to .
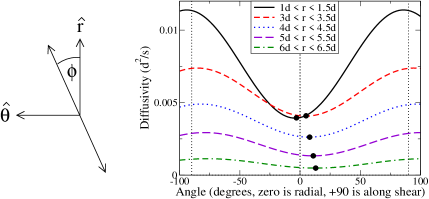
To determine the angular dependence of the diffusive motion, we locally project displacements at each time step onto an axis rotated at an angle from the radial direction, as sketched in Fig. 14. That is, for each step, the displacement is locally parameterized in terms of radial and tangential components (relative to the center of the shearing wheel) and then are locally projected onto an axis rotated by relative to the direction. We then use the components of the trajectories to measure a diffusivity, , along this direction. On the right side of Fig. 14, we show versus for grains at different radial distance . Again, the diffusivities decrease with distance from the shearing wheel. In addition, the direction of minimum diffusivity , marked by the solid circles, changes with distance from the shearing wheel.
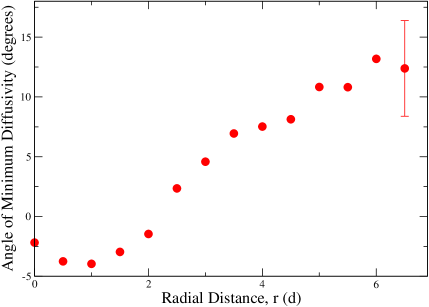
In Fig. 15, we show the angle of minimum diffusivity versus distance from the shearing wheel which we determine by fitting a parabola to in the region . Close to the shearing surface, at high shear rates, the minimum diffusivity is in the radial direction, corresponding to the minimum expected based on the imposed shear direction. At larger distances , the minimum shifts towards the direction of the mean force chain orientation. In other words, outside of the immediate vicinity of the shearing wheel, the anisotropic force network affects particle motion and must be taken into account in order to properly describe the diffusive motion in dense granular systems.
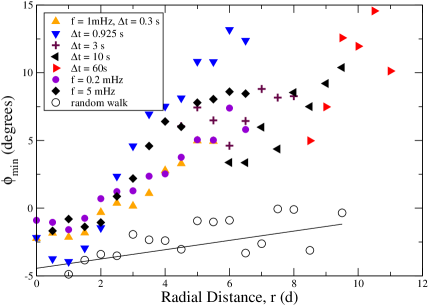
We use the same procedure for deducing the angular dependence of the diffusivity on a number of independent data sets, including the data used to create the velocity profile of (Fig. 3) and on two additional data sets with different shearing rates. We show data in Fig. 16 only for velocities that are properly resolved, as in Fig. 3. Although there is some significant variability from one data set to the next, there is a clear trend in which shifts towards the direction of force chain orientation as increases. When we perform the same analysis on the simulated data, in which there is no force network, does not increase above as indicated by the open circles. The fact that these points are negative is addressed in the following section.
VI Diffusivity and velocity autocorrelation functions
Diffusivities ( and ) can also be determined using velocity autocorrelations from the expression
| (7) |
where the velocity at each time step is simply defined as . The integral must be taken over times long enough to extend beyond the initial correlated region. Thus, for this data,
| (8) |
where we use a cumulative sum of the autocorrelation (Fig. 5). After an initial transient of about 5 s, the curve fluctuates around a constant value. The average of the data well after the transient (85 - 185 s, for this data set) is taken as the diffusivity. Fig. 17 shows the diffusivities determined from the velocity correlations. For the most part, they agree quite well with diffusivities determined from the displacement squared versus time data which are indicated by lines showing fits to the data of Fig. 12. The exception is for tangential diffusivities of particles adjacent to the shearing wheel. This discrepency is due to the fact that that there is some non-negligible correlation in the tangential velocity after s for particles in contact with the shearing wheel.
The off-diagonal diffusivity must be determined using Batchelor:49:Diffusion
| (9) |
which for large can be rewritten as Campbell:97:Self
| (10) |
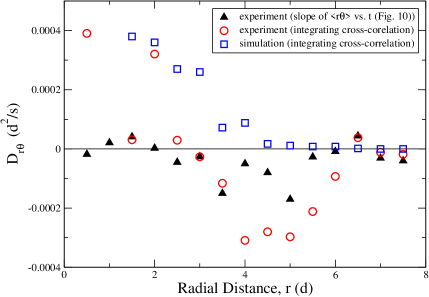
assuming the motion is statistically stationary over time. This reduces to Eq. 7 for the diagonal terms, . The off-diagonal diffusivity, is shown in Fig. 18 along with data determined using the displacement squared versus time plots (Fig. 10). Since the magnitude of is small, the fluctuations lead to larger noise in these results.
Further from the wheel, where the minimum diffusivity shifts to larger angles, the cross-correlation term is negative. This indicates that motion along is anticorrelated with motion along , which agrees with a decrease in diffusivity along positive , and a shift in minimum diffusion angle towards positive . To emphasize the effect of the anisotropic force network, we contrast the experimental results with data from the simulation, where there is no force network effect and is always positive (Fig. 18).
The fact that is positive in the simulation is due to the velocity gradient, an effect that was also observed in previous measurements of the cross-term Garzo.ea:02:Tracer ; Campbell:97:Self ; Breedveld.ea:02:Measurement . Note that a positive in the present data corresponds to a negative in previous results. This difference in sign is due to the fact that the authors of Garzo.ea:02:Tracer ; Campbell:97:Self ; Breedveld.ea:02:Measurement used the convention that increases with . By contrast, we have chosen the natural experimental coordinate sytem such that at the boundary (shearing wheel) and increases into the bulk, i.e. decreases with .
Returning to the present studies, the fact that is positive for the simulation is the origin of the slightly negative seen in Fig. 16. We emphasize that the positive and negative in the experimental data have the opposite sign from the simulation. This difference in sign is due to the presence of the strong force network in the experiments, an effect that is absent in the simulations.
VII Lévy Flights and Vortices
We also observe examples of correlated motion and trajectories similar to Lévy flights Klafter.ea:96:Beyond which could contribute to non-diffusive motion. In fact, the dense 2D packing leads to caging and coordinated motion such that neighboring grains tend to move together. This differs from more dilated flows in which collisions are the source of fluctuating motion. The fact that the present system behaves diffusively on average indicates that long-range correlated motion is sufficiently rare and random over time that the mean behavior is not affected.
It is interesting to ask whether such novel behavior as Lévy flights occur in our system and whether they are important. Lévy flights are random walks in which occasional large steps, or flights, are observed, such that apparent Brownian motion on smaller scales is punctuated by large displacements. They also have the property that the variance of the step size and therefore the diffusivity () are infinite. This situation can be realized if the probability of the walker making a step is given by a power-law where . This is in contrast with gaussian or exponential distributions of in which case large steps are much more rare and the variance is finite.
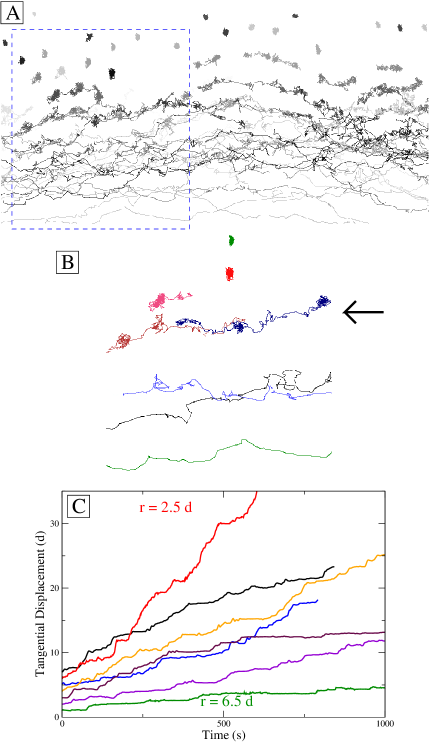
In Fig. 19A, we show trajectories for particles in the shear band. Each line shows the trajectory of a single particle over the same time period (1000 s). Next to the shearing surface (bottom of image), particles travel relatively fast compared to particles outside of the shear band (top of image), which fluctuate around effectively stationary positions. Fig. 19B shows a few particular trajectories from the dashed region of Fig. 19A. At the edge of this band (), we see trajectories that are reminiscent of Lévy flights, in which relatively large displacements occur between periods of fluctuating motion on a smaller scale. To observe this better, in Fig. 19C, we plot tangential displacement versus time for seven trajectories at different distances from the shearing wheel. The data has been smoothed over a 5 s running window. We note that these are not necessarily typical trajectories, but have been chosen to elucidate the presence of Lévy-like behavior. In this plot, regions of small fluctuations (nearly flat lines) are separated by faster jumps along the mean flow direction.
These data can be compared with an example from a rotating flow fluid experiment (Solomon.ea:94:Chaotic, , e.g. Fig. 7) from which similar data were obtained. Although we observe somewhat similar motion, the trajectories in Fig. 19 have a different origin. In the fluid case, particles exhibit flights between periods in which they are trapped by vortices. In the granular system, grains become trapped as they move farther from the shearing surface and remain effectively trapped until they move closer to the wheel. In addition, it is common for local rearrangements involving 10-20 grains to occur intermittently. (A similar effect may also account for the Lévy distributions of trapping times for observations of grains deposited on sand piles levy-sandpile .) With the present data, e.g. Fig. 19, we do not have sufficient statistics to determine whether the trajectories exhibit Lévy scaling because flight-like trajectories are rare.
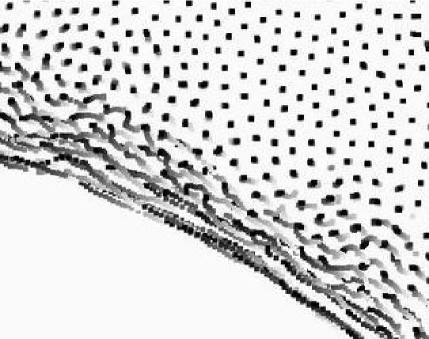
We also occasionally observe cooperative motion as in Fig. 20, which displays particle trajectories over a 25 s window in which the greyscale level indicates time (light grey = early time, dark = later time). In the lower right, there is a region of locally correlated motion. A transient vortex is present in the upper left. Although correlated motion is common, since motion in a dense packing requires motion of neighboring grains, vortices are rare events. In addition, unlike vortices in fluids, there are no inertial effects and granular vortices appear to quickly dissipate without affecting the long time behavior of the grains.
VIII Conclusions
To conclude, we find that granular motion in dense shear flows is diffusive with a self-diffusivity proportional to the local shear rate ( where is the particle radius). However, the diffusion tensor is anisotropic due to underlying anisotropies in both the velocity field and force network. The velocity anisotropy leads to a tangential diffusivity that is about double the radial diffusivity. The anisotropic force network dominates the local diffusivity outside the immediate vicinity of the shearing surface, and leads to a minimum diffusivity approximately along the mean force chain direction. This latter feature has not been observed in more rapid flows, to our knowledge, and is a property of dense granular systems.
Motion can appear subdiffusive due to the decreasing shear rate away from the shearing surface or superdiffusive due to Taylor dispersion effects. A simple random walk model which reproduces the apparent anomalous diffusion indicates that the underlying motion is diffusive. Using the experimentally measured velocity profile, assuming , and choosing an overall multiplicative scale factor, the simulation closely matches the experiment, including the long time behavior which is affected by the gradient in shear rate and Taylor dispersion. The simulation also highlights the effects of the anisotropic force network. Differences in the sign of between simulation and experiment are associated with the anisotropic force network. The same is true for the orientation of the minimum diffusivity . Velocity autocorrelation plots show that motion in dense granular flows quickly becomes uncorrelated and there is not a distinguishable ballistic regime before diffusive behavior dominates.
Examples of correlated motion, such as vortices, and trajectories similar to Lévy flights are also observed. However, these effects are sufficiently intermittent and random that the system behaves diffusively.
Acknowledgement We appreciate a number of very helpful discussions with Prof. John Brady. This work has been supported by the National Science Foundation through grants DMR-0137119, DMS-0204677 and DMS-0244492, and by NASA grant NAG3-2372.
References
- (1) D. Howell, R. Behringer, and C. Veje, Chaos 9, 559 (1999).
- (2) D. Mueth et al., Nature 406, 385 (2000).
- (3) W. Losert, L. Bocquet, T. Lubensky, and J. Gollub, Physical Review Letters 85, 1428 (2000).
- (4) G. Barker and A. Mehta, Physical Review E 47, 184 (1993).
- (5) R. Wildman, J. Huntley, and J.-P. Hansen, Physical Review E 60, 7066 (1999).
- (6) J. Seymour, A. Caprihan, S. Altobelli, and E. Fukushima, Physical Review Letters 84, 266 (2000).
- (7) K. M. Hill, G. Gioia, and V. V. Tota, Phys. Rev. Lett. 91, 064302/1 (2003).
- (8) S. Hsiau and M. Hunt, Journal of Fluid Mechanics 251, 299 (1993).
- (9) N. Menon and D. Durian, Science 275, 1920 (1997).
- (10) V. Natarajan, M. Hunt, and E. Taylor, Journal of Fluid Mechanics 304, 1 (1995).
- (11) S.-S. Hsiau and Y.-M. Shieh, Journal of Rheology 43, 1049 (1999).
- (12) S.-S. Hsiau and W.-L. Yang, Physics of Fluids 14, 612 (2002).
- (13) M. L. Hunt, S. S. Hsiau, , and K. T. Hong, Journal of Fluids Engineering 116, 785 (1994).
- (14) H. Makse and J. Kurchan, Nature 415, 614 (2002).
- (15) F. Radjai and S. Roux, Physical Review Letters 89, 064302 (2002).
- (16) S. B. Savage and R. Dai, Mechanics of Materials 16, 225 (1993).
- (17) V. Garzo, Physical Review E 66, 021308 (2002).
- (18) C. Campbell, Journal of Fluid Mechanics 348, 85 (1997).
- (19) M. Lätzel et al., Eur. Phys. J. E 11, 325 (2003).
- (20) A. Sierou and J. F. Brady, submitted to J. Fluid Mech. (2003).
- (21) G. Taylor, Proc. Roy. Soc. A 219, 186 (1953).
- (22) K. Feitosa and N. Menon, Physical Review Letters 88, 198301 (2002).
- (23) R. Wildman and D. Parker, Physical Review Letters 88, 064301 (2002).
- (24) D. E. Elrick, Austral. J. Phys. 15, 283 (1962).
- (25) G. Debregeas, H. Tabuteau, and J. di Meglio, Physical Review Letters 87, 178305 (2001).
- (26) V. Breedveld et al., Journal of Chemical Physics 116, 10529 (2002).
- (27) S. Hsiau and M. Hunt, Transactions of the ASME. Journal of Heat Transfer 115, 541 (1993).
- (28) M. Scherer, V. Buchholtz, T. Poschel, and I. Rehberg, Phys. Rev. E 54, R4560 (1996).
- (29) M. Marchioro and A. Acrivos, Journal of Fluid Mechanics 443, 101 (2001).
- (30) B. Utter and R. P. Behringer, in preparation (2003).
- (31) PSM-4 Photoelastic Coating is purchased from Vishay Measurements Group, Inc. (Raleigh, NC).
- (32) C. Veje, D. Howell, and R. Behringer, Physical Review E 59, 739 (1999).
- (33) H. Xu, A. P. Reeves, and M. Y. Louge, unpublished.
- (34) K. Batchelor, G, Austral. J. Sci. Res. 2, 437 (1949).
- (35) J. Klafter, M. Shlesinger, and G. Zumofen, Physics Today 49, 33 (1996).
- (36) T. Solomon, E. Weeks, and H. Swinney, Physica D 76, 70 (1994).
- (37) K. Christensen et al., Phys. Rev. Lett. 77, 107 (1996); M. Boguñá and A. Corral, Phys. Rev. Lett. 78, 4950 (1997).