Magnetic Order and Dynamics in Stripe-Ordered La2-xSrxNiO4
Abstract
We have studied magnetic correlations in several compositions of stripe-ordered La2-xSrxNiO4. In this paper we show how polarized-neutron scattering has helped uncover important features of the magnetic ordering and spin dynamics. In particular, polarization analysis has enabled us (1) to characterize a spin reorientation transition, (2) to identify anisotropy gaps in the spin excitation spectrum, and (3) to investigate an anomalous dip in the spin-wave intensity suggestive of coupling between collective spin and charge excitations.
keywords:
Charge stripe order , spin waves , spin reorientation , La2-xSrxNiO4 , polarized-neutron scatteringPACS:
75.30.Ds, 71.45.Lr, 75.30.Et, 75.30.Fv, , , ,
1 Introduction
The layered nickelate family La2-xSrxNiO4 has been the focus of many recent investigations on account of its stripe-ordered phase. This phase is characterized by the segregation of charge carriers into an ordered array of parallel lines separating antiferromagnetic domains of Ni2+ () spins [1]. Stripes represent a novel type of complex order, and their properties have been energetically researched since the discovery of stripe order in members of the copper-oxide high- superconductors [2]. Experiments to establish the basic physics of the stripe phase in model non-superconducting systems can help determine whether or not stripes play an important role in the mechanism of superconductivity in the cuprates.
The nature of the spin and charge order in the stripe phase in La2-xSrxNiO4 has been characterized in detail over the doping range by electron, x-ray and neutron diffraction [1], and it is now of interest to explore the collective spin and charge dynamics over the same range of composition. From such studies one can learn about the nature of the excited states, and hence gain insight into the microscopic interactions that stabilize stripe order.
In this paper we describe neutron scattering studies of the magnetic order and dynamics in a number of La2-xSrxNiO4 compounds. Some of the data for the and systems have been reported previously [3, 4]. Here we focus on results obtained with polarized neutrons, and emphasize how certain characteristic features of the data vary with composition.
2 Experimental details
All the data presented here were collected on the IN20 triple-axis spectrometer at the Institut Laue-Langevin. Since its upgrade in 2001, the flux of polarized neutrons on IN20 has increased by an order of magnitude [5]. This gain has allowed experimentalists to be more ambitious, especially with regard to inelastic scattering measurements.
IN20 is equipped with focussing arrays of heusler crystals for both monochromator and analyser. Typical experiments require measurement of the spin-flip (SF) and non-spin-flip (NSF) scattering, with the neutron polarization in the horizontal scattering plane either parallel or perpendicular to the scattering vector , or with vertical. For the present measurements the analyser was set to reflect neutrons of fixed final energy 14.7 meV.
Single crystals of La2-xSrxNiO4 were prepared in Oxford by the floating-zone method [6]. The crystals were all rod-like with masses of 10–15 g.
3 Results
The first studies we describe concern the direction of the ordered magnetic moment of the Ni2+ spins in La2-xSrxNiO4. The magnetic ordering temperature of the Ni2+ spins in the stripe phase depends on . For the compositions reported here, K for –0.37, and K for . The diagonal stripe pattern is twinned, with stripes either parallel to the or directions of the tetragonal lattice (cell parameter ). These are described by two-dimensional magnetic ordering wave vectors and , respectively, where in reciprocal lattice units. In our samples we observed an equal population of the twin domains.
Using polarized-neutron diffraction, Lee et al [7] deduced that the ordered moments at low temperature are constrained to lie in the NiO layers at an angle of () and () to the stripe direction. In the case of , they also found that a transition takes place on warming through K such that the spins rotate in the plane towards the stripe direction through an angle of .
We have performed similar measurements to Lee et al, but on crystals with and . The results are presented in Fig. 1, which shows the angle of the spins from the stripe direction as a function of temperature. Like Lee et al, we are assuming in this analysis a collinear magnetic structure with a single canting angle, as opposed to a distribution of domains with different spin directions, the relative population of which could vary. This assumption needs to be checked out experimentally.
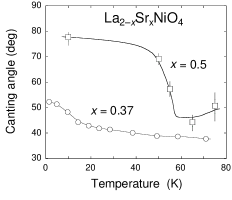
From Fig. 1, both and compounds are seen to undergo a spin reorientation transition within the NiO planes, with and . The transition is rather broad for . The angle through which the spins rotate is and
Next we discuss two characteristic features observed in the stripe-phase spin dynamics of La2-xSrxNiO4. We refer to the energy scans shown in Fig. 2. These scans were obtained with fixed at the two-dimensional magnetic ordering wavevector for each composition. As expected, cooperative spin excitations emerge from the wavevectors. These excitations are found to be strongly dispersive, so much so that magnetic scattering is observed at over the whole energy range shown in Fig. 2. Inter-plane correlations were observed at low energies, but were found to be negligible for meV.
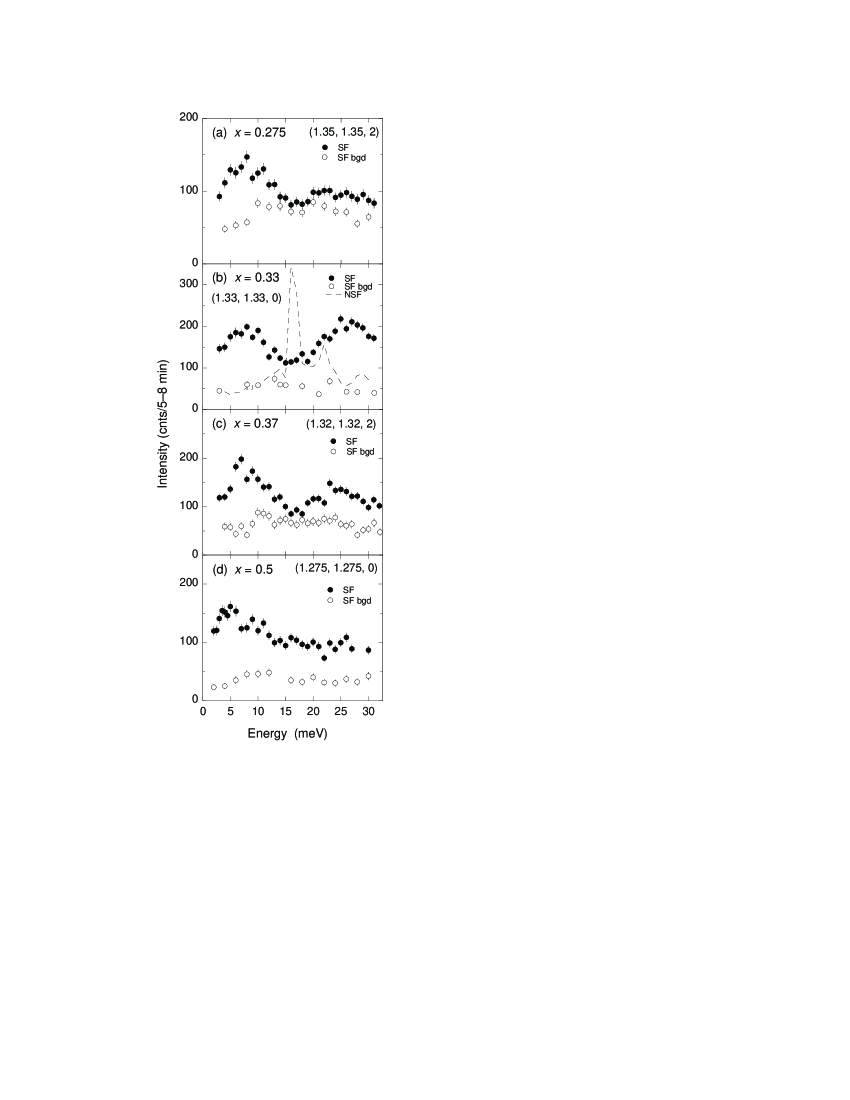
One feature common to all the scans shown in Fig. 2 is a reduction in intensity below an energy of meV for , or meV for . This reduction is not present in energy scans made at equivalent wavevectors with a large component along the axis (not shown). Given that neutrons scatter from spin fluctuations perpendicular to , these observations indicate that the intensity reduction below 4–7 meV is due to the freezing out of the c-axis component of the spin fluctuations. This points to the existence of a 4–7 meV energy gap due to single-ion out-of-plane anisotropy.
Polarized neutrons provide a direct method to check for anisotropy gaps. Below an anisotropy gap one component of the spin fluctuations is frozen out, and the component involved can be identified by polarization analysis. We measured the SF scattering from the crystal at energies of 3, 10, 15 and 26 meV, with the three-dimensional wavevector fixed at , = 0 or 1. For these measurements the crystal was mounted with the and directions in the horizontal scattering plane, and we switched the neutron polarization between three orthogonal directions: (i) , (ii) in the scattering plane, and (iii) vertical (i.e. parallel to the stripe direction ). We label the corresponding SF intensities , and respectively. For the case , which was used with energies of 10, 15 and 26 meV, it can be shown that
| (1) |
where and are the components of the dynamic magnetic response function describing spin correlations along the crystal axis (), and parallel to the stripe direction (). At 3 meV the intensity at shows a slight modulation with due to weak inter-layer correlations. This modulation peaks at odd integers, and we made the 3 meV measurement at the intensity maximum. As far as the crystal orientation is concerned the difference in angle between and is only , and Eq. (1) is still a very good approximation.
The results of these measurements are shown in Fig. 3. The ratio is seen to be constant within experimental error for energies from 10 meV to 26 meV. The average value of in this energy range is close to that calculated on the assumption of isotropic spin fluctuations about the ordered moment direction away from the stripe direction [7]. The point at 3 meV, however, is much lower than the others, indicating a strong reduction in out-of-plane spin fluctuations at this energy.

These results show that the spin fluctuations are predominantly in-plane at energies of 3 meV, and isotropic about the direction of the ordered moment at 10 meV and above. This confirms that the 7 meV feature in Fig. 2(b) for the crystal is the out-of-plane anisotropy gap. Similar measurements on the crystal showed likewise for the 4 meV gap in Fig. 2(d). We searched for the in-plane anisotropy gap in energy scans at wavevectors nearly perpendicular to the NiO layers, but could only put an upper limit on the gap energy of 1 meV.
Interestingly, the out-of-plane energy gap in undoped La2NiO4 is 16 meV [8]. Together with the data reported here this indicates that the out-of-plane anisotropy decreases with doping. In a spin-wave model, the gap energy varies as , where is the anisotropy energy and is the total exchange energy per spin. Measurements of the overall spin-wave dispersion have established that the intra and inter-stripe Ni–Ni exchange interactions differ by only a factor 2 [3], so that decreases relatively slowly with doping. This implies a very considerable decrease in with doping, which has been confirmed by spin-wave analyses for and 0.33, for which meV and meV respectively [8, 3].
The other notable feature is the dip centred on meV and subsequent peak near meV in Figs. 2(a)–(c). This dip–peak structure occurs in an energy range where there is strong scattering from phonons, as evident in the NSF channel shown in Fig. 2(b), and so neutron polarization analysis is an important tool to isolate the magnetic scattering.
Constant-energy scans performed at energies close to 26 meV showed that the magnetic response is significantly broader in for than for . Since the scans shown in Fig. 2 measure the amplitude of the magnetic response it is possible that this broadening has washed-out the meV peak for .
There is no sign of the dip–peak structure in the data for , and although the equivalent energy scans for do present a superficial resemblance to those in Fig. 2 the analysis in Ref. [8] showed that for the case of the signal in this energy range is fully accounted for by a spin wave model with two anisotropy gaps. The anomalous dip–peak structure in Figs. 2(a)–(c) cannot be explained by two anisotropy gaps because, as shown above, the anisotropy gaps for –0.37 are below 10 meV.
4 Discussion and conclusions
It is not clear at present what mechanism drives the spin reorientation in La2-xSrxNiO4, but our results show, (i) that the reorientation occurs for several doping levels, including compositions in which the stripes are commensurate () and incommensurate ( and 0.5) with the host lattice, and (ii) that the angle of the ordered moment relative to the stripe direction tends to increase with doping. The reorientation transition is most prominent for , which has the highest charge ordering temperature ( K) and a slightly-incommensurate checkerboard charge ordering pattern below K [4, 9].
We also cannot offer an explanation for the pronounced decrease in single-ion anisotropy with doping. We can, however, comment on a possible origin of the dip–peak feature in the spin excitation spectrum. An explanation involving purely magnetic interactions seems unlikely since the feature is most prominent for , whose spins order into a two-sublattice antiferromagnetic structure [3]. The zero-field spin wave spectrum of such an ordering contains no gaps other than those due to anisotropy, and we have shown above that for the anisotropy gaps are 7 meV and meV. Moreover, the polarization of the spin fluctuations is constant over the dip–peak region, as illustrated in Fig. 3. Hybridization with phonon excitations of the host lattice is a possibility, but seems unlikely given that the anomalous dip is absent for and . Therefore, the evidence so far points to a hybridization with an excitation associated with the stripes, possibly a cooperative motion of the charge domain walls.
Finally, we mention that the experiments reported here illustrate well the power of neutron polarization analysis to determine static and fluctuating spin components, and to separate magnetic and non-magnetic scattering unambiguously.
We thank F.R. Wondre for crystal characterization data, and the EPSRC for financial support.
References
- [1] C. H. Chen, S-W. Cheong, and A. S. Cooper, Phys. Rev. Lett. 71, 2461 (1993); J. M. Tranquada et al, Phys. Rev. Lett. 73, 1003 (1994); H. Yoshizawa et al, Phys. Rev. B 61, R854 (2000).
- [2] J. M. Tranquada et al, Nature 375 (1995) 561.
- [3] A. T. Boothroyd et al, Phys. Rev. B 67 (2003) 100407(R).
- [4] P. G. Freeman et al, Phys. Rev. B 66 (2002) 212405.
- [5] J. Kulda et al, Appl. Phys. A 74 [Suppl] (2002) S246.
- [6] D. Prabhakaran et al, J. Cryst. Growth 237 (2002) 815.
- [7] S.-H. Lee et al, Phys. Rev. B 63 (2001) 060405(R).
- [8] K. Nakajima et al, J. Phys. Soc. Jpn. 62 (1993) 4438.
- [9] R. Kajimoto et al, Phys. Rev. B 67 (2003) 14511.