Divergence of the Grüneisen Ratio at Quantum Critical Points in Heavy Fermion Metals
Abstract
We present low-temperature volume thermal expansion, , and specific heat, , measurements on high-quality single crystals of CeNi2Ge2 and YbRh2(Si0.95Ge0.05)2 which are located very near to quantum critical points. For both systems, shows a more singular temperature dependence than , and thus the Grüneisen ratio diverges as . For CeNi2Ge2, our results are in accordance with the spin-density wave (SDW) scenario for three-dimensional critical spin-fluctuations. By contrast, the observed singularity in YbRh2(Si0.95Ge0.05)2 cannot be explained by the itinerant SDW theory but is qualitatively consistent with a locally quantum critical picture.
pacs:
71.10.HF,71.27.+aQuantum critical points (QCPs) are of extensive current interest to the physics of correlated electrons, as proximity to a QCP provides a route towards non-Fermi liquid behavior. While a broad range of correlated electron materials are being studied in this context, heavy fermions have been playing an especially important role: a growing list of heavy fermion (HF) metals explicitly displays magnetic QCPs Stewart ; Schroeder ; Lonzarich ; Gegenwart CNG ; Trovarelli Letter . Systematic experiments in these systems promise to shed considerable light on the general physics of quantum critical metals. Indeed, recent experiments Stewart ; Schroeder have shown that, at least in some of the HF metals, the traditional theory of metallic magnetic quantum phase transition fails. This traditional picture Sachdev-book describes a SDW transition and, relatedly, a mean-field type of quantum critical behavior. More recently, it has been shown that a destruction of Kondo resonances can lead to a breakdown of the SDW picture Sietal ; Colemanetal ; what emerges instead are new classes of QCPs that are locally critical Sietal .
Given these experimental and theoretical developments, it seems timely to address the conditions under which these different types of QCPs arise. For this purpose, it would be important to carry out comparative studies of different heavy fermion materials. This paper reports one such study. We have chosen the HF systems CeNi2Ge2 Gegenwart CNG and YbRh2(Si0.95Ge0.05)2 Trovarelli Letter ; Custers Nature , both of which crystallize in the tetragonal ThCr2Si2 structure. Both are ideally suited to study antiferromagnetic (AF) QCPs since they are located very near to the magnetic instability, and since the effect of disorder is minimized in these high quality single crystals with low residual resistivities. We have focused on measurements of the thermal expansion, , and Grüneisen ratio, , where denotes the specific heat, since recent theoretical work Zhu has shown that i) is divergent as goes to zero at any QCP and ii) the associated critical exponent can be used to differentiate between different types of QCP.
Presently measurements of the thermal expansion and Grüneisen ratio for systems located directly at the QCP are lacking. Only for Ce1-xLaxRu2Si2, which orders antiferromagnetically for with , has been measured for concentrations and at temperatures above 0.4 K. A very large was obtained which, however, was found to saturate at low temperatures Kambe . In other solids too, all previous measurements reported in the literature yield a finite Grüneisen ratio Barron .
In this Letter we communicate the first-ever observation of a divergent Grüneisen ratio for . CeNi2Ge2 is known to be a NFL compound which exhibits a paramagnetic ground state SC CNG . The electrical resistivity, , resembles that of CePd2Si2 at the pressure tuned QCP Grosche : with below 4 K Gegenwart CNG ; Grosche ; Gegenwart Physica ; Koerner ; Braithwaite . In YbRh2Si2 pronounced NFL effects, i.e. and have been observed upon cooling from 10 K down to 0.3 K. While keeps following the linear -dependence down to 70 mK, diverges stronger than logarithmically below K Trovarelli Letter ; Gegenwart YRS . For our study we chose a high-quality single crystal of YbRh2(Si0.95Ge0.05)2 for which has been reduced to 20 mK. Large CeNi2Ge2 single crystals of weight 5 to 6 g were grown using the traveling-floating-zone mirror-oven technique. The samples were analyzed via electron-probe microanalysis (EPMA) and found to have the desired 122 (P4/mmm) structure with little mosaic spread, good stoichiometry and no second phases. Two thin oriented bars with a length of 5 mm were formed by spark-erosion from the center of the large single crystal. The bars were annealed for 120 hours at 800∘C in an Ar partial pressure ( torr) and have a residual resistivity of cm. Single crystalline platelets of YbRh2(Si1-xGex)2 with a nominal Ge concentration of were grown from In flux as described earlier Trovarelli Letter ; Custers Nature . From a careful EPMA, the Ge-concentration is found to be . The large difference between nominal and effective Ge-content is due to the fact, that Ge dissolves better than Si in the In-flux. A similar effective Ge content of Custers Nature is deduced from hydrostatic pressure experiments Mederle . The residual resistivity of the Ge-doped crystal is 5 cm. The thermal expansion and the specific heat have been determined in dilution refrigerators by utilizing an ultrahigh resolution capacitive dilatometer and the quasi-adiabatic heat pulse technique, respectively.
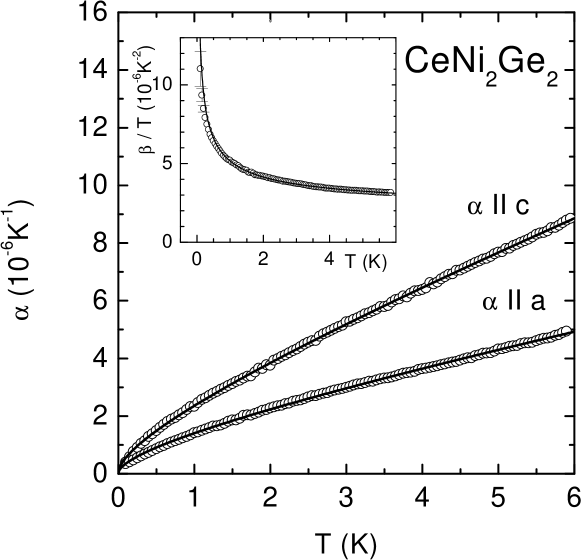
Figure 1 displays the dependence of and , the linear thermal expansion coefficients of CeNi2Ge2 measured along the tetragonal - and -axis. As shown by the solid lines, the data can be described in the entire range investigated by the -dependence predicted Zhu by the three-dimensional (3D) SDW scenario, i.e., the sum of (singular) square-root and (normal) linear contributions. The corresponding fit parameters are listed in Table I. We observe a moderate anisotropy . As shown in the inset, the volume expansion coefficient , plotted as is not a constant upon cooling, as would be for a Fermi liquid, but shows a divergence over more than two decades in temperature from 6 K down to at least 50 mK. This is one of the cleanest observations of NFL behavior in a thermodynamic property made in any system so far.
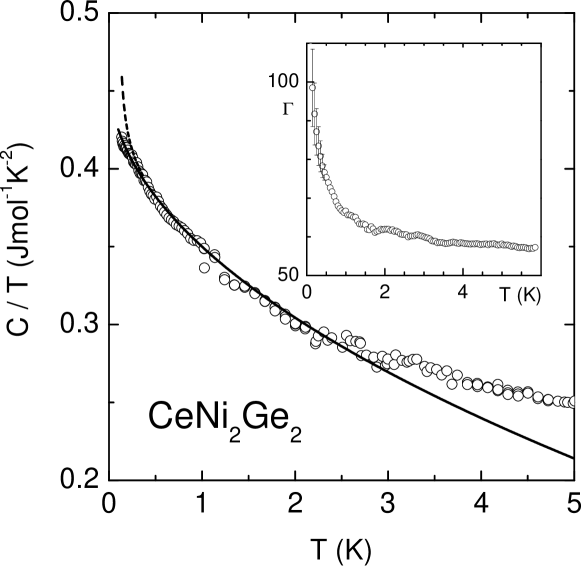
We next consider the low temperature specific heat of CeNi2Ge2. As shown by several investigations, strongly increases upon cooling from 6 K to 0.4 K Knopp ; Aoki ; Gegenwart CNG ; Koerner ; Steglich2000 . This increase has either been described by Gegenwart CNG ; Koerner or Aoki . Below 0.4 K different behaviors have been reported. While Knopp et al. found a peak at 0.3 K followed by a 6% decrease in from the maximum value Knopp , Koerner et al. observed a leveling off in below 0.3 K Koerner . In contrast, of a high-quality sample with very low residual resistivity does not saturate but shows an upturn at the lowest temperatures Steglich2000 . Very recently a systematic study of the low temperature specific heat on different high-quality polycrystals, prepared with a slight variation of the stoichiometry Gegenwart Physica , has been performed. The result was that nearly all of the different investigated samples showed such an upturn in below 0.3 K whose size, however, is strongly sample dependent even for samples with similar and a residual resistivity of only 0.2 cm Cichorek . In the following we analyze the specific heat (Fig. 2) measured on the same sample that has been used for the thermal expansion study. Below 3 K the data can be described by using the parameters listed in Table I (solid lines in Fig. 2). Here we assume that the low temperature upturn, present in this single crystal as well, could be ascribed to the high-temperature tail of a Schottky anomaly Cichorek_tbp . Its influence on the Grüneisen ratio is smaller than at 0.1 K and therefore not visible in the plot shown in the inset of Fig. 2. This is the first observation of a divergent for in any material and provides striking evidence that CeNi2Ge2 is located very close to a QCP. The observed dependence is in full agreement with the 3D SDW prediction Zhu . If the investigated high-quality single crystal would enter a Fermi liquid regime below 0.3 K as observed for the sample studied in Koerner , should saturate below that temperature.
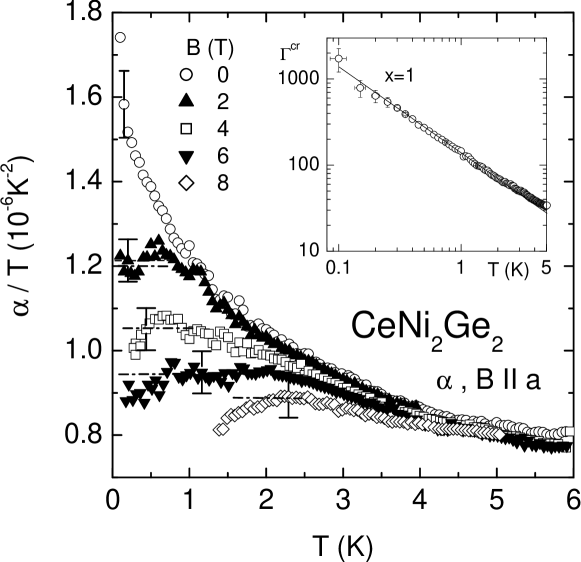
The application of magnetic fields to CeNi2Ge2 is found to gradually reduce the low- specific heat coefficient. For T a nearly temperature-independent is observed at low temperatures with Aoki . The low-temperature thermal expansion shows a similar field-induced crossover to Fermi liquid behavior (Fig. 3) and the field dependence of in the field induced FL regime diverges like (not shown). Both features are consistent with the predictions Zhu from the itinerant 3D SDW fluctuations at a zero-field AF QCP, assuming a linear dependence between the magnetic field and the distance from the QCP.
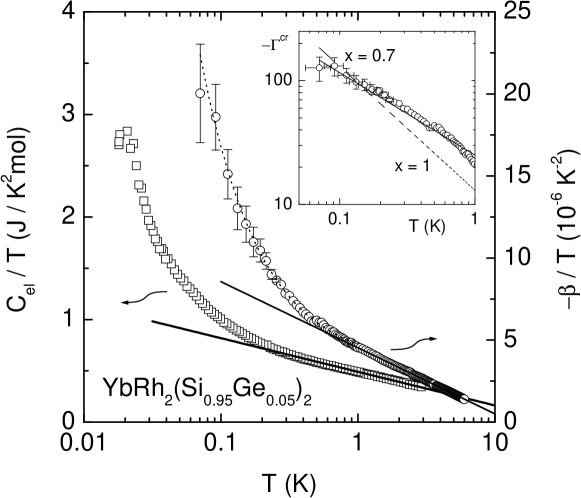
We now turn to YbRh2(Si0.95Ge0.05)2, in which we have measured the thermal expansion from 50 mK to 6 K. Compared to CeNi2Ge2, here the volume thermal expansion coefficient has an opposite sign reflecting the opposite volume dependence of the characteristic energies. At K, can be fit by with K (see Fig. 4). At K, the best fit is given by . Both are not only different from the expected 3D-SDW results discussed earlier, but also weaker than the form Zhu expected in a 2D-SDW picture YRS beta . The difference from the 2D-SDW picture is even more striking when we look at the Grüneisen ratio. In Fig. 4, we have also shown the electronic specific heat at zero magnetic field. Here , where denotes the nuclear quadrupolar contribution determined from recent Mössbauer results Abd . At 20 mK a maximum in marks the onset of very weak AF order Custers Nature . This is suppressed by a tiny critical magnetic field of T applied in the easy plane. At , a power law divergence is observed (which is already incompatible with the 2D-SDW picture) Custers Nature . At higher temperatures the zero-field specific heat coefficient also varies as with K (Fig. 4) Trovarelli Letter . Because of the difference between and , the Grüneisen ratio is strongly temperature dependent. Below 1 K it diverges as , i.e., weaker than the form expected in a 2D-SDW picture Zhu . We note that, in the measured temperature range, the zero-field data of both the specific heat and thermal expansion are identical to their counterparts at the critical magnetic field.
To interpret our results, we introduce a Grüneisen exponent in terms of the critical Grüneisen ratio , where and are the thermal expansion and specific heat with the background contributions subtracted; this exponent is equal to the dimension of the most relevant operator that is coupled to pressure Zhu . It is shown in Ref. Sietal that, for magnetically three-dimensional systems without frustration the SDW picture should apply. This is consistent with our finding here that both the thermal expansion and specific heat results in CeNi2Ge2 can be fit by the respective expressions for a 3D-AF-SDW theory Kadowaki . Our results correspond to and , leading to . In other words, the Grüneisen exponent (with error bars , as determined from a log-log plot shown in the inset of Fig. 3.) In an SDW picture, the most relevant term is the quadratic part of the -theory. The corresponding dimension is , where the spatial-correlation-length exponent and the dynamic exponent .
For YbRh2(Si1-xGex)2, on the other hand, the measured Grüneisen exponent is fractional: as determined from a log-log plot of versus temperature shown in the inset of Fig. 4. While definitely not compatible with the itinerant SDW theory, a fractional Grüneisen exponent is consistent with the locally quantum critical point. One kind of condition favorable for this new type of QCP corresponds to a magnetic fluctuation spectrum that is strongly anisotropic Sietal . At such a locally quantum critical point, spatially local critical excitations emerge and co-exist with the spatially extended critical spin fluctuations. There are then two scaling dimensions to be considered. For the tuning of the long-wavelength fluctuations, the dimension of interest is still given by the expression . While remains , the dynamic exponent becomes where is the fractional exponent that characterizes the dynamical spin susceptibility. As a result, . For the tuning of the local fluctuations, the corresponding dimension is the inverse of the temporal-correlation-length exponent. Within an expansion scheme as carried out in Ref. Zhu-BFK and for the XY-spin-invariant case of relevance to YbRh2(Si1-xGex)2, this exponent is found Zhu-unpublished to be to the first order in and to the second order in . The overall Grüneisen ratio will then display a fractional exponent, as indeed seen experimentally.
We are grateful to M. Lang, O. Trovarelli and H. Wilhelm for valuable conversations, F. Weickert and J. Custers for their help with the resistivity experiments, and the Fonds der Chemischen Industrie (Dresden), the Dutch Foundation FOM-ALMOS (O.T. and J.A.M.), NSF, TCSAM, and the Welch Foundation (L.Z. and Q.S.) for support.
References
- (1) G. R. Stewart, Rev. Mod. Phys. 73, 797 (2001).
- (2) A. Schröder et al., Nature 407, 351 (2000).
- (3) N.D. Mathur et al., Nature 394, 39 (1998).
- (4) P. Gegenwart et al. Phys. Rev. Lett. 82, 1293 (1999).
- (5) O. Trovarelli et al., Phys. Rev. Lett. 85, 626 (2000).
- (6) S. Sachdev, Quantum Phase Transitions (Cambridge Univ. Press, 1999), chap. 12.
- (7) Q. Si et al., Nature 413, 804 (2001).
- (8) P. Coleman et al., J. Phys. Cond. Matt. 13, R723 (2001).
- (9) J. Custers et al., Nature 424, 524 (2003).
- (10) L. Zhu et al., preceding letter, Phys. Rev. Lett. 91, 066404 (2003).
- (11) S. Kambe et al., J. Phys. Cond. Matt. 9, 4917 (1997).
- (12) P. Thalmeier and B. Lüthi, Handbook on the Physics and Chemistry of Rare Earths, Vol. 14, K.A. Gschneider Jr. and L. Eyring (Eds.), Elsevier B.V. (1991), p.225.
- (13) A superconducting transition, observed below 0.2 K in some electrical resistivity measurements Grosche ; Gegenwart Physica ; Koerner ; Braithwaite , has not been detected by any bulk probe so far.
- (14) F.M. Grosche et al., J. Phys. Cond. Matt. 12 L533 (2000).
- (15) P. Gegenwart et al., Physica B281&282, 5 (2000).
- (16) S. Koerner et al., J. Low Temp. Phys. 119, 147 (2000).
- (17) D. Braithwaite et al., J. Phys.: Condens. Matter 12, 1339 (2000).
- (18) P. Gegenwart et al., Phys. Rev. Lett. 89, 056402 (2002).
- (19) S. Mederle et al., J. Phys. Cond. Matt. 14, 10731 (2002).
- (20) G. Knopp et al., J. Magn. Magn. Matter. 74, 341 (1988)
- (21) Y. Aoki et al., J. Phys. Soc. Jpn. 66, 2993 (1997).
- (22) F. Steglich et al., Physica C 341-348, 691 (2000).
- (23) T. Cichorek et al., Acta Phys. Pol. B 34, 371 (2003).
- (24) The upturn is not a part of the quantum critical behavior: it remains in a magnetic field of about 2 T which, at 0.7K, is outside the quantum critical regime. T. Cichorek et al., to be published.
- (25) T. Fukuhara et al., Physica B230-232, 198 (1997).
- (26) The data for K allow a fitting with Zhu , but the extracted component is negligible compared to the other terms.
- (27) J. Plessel et al., Phys. Rev. B67, 180303 (2003).
- (28) L. Zhu and Q. Si, Phys. Rev. B 66, 024426 (2002).
- (29) L. Zhu and Q. Si, unpublished (2003).
- (30) Recent neutron scattering measurements indeed show that the low energy magnetic fluctuation spectrum in CeNi2Ge2 is 3D: H. Kadowaki et al., Act. Phys. Pol. B 34, 375 (2003).
| K-1.5,K-2 | ||
| K-1.5,K-2 | ||
| K-1.5, K-2 | ||
| JK-2mol-1,Jmol-1K-5/2 | ||
| JKmol-1 |