Shallow Deep Transitions of Neutral and Charged Donor States in Semiconductor Quantum Dots
Abstract
We carry out a detailed investigation of neutral () and charged () impurity states of hydrogen-like donors in spherical semiconductor quantum dots. The investigation is carried out within the effective mass theory (EMT). We take recourse to local density approximation (LDA) and the Harbola-Sahni (HS) schemes for treating many-body effects. We experiment with a variety of confining potentials: square, harmonic and triangular. We observe that the donor level undergoes shallow to deep transition as the dot radius () is reduced. On further reduction of the dot radius it becomes shallow again. We term this non-monotonic behaviour SHADES. This suggests the possibility of carrier “freeze out” for both and . Further, our study of the optical gaps also reveals a SHADES transition.
pacs:
73.21.La, 71.55.-i, 73.63.KvI Introduction
Impurities play a central role in semiconductor technology. Performance of a semiconductor device is dictated by shallow dopants. Shallow dopants like phosphorous and boron alter the conductivity of bulk silicon by several orders of magnitude. Deep defects on the other hand are known to degrade device performance. An interesting point is that the concentration of these impurities is miniscule: less than a tenth of a percent. Relevance of the role of shallow donors in semiconductor quantum dots (QDs), which are essentially zero dimensional structures, thus cannot be overestimated.
Nearly two decades ago Bastard bast81 reported the first calculation of the binding energy of a hydrogenic impurity in two-dimensional quantum wells (QW). Bryant brya84 ; brya85 extensively studied hydrogenic impurity states in one-dimensional quantum well wires (QWW). Zhu et al. zhu90 were the first to study the effect of hydrogenic impurity in spherical quantum dots (QDs). The system chosen was (). Calculations based on the hydrogenic impurity states in presence of electric or magnetic field have also been reported over the past decade xiao96 ; ribe97 ; core01 . Ranjan and Singh ranj01 reported studies of neutral donor states () in II-VI and III-V QDs. They examined the effects of a size dependent dielectric constant , where is the radius of the spherical QD. As long back as 1990 Pang and Louie pang90 discussed the negative donor centers in semiconductor quantum wells. They calculated the binding energy of negative donor state () in presence of magnetic field, solving the effective mass model exactly by diffusion quantum Monte Carlo method.
Zhu et al. zhu92 ; zhu94 worked out the effect of dimensionality and potential shape on the binding energy of and states of the impurity. Further, they also studied the effect of electron correlation in the binding energy. They showed that the shape of the confinement is less important than the confinement strength. They also mentioned the importance of electron correlation in their results. Ranjan and Singh ranj01 made a systematic study of the non-monotonic shallow deep transition (SHADES) of the impurity in a semiconductor QD. SHADES occurs when one decreases the size of the QD. First the impurity level becomes deep and then below a critical size it becomes shallow again.
In the present work we study both the neutral and the negatively charged hydrogenic donor states in a three-dimensional spherical quantum dot (QD). We study the effect of the shape of confinement potential on the binding energy of these donors. Many-body effects are taken into account by employing the density functional methodology. To treat the exchange effects accurately, particularly for negative ions, we employ the Harbola-Sahni (HS) scheme harb89 for the exchange part of the interaction. We also compare the HS results with those of the local density approximation (LDA).
II Model
Our calculations have been performed on a spherical QD We have solved the Schroedinger equation self-consistently within the effective mass theory (EMT) approximation. We have included electron-electron interaction effect within the local density functional approach and the Harbola-Sahni scheme. The Hamiltonian of the system is given by the following expression
| (1) |
The first term in the above Hamiltonian is the kinetic energy of the electrons, the second term is the electron-electron interaction energy, the third term is the external potential for N-electron system and the last term is the impurity potential. This Hamiltonian is written in Hartree’s atomic unit, where and unit of energy is 27.2 and that of length (size) is 0.53 Å. In the above equation is the effective mass of the electron inside the QD in units of , the free electron mass. The above many-body Hamiltonian can be reduced to a single particle Schroedinger type Hamiltonian for the ground state within the Kohn-Sham formulation of density functional theory (DFT) kohn65 .
In order to study the shape dependence of binding energy, we model ranj02 ; pand03 our external potential as follows:
| (4) |
where is the depth of the potential. This can be given by the conduction band offset (valence band offset) between the QD and the surrounding layer for the electron (hole). is the radius of the QD and assumes positive integral values from 1 to a very large number. Changing the value of results in the change of the shape of the potential. In particular is quasi-triangular, is quasi-harmonic confinement and is quasi-square well confinement. As , the potential becomes a square well.
The total ground state energy of an N-electron system in terms of the density is given as
| (5) |
where is the kinetic energy functional of a non-interacting many electron system, is the Hartree energy, is the exchange-correlation energy functional, is the energy functional due to the external potential and is the energy functional because of the impurity potential. Note that is the charge density. As pointed out in Sec. I we have used two different approaches for the calculation of the exchange-correlation potential (), namely the LDA in its Gunnarsson-Lundqvist gunn76 parameterized form and the exchange potential using HS scheme. Within the HS scheme, the exchange potential is interpreted as the work done in moving an electron in the field of its Fermi hole.
The HS scheme calculates nearly exact exchange interaction. For the atomic case, the method essentially reproduces Hartree-Fock results for all the elements in the periodic table sahn92 . Also, HS scheme has self-interaction correction built in it and hence calculates very good eigenvalues and total energies for a single electron system, whereas the LDA is known to yield poor results for the hydrogen-like atoms due to non-cancellation of the self-interaction of the electron.
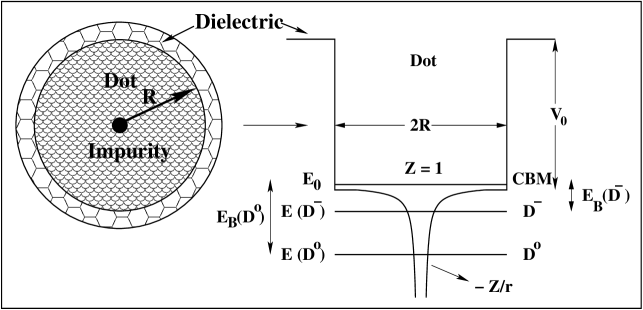
A hydrogenic impurity in a host bulk semiconductor gives rise to a shallow donor state in the energy gap of the host. We refer to this as neutral donor state () and its energy as . The energy required to take the electron from the neutral donor state into the conduction band is termed as binding energy, and is of the order of 10 - 50 . Hence the binding energy of a neutral donor can be written as
| (6) |
where is the ground state energy of an electron in the conduction band.
A negative donor center in a semiconductor is formed by a neutral donor center trapping an extra electron. The binding energy of a negative donor can be interpreted as follows: We take an electron from to the conduction band. Initially the energy of the system was , the final energy is . Therefore the binding energy of a negative donor can be given by subtracting the final energy from the initial energy, i.e.
| (7) |
where is the ground state energy of a neutral donor and is the ground state energy of a negative donor. This is the energy required to promote an electron from to the conduction band. Naturally the binding energy of a negative donor is smaller than the neutral donor.
As we have mentioned earlier the HS scheme has self-interaction correction built-in, hence it calculates very good eigenvalues for small number of electrons. In fact the total energy of a single electron with and without the impurity potential is exactly equal to the eigenvalue of an electron with and without the impurity potential respectively. In other words, and , where is the eigenvalue of an electron in the conduction band minimum and is the eigenvalue of the neutral donor. The expression for binding energy of a neutral donor in terms of the eigenvalues is given as
| (8) |
Thus the binding energy of an electron in this case is also equal to the optical transition energy. We can also write the binding energy of a negative donor in terms of the eigenvalues. The total energy of a hydrogen-like negative donor is given by the formula
| (9) |
where is the eigenvalue of two-electron system. From the definition of the binding energy of a negative donor (Eq. (7))
| (10) |
| (11) |
where
| (12) |
is the effective electron-electron interaction energy. We call it the “Hubbard ” ranj02 ; pand03 . The last two terms in the Eq. (11) cancel each other (true only for one orbital system) in HS scheme but they do not cancel within LDA. Hence, within the HS scheme, the binding energy of a negative donor in terms of eigenvalues can be written as
| (13) |
Within the LDA, whereas within the exchange only HS scheme, , where is the Coulomb energy, is the exchange energy and is the correlation energy.
III Results And Discussion
III.1 The Binding Energy

We present the results of binding energy of a hydrogen-like impurity (). As mentioned earlier we are employing Hartree units, in which and unit of energy is 27.2 and that of length (size) is 0.53 Å. Unless otherwise stated all the results presented are based on HS scheme. But the HS scheme within the one electron system () is no different from an electron moving in an impurity potential; essentially the Ranjan-Singh (RS) ranj01 . However RS scheme is perturbative and therefore its results are approximate. On the other hand, our results are numerically exact. We solve the one - dimensional Schroedinger equation in spherical co-ordinates.
In Fig. 2 we depict the binding energy () of a neutral donor () as a function of the size of the QD for various different depths of confinement potential, namely 80, 40, 20, 10, 5 and 1. The shape chosen is quasi-square well (). The plots indicate a monotonic increase in the binding energy as the size is reduced. As we decrease the size further, the binding energy reaches a maximum and then it decreases after a critical size. Thus a non-monotonic shallow-deep (SHADES) transition of the donor level is observed. A qualitative explanation of SHADES transition is as follows: The binding energy is the difference between the energy of conduction band minimum (CBM) and the impurity energy. As the dot size is decreased the CBM rises monotonically as , where sing00 . On the other hand, initially the impurity energy remains relatively constant in value as is decreased and then it increases rapidly. This is because the impurity wavefunction is localized and consequently the impurity charge density is highly confined. This charge density does not sense the boundary initially. We have confirmed this picture by a detailed examination of the energies and the wavefunctions. A typical plot of CBM () and the impurity ground state energy () is shown in the inset of Fig. 2. Even a visual examination reveals that the difference between the two energies is non-monotonic with size. Below a critical size, which we define to be , the donor level becomes shallow again. This is because below , the kinetic energy expectation value increases much more than the potential energy expectation value. Note that for large the binding energy approaches the bulk limit.
The binding energy is large for large value of . This is because of large confinement of the charge carrier. We also see that the critical size at which SHADES occurs increases monotonically with decrease in the depth of the well. These observations are recorded in Table 1. We explain these as follows: For smaller depth of the confinement potential (for example ), the strength of the confinement is less. Conventional textbooks define the strength of the potential as . Because of this, the electronic wavefunction is more spread out. As one decreases the size, the wavefunction senses the boundary much before (i.e at larger size) than the one for which the strength of the confinement is large (for example ). Hence for small , the energy of donor level increases rapidly. This implies that the binding energy is small for small and the SHADES transition occurs at larger size. An examination of Table 1 reveals that is approximately constant. In other words, . Thus, the binding energy and its maximum depends on the well depth . The latter is a surface related property depending on surface termination of dangling bonds, the dielectric coating, etc. Thus, with experience, it maybe possible to engineer the magnitude of the binding energy, making it shallow, intermediate or deep depending on one’s convenience. It suggests the possibility of “defect engineering” in QDs.
We pause to note that the hydrogenic impurity in bulk semiconductor is quite shallow. The carriers in the shallow levels of hydrogenic impurities are easily promoted into the conduction band at room temperature, thus enhancing the conducting properties of the semiconductor by several orders of magnitude. The increase in the binding energy of the hydrogenic impurity with decreasing size indicates that carrier “freeze out” will occur. Thus a nominally shallow donor will “go deep”.

In Fig. 3 we explore the dependence of the binding energy on size as the shape of the confinement potential is varied from quasi-triangular () to quasi-harmonic () and to quasi-square (). The potential depth is kept fixed at . We observe that, in this case also, the binding energy increases monotonically as the size is reduced, reaches a maximum and then decreases. However, the critical dot size at which the maxima occur is relatively insensitive to the shape parameter (). Further, the dependence of the binding energy maximum on the shape parameter () is non-monotonic. This is also displayed in Table 2. We point out the possible significance of this result. When the charge distribution is uniform throughout the spherical QD, then the shape of the potential maybe taken to be quasi-harmonic. If there is excess charge on the surface then the shape of the potential maybe taken to be quasi-square. Thus, depending on how the charges are distributed in a QD, it is possible to engineer the magnitude of the binding energy. Unlike in Fig. 2, where both the magnitude of binding energy maxima and are sensitive to the depth of the potential chosen, we see in Fig. 3 that they are relatively less sensitive to the shape of the potential.
Notice from Fig. 3 and the Table 2 that the binding energy maxima occur at different sizes for () and (). Here the magnitude of the binding energy maximum is larger for () than for (). Similarly, the binding energy maxima occur at slightly different sizes for () and () but the magnitude of the binding energy maxima are roughly the same ( 2.63 and 2.64 for 10 and 4 respectively). Also, notice that the binding energy maxima occur at larger sizes as we change the shape index from 4 to 2 and then 1, however, the magnitude of the binding energy maxima decreases.
Figure 3 also reveals that the binding energy is largest when quasi-triangular confinement is used. The binding energy of quasi-harmonic confinement is larger than the quasi-square confinement. This is because the charge carriers are more confined in quasi-triangular potential than quasi-harmonic and quasi-square potential. Similarly charge carriers are more confined in quasi-harmonic than the quasi-square potential. Thus one can tune the magnitude of the binding energy by tuning the shape of the potential.
| 80 | 0.20 | 3.20 | 6.677 | 0.25 | 5.00 | 1.449 |
|---|---|---|---|---|---|---|
| 40 | 0.30 | 3.60 | 4.837 | 0.40 | 6.40 | 1.046 |
| 20 | 0.45 | 4.05 | 3.530 | 0.55 | 6.05 | 0.740 |
| 10 | 0.55 | 3.03 | 2.562 | 0.80 | 6.40 | 0.536 |
| 5 | 0.80 | 3.20 | 1.911 | 1.05 | 5.51 | 0.396 |
| 1 | 1.60 | 2.56 | 1.035 | 2.10 | 4.41 | 0.184 |

Figure 4 shows the binding energy of a negative donor () as a function of the size of the QD. The parmaeters used are the same as for Fig. 2. Once again a non-monotonic SHADES transition is observed. For very small size the binding energy becomes negative. This implies that the impurity level is resonant with the conduction band. Note, SHADES occurs at larger size when the depth of the potential is taken to be smaller. Finally at large size the binding energy approaches the bulk limit.
If we compare the binding energy plot of (Fig. 2) with the binding energy plot of (Fig. 4), we note the following: The binding energy of is smaller than for a fixed depth of the confinement and shape index . This is obvious because the level is higher than the level by an amount approximately equal to , the effective electron - electron interaction energy. For a fixed and , the SHADES transition for occurs at larger size than for i.e. . This is because the wavefunction of the negative donor is more spread out due to the Coulomb repulsion whereas, the wavefunction of neutral donor is more confined. As the size becomes small, the wavefunction of negative donor senses the boundary relatively earlier and gets squeezed. As we decrease the size further, below a critical size (), the charge carriers are delocalized and hence leak out of the well. Therefore the binding energy of negative donor () decreases at a size () larger than the size () at which the binding energy of neutral donor () decreases.

We depict the dependence of the negative donor on the shape of the confinement potential in Fig. 5. The parameters used are the same as for Fig. 3. The binding energy exhibits a non-monotonic SHADES transition. The critical dot size at which the maxima occur is even more insensitive to the shape parameter () than it is for the neutral donor, as is evident from Fig. 5 and a comparison of columns II and IV of Table 2. The dependence of the binding energy maximum on the shape parameter () is non-monotonic as it is for the neutral donor. The binding energy maxima occur at larger size as we change the shape index from 2 to 1, however the magnitude of the binding energy decreases. These and other aspects are displayed in Table 2. Note the binding energy of the negative donor is much smaller than the binding energy of the neutral donor.
| 80 | 0.55 | 2.562 | 0.80 | 0.536 |
|---|---|---|---|---|
| 10 | 0.65 | 2.633 | 0.80 | 0.591 |
| 4 | 0.70 | 2.645 | 0.90 | 0.638 |
| 2 | 0.80 | 2.558 | 0.95 | 0.654 |
| 1 | 1.05 | 2.329 | 1.15 | 0.619 |
We have also calculated the binding energies of neutral and negative donors using Eq. (8) and Eq. (13). As pointed out earlier, we use two different methodologies, LDA and HS scheme. We have compared the binding energies of a neutral donor, obtained using Eqs. (6) and (8). We have also compared the binding energies of a negative donor, obtained using Eqs. (7) and (13), within the HS scheme. We find that the HS scheme gives identical values of using Eqs. (6) and (8). It also gives identical values of using Eqs. (7) and (13). We did the same exercise within the LDA. But LDA gives poor results for both cases.
III.2 The Optical Gap

Figure 6 shows the eigenvalue difference () between an electron in the conduction band minimum and the neutral donor. This difference () is representative of the optical gap jana78 of the system. The depth of the potential chosen is = 10. Three different shapes of the confinement potential are chosen, corresponding to 1, 2 and 80. We show results obtained using both the LDA and the HS scheme. We observe that the optical gap also shows non-monotonic SHADES transition. As noticed earlier, the optical gap obtained using the HS scheme is identically equal to the binding energy of a neutral donor, (Eq. (6)). Thus within the HS scheme, the optical gap follows the same track with the size () and the shape parameter as shown for in Fig. 3. The results obtained using LDA are different from those obtained using the HS scheme. The figure reveals that the optical gap calculated using LDA is smaller than that of the HS scheme. This is because magnitude of eigenvalue within the LDA for hydrogen-like systems is smaller due to the self-interaction of electron.

Figure 7 shows the eigenvalue difference () between an electron in the conduction band minimum and the negative donor (optical gap). The parameters chosen are the same as for Fig. 6. For comparison we show results obtained using both the LDA and the HS scheme. Once again we observe the non-monotonic SHADES transition in the optical gap. The optical gap shows similar features with size and the shape of the confinement potential as those shown in Fig. 5. In contrast to the single electron case, we find that the optical gap calculated using LDA is larger than that of the HS scheme.
In the context of the optical gap, we would like to elucidate the connection between our calculation and the work of Bhargava et al.bhar94 . The deep defect levels in QD would act as efficient traps for photo-excited carriers. Enhanced luminescence results when these carriers undergo radiative recombination. This scenario was proposed by Bhargava et al. who found that incorporating Mn impurities in ZnS nanocrystallites results in a spectacular enhancement of the luminescence efficiency () with a corresponding decrease of lifetime from milliseconds to nanoseconds. Thus high luminescence is perhaps at least partly related to the deepening of impurity levels. The deepening of the nominally shallow hydrogenic level observed by us implies that we maybe able to use them as efficient luminescence center.

IV Conclusion
Shallow dopants play a critical role in semiconductor technology. The present work as encapsulated in Figs. 2 - 5 presents an interesting scenario. This scenario is presented for the technologically relevant case GaAs and ZnS QDs in Fig. 8. Figure 8 is for a negatively charged donor where many-body effects are relevant. The inset is for neutral donor scal . However as noted earlier both or show similar behaviour. A nominally shallow donor ( or ) becomes deep as the dot size is decreased. This implies that carriers will “freeze out”. On further decrease of the dot size the dopants may once again become shallow (SHADES). An examination of Fig. 8 also indicates that the binding energy and its maxima depends on the well depth . The latter is a surface related property depending on surface termination of dangling bonds, the dielectric coating, etc. Thus, with experience, it maybe possible to engineer the magnitude of the binding energy, making it shallow, intermediate or deep depending on one’s convenience. This suggests the so called “synthetic tailorability” heat03 of binding energy by selecting a suitable dot size or dielectric coating. This may usher in the possibility of “defect engineering” in QDs. As is clear from Fig. 8, the doped GaAs QDs of size (200 Å) will be susceptible to carrier “freeze out”. Similarly the doped ZnS QDs of size (20 Å) will be susceptible to carrier “freeze out”.
We also observed the SHADES transition in the optical gap. We note the relevance of our calculations in Bhargava et al.’s work bhar94 . In this work, they proposed that the deep levels in materials such as Mn doped ZnS would act as efficient traps for photo-excited carriers. This leads to enhanced luminescence when these carriers undergo radiative recombination. If we accept this point of view, then a suitably tailored “deep” dopant may act as a luminescent center.
We note that we are working in EMT-LDA approximation. Preliminary work on an elaborate tight binding calculation on neutral donor seems to indicate SHADES behaviour sing98 . The donor impurities in the present work are located at the center of a spherical quantum dot. It would be interesting to carry out investigations in which the shape of the QD is varied and the donor is moved off center. It would also be of interest to investigate helium-like donors, e.g. S in Si. In this case many-body effects would be significant, since one would have at least three charge states of the donor, namely and . We plan to undertake some of these tasks in future.
| (GaAs) in | (ZnS) in | |
|---|---|---|
| 80 | 0.920 | 17.86 |
| 40 | 0.460 | 8.93 |
| 20 | 0.230 | 4.46 |
| 10 | 0.115 | 2.23 |
| 5 | 0.058 | 1.12 |
| 1 | 0.012 | 0.22 |
Acknowledgement
This work was supported by the Department of Atomic Energy through the Board of Research in Nuclear Sciences, India (Grant No. 2001/37/16/BRNS).
References
- (1) G. Bastard, Phys. Rev. B 24, 4714 (1981).
- (2) Garnett W. Bryant, Phys. Rev. B 29, 6632 (1984).
- (3) Garnett W. Bryant, Phys. Rev. B 31, 7812 (1985).
- (4) Jia-Lin Zhu, Jia-Jiong Xiong, Bing-Li Gu, Phys. Rev. B 41, 6001 (1990).
- (5) Zhigang Xiao, Jiqian Zhu and Fengai He, J. Appl. Phys. 79, 9181 (1996).
- (6) F. J. Ribeiro and A. Latge, M. Pacheco, Z. Barticevic, J. Appl. Phys. 82, 270 (1997).
- (7) A. Corella-Madueno and R. Rosas, J. L. Marin and R. Riera, J. Appl. Phys. 90, 2333 (2001).
- (8) V. Ranjan and Vijay A. Singh, J. Appl. Phys. 89, 6415 (2001).
- (9) Tao Pang and Steven G. Louie, Phys. Rev. Lett. 65, 1635 (1990).
- (10) Jia-Lin Zhu, Jie-Hua Zhao, Wen-Hui Duan and Bing-Lin Gu, Phys. Rev. B 46, 7546 (1992).
- (11) Jia-Lin Zhu, Jie-Hua Zhao and Jia-Jiong Xiong, Phys. Rev. B 50, 1832 (1994).
- (12) Manoj K. Harbola and Viraht Sahni, Phys. Rev. Lett. 62, 489 (1989).
- (13) W. Kohn and L. J. Sham, Phys. Rev. 140, A1133 (1965).
- (14) O. Gunnarsson and B. I. Lundqvist, Phys. Rev. B 13, 4274 (1976).
- (15) Viraht Sahni, Yan Li and Manoj K. Harbola, Phys. Rev. A 45, 1434 (1992).
- (16) V. Ranjan, R. K. Pandey, Manoj K. Harbola and Vijay A. Singh, Phys. Rev. B 65, 045317 (2002).
- (17) R. K. Pandey, Manoj K. Harbola and Vijay A. Singh, Phys. Rev. B 67, 075315 (2003).
- (18) M. Singh, V. Ranjan and Vijay A. Singh, Int. J. Mod. Phys. B 14, 1753 (2000).
- (19) J. F. Janak, Phys. Rev. B 18, 7165 (1978).
- (20) R. N. Bhargava and D. Gallagher, X. Hong and A. Nurmikko, Phys. Rev. Lett. 72, 416 (1994).
- (21) The size in and binding energy in are converted as follows: Size in is obtained from the relation and binding energy in is obtained from the relation . For GaAs, and . This gives one unit of size and binding energy for GaAs equal to 9.95 and 11.5 respectively. Thus, and . For ZnS, and . This gives one unit of size and binding energy for ZnS equal to 0.726 and 223.2 respectively. Thus, and .
- (22) James R. Heath and Mark A. Ratner, Physics Today 56 (5), 43 (2003).
- (23) Vijay A. Singh and V. Ranjan, in Physics of Semiconductor Devices, eds. V. Kumar and S. K. Agarwal, pg. 69 - 76, Narosa Publishing House, London (1998).