Complex lithium ion dynamics in simulated LiPO3 glass studied by means of multi-time correlation functions
Abstract
Molecular dynamics simulations are performed to study the lithium jumps in LiPO3 glass. In particular, we calculate higher-order correlation functions that probe the positions of single lithium ions at several times. Three-time correlation functions show that the non-exponential relaxation of the lithium ions results from both correlated back-and-forth jumps and the existence of dynamical heterogeneities, i.e., the presence of a broad distribution of jump rates. A quantitative analysis yields that the contribution of the dynamical heterogeneities to the non-exponential depopulation of the lithium sites increases upon cooling. Further, correlated back-and-forth jumps between neighboring sites are observed for the fast ions of the distribution, but not for the slow ions and, hence, the back-jump probability depends on the dynamical state. Four-time correlation functions indicate that an exchange between fast and slow ions takes place on the timescale of the jumps themselves, i.e., the dynamical heterogeneities are short-lived. Hence, sites featuring fast and slow lithium dynamics, respectively, are intimately mixed. In addition, a backward correlation beyond the first neighbor shell for highly mobile ions and the presence of long-range dynamical heterogeneities suggest that fast ion migration occurs along preferential pathways in the glassy matrix. In the melt, we find no evidence for correlated back-and-forth motions and dynamical heterogeneities on the length scale of the next-neighbor distance.
pacs:
66.30.DnI Introduction
In view of numerous technological applications and a large variety of phenomena, recent scientific work repeatedly focused on glassy ion conductors. On the one hand, it is well known that the macroscopic charge transport in these materials results from the diffusion of mobile ions in a basically rigid glassy matrix, on the other, a detailed microscopic picture of this dynamical process is still lacking. One key feature of the dynamics in glassy ion conductors is the non-exponential relaxation of the mobile ions, indicating the complexity of the motion. For instance, broad loss peaks are found in dielectrical and mechanical relaxation experiments Moynihan ; Angell ; Sidebottom ; Green1 ; Green2 . Moreover, when the dynamics of the mobile ions are studied by means of advanced nuclear magnetic resonance (NMR) techniques, non-exponential correlation functions are observed Kreta ; Bunsen ; Spiess ; Boehmer . In general, the origin of non-exponential relaxation can be twofold 12 . In the homogeneous scenario, the dynamics of all particles are characterized by the same relaxation function that is intrinsically non-exponential due to a specific mechanism of the motion, e.g., correlated back-and-forth jumps. Contrarily, in the heterogeneous scenario, all particles relax exponentially, i.e., there are no correlated back-and-forth jumps, but a distribution of correlation times exists. In our case of a complex motion, one may expect that both homogeneous and heterogeneous dynamics contribute to the non-exponential relaxation.
A strong frequency dependence of the electrical conductivity of ion conductors indicates that back-and-forth motions occur during ionic diffusion Jonscher ; Martin ; Ingram ; Elliot ; Ngai ; Funke ; Roling . However, to study a complex motion in detail, it is not sufficient to probe the dynamics at two times, but one has to resort to multi-time correlation functions 12 . For example, three-time correlation functions can be used to quantify the extent to which the non-exponential relaxation results from the homogeneous and the heterogeneous scenario, respectively Heuer . Four-time correlation functions allow one to measure the lifetime of dynamical heterogeneities, i.e., the timescale of exchange processes between fast and slow ions. Two methods have recently proven well suited to record multi-time correlation functions for glassy ion conductors. While ion dynamics on the timescale can be studied in molecular dynamics (MD) simulations MD2 , multi-dimensional NMR techniques probe jumps on a timescale of . Specifically, multi-dimensional 109Ag NMR experiments showed that a broad rate distribution governs the jumps of silver ions in silver phosphate based glasses Bunsen . Hence, both correlated back-and-forth jumps and dynamical heterogeneities indeed contribute to the non-exponentiality. However, to the best of our knowledge the relevance of both contributions has not yet been quantified for glassy ion conductors.
MD simulations are an ideal tool to investigate dynamical processes on a microscopic level. Prior work on the origin of the non-exponential relaxation in glassy ion conductors has focused on alkali silicate glasses. For lithium silicate glasses, it was reported that dynamical heterogeneities contribute to the non-exponential relaxation of the lithium ions where the lifetime of these heterogeneities is limited MD2 ; Habasaki . Further, back-and-forth motions on various length scales were observed, including a backward correlation beyond the first neighbor shell at low temperatures MD2 . For sodium silicate glasses, no evidence for back-and-forth jumps between adjacent sodium sites was found at higher temperatures Kob . Moreover, several workers demonstrated that, though there is no micro-segregation, the sodium ions follow preferential pathways in the glassy matrix Jund ; Horbach . The sodium ions inside these channels show a higher mobility than the ones outside and, hence, dynamical heterogeneities exist Sunyer . In addition, studying examples of ionic trajectories the mechanism of alkali ion migration in silicate glasses was described as ”vacancy-like process” Cormack . During a correlated motion of two cations, an alkali site is left by one ion an occupied by another.
In the present work, we use MD simulations to analyze the complex mechanism of ion dynamics in an alkali phosphate glass. In this way, we intend to complement the prior studies on silicate glasses and to compare the nature of ion diffusion in different amorphous materials. Moreover, based on an analysis of novel higher-order correlation functions, new information about this dynamical process is revealed. In detail, the dynamics of non-crystalline LiPO3 is investigated in a temperature range where the motions of the various atomic species strongly decouple upon cooling. While the lithium ionic subsystem can be equilibrated at all chosen temperatures, the diffusion of the phosphorus and the oxygen particles freezes in on the ns-timescale of the simulation. In other words, the dynamics in the melt and in the glass are studied. Our main goal is to identify the temperature dependent origin of the non-exponential relaxation of the lithium ions. For this purpose, we calculate multi-time correlation functions that link the positions of single ions at subsequent points in time. In this way, we quantify the homogeneous and the heterogeneous contributions to the non-exponential relaxation and measure the lifetime of the dynamical heterogeneities. Since the multi-time correlation functions observed in NMR experiments on solid ion conductors and some of the quantities computed in the present study have a similar information content, a future comparison of the respective results is very promising.
II Details of the simulation
The potential used to describe the interaction of the ions in LiPO3 can be written as the sum of a Coulomb and a Born-Mayer-Huggins pair potential
| (1) |
where is the distance between two ions of type and type , respectively. The potential parameters, except for , are adopted from the work of Karthikeyan et al. Kart . Here, is reduced to obtain a more realistic interatomic distance , cf. below. In detail, we use effective charges , and as well as . The parameters are listed in Tab. 1. Most simulations are performed in the NEV ensemble for particles. To take into account the thermal expansion of phosphate glasses, the density is fixed at as compared to observed in experiments at room temperature Muru . This approximation for the density at higher temperatures is obtained based on the linear expansion coefficient of LiPO3 glass English . In addition, we consider systems with and to check for finite size effects. Moreover, some simulations are performed at ”constant pressure” to enable a comparison with experimentally determined activation energies. Strictly speaking, we continue doing runs in the NEV ensemble, but the size of the simulation box is adjusted so that a pressure is obtained at all temperatures. This procedure results in a decrease of the density from at to at . The equations of motion are integrated using the velocity form of the Verlet algorithm with a time step of . Further, periodic boundary conditions are applied and the Coulombic forces are calculated via Ewald summation. In doing so, consistent results are obtained when computing the trajectories with the programme MOLDY Refson and an own MD simulation programme, respectively. While the whole system can be equilibrated at , the phosphate glass matrix is basically frozen on the timescale of the simulation at lower temperatures. In the latter cases, we pay attention that the lithium ionic subsystem is still in equilibrium. For example, the sample is equilibrated for at before recording the data.
Karthikeyan et al. Kart demonstrated that the structure of LiPO3 glass is well reproduced when using the two-body potential specified in Eq. 1. We confirmed this result by analyzing the structure of the glass obtained after a quench from to . Tab. 1 shows that the interatomic distances are in good agreement with the corresponding experimental values Muru ; Beaufils . Typical of phosphate glasses Hoppe , the P-O distance for tangling oxygens () is shorter than for bridging oxygens (). Further, the reduction of , as compared to the value used by Karthikeyan et al. Kart , improves the agreement with the actual distance Muru ; Beaufils . Consistent with experimental findings for LiPO3 glass Hoppe ; Brow ; Wullen , the bond-angle distributions and the coordination numbers indicate that the simulated glass consists of well defined phosphate tetrahedra that are connected by two of their corners to form long chains and/or rings. Concerning the intermediate range order, some differences between simulated and actual LiPO3 glass may exist. In agreement with results by Karthikeyan et al. Kart , we find a mean P-O-P bond angle that is smaller than the one observed in experiments on vitreous P2O5 Hoppe . To fix this mean angle at the experimental value for vitreous P2O5, Liang et al. Alam used a three-body potential in simulations of LiPO3 glass. We refrain from doing so because, first, the P-O-P bond angle in meta-phosphate glasses has not yet been determined experimentally and, second, three-body interactions distinctly slow down the simulation. For our analysis, it is important to perform simulations at sufficiently low temperatures, because not until then lithium dynamics show several characteristic features, e.g., back-and-forth jumps between adjacent sites MD2 ; MD1 . Therefore, we keep the potential as simple as possible so as to be able to equilibrate the system at these temperatures.
III Results
To study the dynamics of non-crystalline LiPO3, we first display the mean square displacement (MSD) of the lithium ions
| (2) |
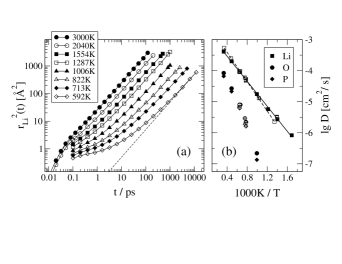
in Fig. 1(a). Throughout this article, the brackets denote the average over the lithium ionic subsystem, is the displacement of lithium ion during a time interval and specifies its position at the time . At temperatures , exhibits three characteristic time regimes: ballistic motion at short times , sublinear diffusion due to back-and-forth motions of the lithium ions at intermediate times and linear diffusion at long times. Upon cooling the diffusion of the lithium ions slows down and the time window of sublinear diffusion is extended. A qualitatively similar behavior is found for the MSD of the oxygen and the phosphorus ions, and (not shown).
The diffusion constants extracted from the long-time behavior of are compiled in Fig. 1(b). Evidently, the lithium diffusion decouples from the oxygen and the phosphorus dynamics. While follows an Arrhenius law with activation energy , the curves show a downward bending. In particular, on the -timescale of our simulation, a basically rigid phosphate glass matrix exists below . Therefore, we refer to as the computer glass transition of LiPO3. For comparison, the diffusion constants resulting from the calculations for and and from the constant pressure simulations are also included in Fig. 1(b). We find no indication that the diffusion constants depend on the system size. On the other hand, the temperature dependence of in the constant pressure runs () is stronger than in the constant volume simulations.
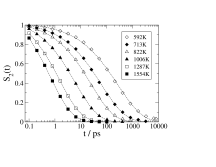
Next, the incoherent intermediate scattering function for the lithium ions is considered:
| (3) |
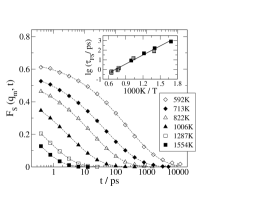
In our case of an isotropic sample, this function only depends on the absolute value, , of the wave vector. To obtain information about dynamical processes on the length scale of the Li-Li interatomic distance, is used. Fig. 2 shows for the NEV ensemble (). We see temperature dependent, non-exponential decays. These findings can be quantified by fitting the data to a Kohlrausch-Williams-Watts (KWW) function KWW , . Then, a stretching parameter characterizes the non-exponentiality at . Above , an increase to is observed, however, the absence of a short-time plateau of leads to larger error bars in this temperature range. In the inset of Fig. 2, we display the mean time constants calculated from the fit parameters according to where is the -function. Though there are some deviations, the temperature dependence of can still satisfactorily be described by an Arrhenius law with activation energy . In the same way, is obtained from the constant pressure simulations. Thus, in both cases, is significantly larger than . In addition, Fig. 2 shows that the time constants do not depend on and, hence, finite size effects are again absent. In the remainder of this article, we analyze the data from constant volume simulations for .
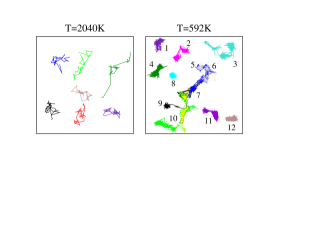
To study the mechanism of lithium dynamics, we first look at some representative trajectories. Fig. 3 displays projections on the -plane for trajectories during comparable time intervals at and . While the mechanism of the motion resembles liquid-like diffusion at the high temperature, it is rather complex in the glass. Specifically, the following features are obvious for : (i) The motion of most lithium ions can be decomposed into local vibrations and jumps between adjacent sites. (ii) The lithium ions show different mobilities. (iii) Back-and-forth dynamics involve distinct lithium sites. (iv) The number of correlated back-and-forth jumps varies. While numerous back-and-forth jumps are observed for ion 4, only a few are found for ion 3. (v) Several ions (6-10) follow the same preferential pathway. Consistent with the results of simulations on alkali silicate glasses MD1 ; Manalang ; Kieffer ; Smith , all these features elucidate the complexity and the diversity of ionic diffusion in glasses.
A statistical analysis of the mechanism of the motion is possible based on the self part of the van Hove correlation function for the lithium ions. It is given by Hansen
| (4) |
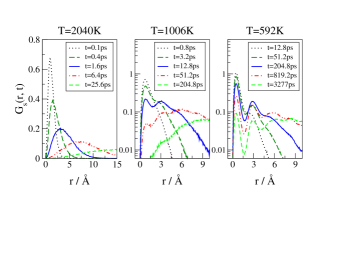
where denotes the -function. measures the probability that a lithium ion moves a distance in a time interval . Fig. 4 shows for three characteristic temperatures. For , we observe a single maximum that shifts to larger values of when is increased. Though the findings resemble expectations for liquid-like diffusion, an asymmetry of the curves for indicates deviations. For , exhibits oscillations that become more pronounced upon cooling. Specifically, there are minima at and together with a maximum at . Thus, the glassy network provides well defined lithium sites that are separated by energy barriers so that, to a good approximation, the lithium ionic motion can be described as a sequence of hopping processes, i.e., the timescale it takes to cross the barriers is much shorter than the timescale the ions fluctuate about the sites. In particular, it is possible to distinguish between ions that, after a time , (i) still reside at the same site (), (ii) have jumped to a next-neighbor site () and (iii) have moved beyond an adjacent site (). These findings for agree with both the appearance of the trajectories in Fig. 3 and the results of previous simulations MD2 ; MD1 ; Smith ; Bala ; Habasaki2 ; Park ; Horbach2 .
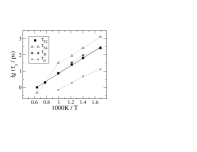
Next, we define the two-time correlation function where for and otherwise. In our case of hopping motion, measures the probability that a lithium ion is still at the initial site after a time . Thus, it directly reflects the depopulation of the initially occupied lithium sites. In Fig. 5, we see that decays non-exponentially. This non-exponentiality can result from correlated back-and-forth jumps between neighboring sites and/or from dynamical heterogeneities, i.e., the presence of a distribution of jump rates. Based on an appropriate three-time correlation function , both contributions will be quantified later in this article. The average time it takes for the lithium ions to successfully escape from their sites, i.e., the timescale of the depopulation of the sites, can be characterized by the 1/e-decay time of , . Fig. 6 shows that the temperature dependence of is well described by an Arrhenius law with activation energy .
In the remainder of this article, the origin of the non-exponential relaxation of the lithium ions in simulated LiPO3 glass is studied in detail by analyzing various multi-time correlation functions. All these functions correlate the positions of single lithium ions at subsequent times . To characterize the motion of ion between two times , we use the notation , , and .
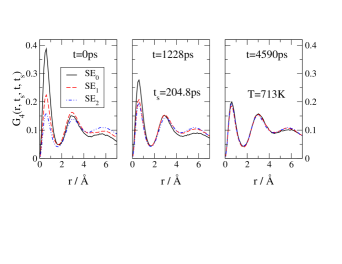
To show the existence of dynamical heterogeneities and to study their lifetime, we define a ”four-time van Hove correlation function”
| (5) |
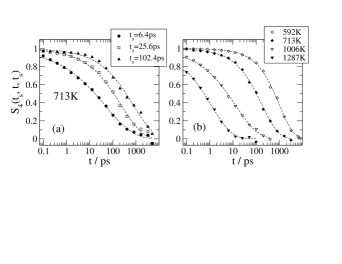
In this equation, the term simply means that three subensembles are selected with respect to the displacement during the time interval : SE0 consists of ions that are still at the initial site (), SE1 contains the ones that have jumped to an adjacent site () and the ions of SE2 show . Thus, probes the van Hove correlation function of the respective subensembles starting at a time after their selection. The results for and various at are displayed in Fig. 7. For , the three subensembles show clearly different . In particular, the first peak is highest for SE0, indicating that ions that have not escaped from their sites during move also less then the average particle in the time interval . In other words, slow and fast ions are distinguishable and, hence, dynamical heterogeneities exist 12 . An extension of , i.e., of the delay between selection and detection, allows us to study the lifetime of the dynamical heterogeneities. In Fig. 7, we see that the curves for the different subensembles approach each other when is increased until they are nearly identical after a time . At this time , the decay of is just complete, cf. Fig. 5. Thus, the information about the initial dynamical states is lost when all ions have successfully escaped from their sites, i.e., the dynamical heterogeneities are short-lived. A more detailed analysis of the lifetime of the dynamical heterogeneities will be presented below.
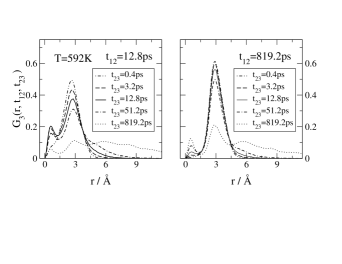
For a study of back-and-forth jumps, we focus on lithium ions that have moved to a neighboring site during and map their motion in the subsequent time interval . This analysis is possible based on the ”three-time van Hove correlation function”
| (6) |
where for and otherwise. measures exclusively for ions that occupy a next-neighbor site at the time . is different from zero only in the range . For , backward jumps towards the initial positions yield the intensity at , whereas forward jumps contribute to the intensity at . Hence, when multiple jumps are negligible, i.e., for , the ratio provides information whether the subsequent motion is backward or forward correlated. In Fig. 8, we display at for and various . Nearly independent of , integration yields for and for . While the former ratio indicates a significant backward correlation, the latter is comparable to as expected for a random-walk based on a mean coordination number . For an interpretation of these results, it is useful to recall the existence of dynamical heterogeneities and to reinspect Fig. 4. It becomes clear that the population at the neighboring site is still small after a time and, hence, it mainly results from the fast ions. Vice versa, ions with a medium or a low mobility occupy an adjacent after a time . Hence, the curves for and reflect the behavior of fast and non-fast ions, respectively. We conclude that a significantly enhanced back-jump probability exists for the fast ions, but not for the slow ions.
One may argue that large-amplitude vibrations can also lead to for short . However, one expects that displacements due to vibrations are limited by and, hence, a significant contribution of this type of motion would result in an asymmetry of . Therefore, the nearly symmetric shape of shows that large-amplitude vibrations do not affect our conclusion. The finding that the back-jump probability depends on the dynamical state is backed up by preliminary results of a more detailed analysis. There, we explicitly identify the lithium sites and calculate the back-jump probability as a function of the waiting time at the initial site, . Consistent with results for LiSiO2 Lammert , we find that significantly decreases with increasing waiting time. Thus, a high backward correlation exists exclusively for ions that show a high jump rate at the initial site.
The length scales of the dynamical heterogeneities and of the correlated back-and-forth motions can be studied based on the conditional probability functions and . These functions measure the probability to find specific values and , respectively, provided the particle has moved a distance in the first time interval . Here, is the projection of on the direction of the motion during , i.e., and is the projection of on an arbitrary direction perpendicular to . Motivated by the outcome of prior work MD2 ; Doliwa ; Quian , we focus on the first moment as well as on the second moments and , rather than analyzing the full probability functions.
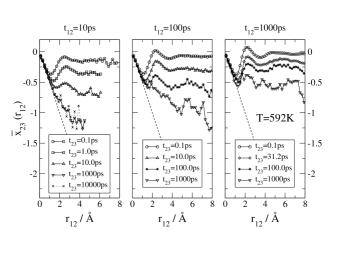
For the first moment, will result if the directions of the motions during and are uncorrelated Doliwa ; Quian . In contrast, if the subsequent motion for a given is backward (forward) correlated, a negative (positive) value of will be observed. In particular, it has been readily shown that is found for stochastic dynamics in a harmonic potential MD2 . Fig. 9 shows for . For all and , follows the curve up to , indicating that the lithium sites can be described by harmonic potentials on this length scale. At larger , depends on both and . For a given , is more negative the lager the value of until a saturation is reached at . This can be understood as follows: No significant motion occurs during short time intervals so that . However, when is extended, more and more lithium ions show a distinct displacement until the average behavior of all ions with a given is observed for long . To study this average behavior we further discuss the results for a long . In this case, is basically constant at for , whereas, for , a decrease over the whole accessible range indicates that the backward correlation increases even beyond the interatomic distance . A comparison with Fig. 4 shows that, for , the findings in the range , say, reflect the behavior of fast ions, while an ion with an average mobility shows such displacements during a time interval . Thus, the decrease of at for short implies that the correlated back-and-forth motions of fast ions may involve not only one, but also several sites. On the other hand, at for long again shows that the non-fast ions perform local rattling motions, but no correlated back-and-forth jumps between adjacent sites. We add that at and at are found for LiPO3 melt at (, ). Qualitatively, these findings resemble the outcome of MD simulations on supercooled liquids Doliwa ; Quian . There, the results were interpreted as a signature of the cage effect describing that, though all particles are mobile, every particle is temporarily captured in a cage built up by its neighbors. Then, back-and-forth motions take place within the cage, but not when the particles have left their cages.
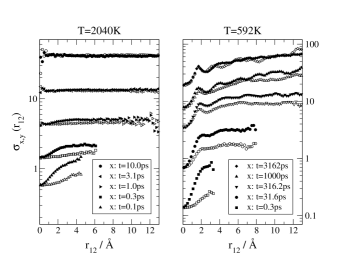
Now, we turn to the second moments. If all particles have equal mobility, the displacements and are uncorrelated so that . In contrast, if dynamical heterogeneities exist, on average, slow and fast ions show small and large , respectively. Hence, ions with small move less in than those with large and increases. Fig. 10 shows and for various time intervals at two temperatures. For , the second moments are equal and independent of for , indicating the absence of dynamical heterogeneities related to lithium diffusion. In contrast, and for increase, though, with a different slope and, thus there are highly anisotropic dynamical heterogeneities on short timescales. Since , cf. Fig. 1, we attribute the latter dynamical heterogeneities to the rattling motions within the local cages. For , a strong dependence of is observed for all chosen . This finding again implies the existence of dynamical heterogeneities attributed to lithium diffusion in the glass. Since back jumps during result in and , i.e., the component perpendicular to the direction of the forward jump is small, the dynamical heterogeneities can be most directly studied based on . The ratio shows that the heterogeneity results for the most part from different jump rates at neighboring lithium sites. However, additional contributions on a length scale of several Li-Li interatomic distances are indicated by a further increase of up to for . Considering also the appearance of the lithium trajectories in Fig. 3, we suggest that preferred pathways of ion migration connect several lithium sites.
The oscillatory behavior of and allows us to study the energy landscape governing the lithium dynamics. For , one expects local minima (maxima) near positions where the slope of the potential shows maxima (minima) MD2 . In Fig. 9, we see that shows a minimum at and a maximum at . Hence, there should be an energy barrier at an average distance . At , the curves exhibit local maxima. This is reasonable, because ions residing at a saddle after should possess a comparatively high mobility in the subsequent time interval. A closer inspection of the data reveals that the maxima of shift to smaller when is extended. As will be discussed later in this article, this finding is consistent with the assumption that the Li-Li interaction depends on the waiting time at a site.
To quantify the homogeneous and the heterogeneous contributions to the non-exponential relaxation of the lithium ions we define the three-time correlation function
| (7) |
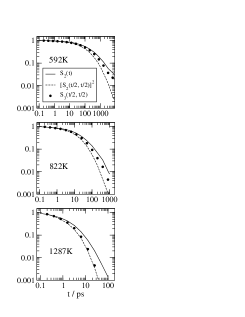
For purely homogeneous and purely heterogeneous relaxation, such three-time correlation functions can be expressed by the corresponding two-time correlation functions Heuer ; Doliwa ; Tracht ; TrachtDR . While is valid in the homogeneous scenario, holds in the heterogeneous scenario, cf. Appendix A. In Fig. 11, is shown for three temperatures. For , implies that the relaxation is basically homogeneous. However, above , hopping dynamics is not a good approximation for the mechanism of the motion and the phosphate matrix dynamics modifies the lithium sites. Therefore, our findings do not indicate back-and-forth jumps between adjacent lithium sites, but rather they reflect back-and-forth motions that are affected by the matrix dynamics and take place on various length scales. At , clearly deviates from and, hence, dynamical heterogeneities become increasingly important upon cooling. Their relevance can be further analyzed based on the ratio
| (8) |
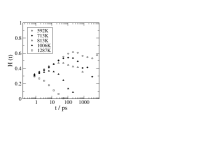
It is easily seen that and hold for purely heterogeneous and purely homogeneous dynamics, respectively. In Fig. 12, is displayed for the studied temperatures. Evidently, the non-exponentiality at low temperatures results to a large extent from dynamical heterogeneities, i.e., there is a broad distribution of jump rates. For , the curves show a maximum at a time that increases upon cooling. Inspecting the temperature dependence of in Fig. 6, is found. Thus, the distribution of jump rates contributes most to the non-exponentiality when the lithium ions successfully escape from their sites.
The lifetime of the dynamical heterogeneities can be measured based on the four-time correlation function
| (9) |
In this experiment, a dynamical filter selecting lithium ions that are slow on the timescale slow is applied during two time intervals and separated by a time . Thus, is given by the fraction of lithium ions that are slow during and a time later during . Consequently, the signal decreases when slow ions become fast in the time interval and mapping allows us to measure the timescale of the exchange of the dynamical state. In Fig. 13, various normalized correlation functions are compiled. In panel (a), we show results for different filter times at and, in panel (b), we display data for comparable at various temperatures (). For the normalization, was fitted to a modified KWW function, , and scaled according to . Evidently, depends on both the filter time and the temperature where all decays are non-exponential. The non-exponentiality indicates that the exchange processes between slow and fast ions cannot be described by a single time constant, but are rather
governed by a broad distribution of exchange times. Further, since dynamically diverse subensembles are selected for different filter times , the dependence on this parameter implies that the exchange time depends on the dynamical state itself. A comparison with Fig. 5 reveals that the decays of and are complete at comparable times. In accordance with the interpretation of , this finding shows that the information about the initial dynamical states is lost when all lithium ions have successfully escaped from their sites. The mean time constants , i.e., the mean exchange times, can be calculated from the parameters of the KWW fits to . Revisiting Fig. 6 we see that and show a similar temperature dependence at . All these findings consistently indicate that the exchange of the dynamical state in the glass results from successful jumps among neighboring lithium sites. Above , a stronger temperature dependence of is observed. Hence, the modification of the lithium sites due to matrix dynamics provides another channel for the exchange of the dynamical state in the melt.
IV Discussion
In this article, we presented MD simulations performed to study the dynamics of non-crystalline LiPO3 in a temperature range where the motions of the various atomic species strongly decouple, i.e., the dynamics in the melt () and in the glass () were compared. We found that the mechanism of the lithium motion changes from liquid-like diffusion to hopping dynamics when the temperature is decreased. Our main goal was to study the lithium ionic jumps at . Non-exponential two-time correlation functions, such as the incoherent intermediate scattering function, and sublinear diffusion over several orders of magnitude in time reflect the complexity of the lithium motion in a rigid phosphate glass matrix. For a comprehensive analysis of this dynamical process, we calculated suitable multi-time correlation functions. Three time-correlation functions showed that the non-exponential relaxation of the lithium ions at results from both correlated back-and-forth jumps and the existence of dynamical heterogeneities, i.e., the presence of a distribution of jump rates. Measuring the lifetime of the dynamical heterogeneities by means of four-time correlation functions, we found that the non-uniformities of the motion are short-lived. In what follows, we summarize and discuss our results in more detail where the quantities that lead to the respective conclusion are indicated in brackets.
The dynamical heterogeneities at show the following features: (i) The distribution of jump rates contributes more to the non-exponentiality the lower the temperature (, ). (ii) For a given temperature, its contribution is maximum when the lithium ions successfully escape from their sites (). (iii) The exchange between the fast and the slow ions of the distribution takes place on the same timescale as the lithium jumps, i.e., the dynamical heterogeneities are short-lived (, ). In particular, both processes show a similar temperature dependence (). (iv) The timescale of the exchange depends on the dynamical state itself (). (v) The dynamical heterogeneities mainly result from different jump rates at neighboring sites, but there are also non-uniformities of the motion on a length scale (). The back-and-forth jumps of the lithium ions in the glass can be characterized as follows: (i) Correlated back-and-forth jumps occur for the fast ions of the distribution, but not for the slow ions, i.e., the back-jump probability depends on the initial dynamical state (, ). (ii) For highly mobile ions, there is a backward correlation even beyond the first neighbor shell (). Well above , dynamical heterogeneities and back-and-forth motions on the length scale are absent (, ). However, due to the temporary caging of the lithium ions by the neighboring particles, anisotropic dynamical heterogeneities and a backward correlation exist on short length- and timescales.
We conclude that the formation of well-defined lithium sites is accompanied by the emergence of correlated back-and-forth jumps and dynamical heterogeneities on a length scale . At the lower temperatures, the non-exponential depopulation of the lithium sites results to a large extent from the dynamical heterogeneities and, hence, the distribution of jump rates is broad. The short lifetime of the dynamical heterogeneities implies that sites featuring fast and slow lithium dynamics, respectively, are intimately mixed. In particular, the absence of long-lived heterogeneities excludes a micro-segregation of the glass into extended clusters in which the lithium ions are mobile and immobile, respectively. Instead, we suggest that the broad distribution of jump rates in LiPO3 glass results from a diversity of the local glass structure at neighboring sites, e.g., from varying coordination numbers. In this basically random energy landscape, fast ion migration occurs along pathways connecting low energy barriers. The presence of such channels is not only indicated by the appearance of the lithium trajectories, but also by the existence of long-range dynamical heterogeneities and by the backward correlation beyond the first neighbor shell for the fast ions.
Some of our findings are recovered when analyzing the dynamics resulting from schematic models such as the random-barrier and the random-energy model where the particles move in a time-independent, external energy landscape. For example, the particles migrate along preferential pathways in these models and percolation approaches have been applied to describe the dynamics at low temperatures Dyre ; Baranovskii ; Efros . Moreover, the back-jump probability depends on the dynamical state of a particle, e.g., for the random-barrier model, many back-and-forth jumps occur over low energy barriers, whereas slow ions cross high barriers so that a backward motion is unlikely. However, other features of the lithium dynamics in LiPO3 glass are not reproduced in schematic models. At variance with our findings, cf. Fig. 12, a straightforward calculation shows that is obtained for these models. Furthermore, we observe that the first maximum of lies at and shifts towards shorter distances when is increased, cf. Fig. 10. This means that, in contrast to what is captured in simple models, the energy barriers crossed by the fast lithium ions of the distribution are located at larger distances than the ones overcome by the slow ions. We speculate that simple hopping models are suited to study the time-independent effects of the glassy matrix on the lithium ionic diffusion, but they fail in modelling the influence of the time-dependent Li-Li interactions. For example, we want to demonstrate that our findings for the position of the energy barrier can be explained when assuming that the Li-Li interaction decreases with the waiting at a site due to the adjustment of the neighboring lithium ions. For simplicity, we consider a lithium ion that occupies a site at and experiences a potential . Here, the first and the second term are meant to mimic the contribution from the glassy matrix and from the repulsion due to other lithium ions (), respectively. A Taylor expansion for shows that the maximum of this potential lies at . Hence, for , this simple model yields a maximum at that is located at smaller distances the larger the value of the waiting time as observed in our simulations.
Comparing the results of MD simulation studies on phosphate and silicate glasses several similar features of cation dynamics are striking: (i) It is widely accepted that cation diffusion at sufficiently low temperatures can be described as a sequence of hopping processes MD2 ; MD1 ; Smith ; Bala ; Habasaki2 ; Park ; Horbach2 . (ii) consistently shows non-exponential decays that are well described by KWW functions with stretching parameters Horbach ; MD1 . (iii) Dynamical heterogeneities with a limited lifetime exist Habasaki that become more pronounced when the temperature is decreased MD2 . (iv) Fast ion transport along preferential pathways takes place Jund ; Sunyer . (v) A high back-jump probability exists for the fast ions of the distribution, but not for the slow ions Lammert . On the other hand, in previous work on sodium silicate glasses Kob , correlated back-and-forth jumps were not observed at somewhat higher temperatures. However, since, a high back-jump probability exists only for the fast ions at sufficiently low temperatures, the percentage of ions showing correlated back-and-forth jumps may have been too small to be detected in the study by Sunyer et al. Kob . Altogether, though it is to be further clarified to which extent the findings of MD simulations reflect the dynamics in a specific system at lower temperatures, the similarity of the simulation results for various interaction potentials suggests that the mechanism of cation dynamics in various glassy ion conductors is highly comparable.
Finally, we compare our results with experimental findings. First, it can be noted that two-time correlation functions of lithium dynamics obtained in experiments and simulations for LiPO3 glass show a similar non-exponentiality. Specifically, the stretching parameter found here compares well to observed in electrical and mechanical relaxation studies Sidebottom ; Green1 ; Green2 ; Martin and in multi-dimensional 7Li NMR experiments NMR . Further, in these measurements, an activation energy was obtained for the lithium dynamics. Comparing this value with the results of our constant pressure simulations good agreement is found for , but significant differences must be noted for . For the moment, it is not clear where the difference between and results from. Since similar deviations were reported in MD simulation studies of LiSiO2 glass MD2 , one may speculate that they are a consequence of the complexity of ion dynamics in glasses.
In addition, our findings are useful for the interpretation of experimental results on the origin of the non-exponential relaxation of the mobile ions in solid ion conductors. Multi-dimensional 109Ag NMR experiments on glassy and crystalline silver ion conductors Bunsen ; PRL showed that the non-exponential silver ionic relaxation is due to the existence of a broad distribution of jump rates rather than to correlated back-and-forth jumps. On the other hand, the presence of correlated back-and-forth motion is indicated by a frequency dependence of the electrical conductivity Jonscher ; Martin ; Ingram ; Elliot ; Ngai ; Funke ; Roling . We suggest that this apparent discrepancy can be cleared up based on the present results. Specifically, we found that, first, the back-jump probability depends on the dynamical state, see also Lammert , and, second, the contribution of the dynamical heterogeneities to the non-exponentiality increases upon cooling. Since is dominated by the fast ions, we expect a disproportional contribution from the correlated back-and-forth jumps of ions in this dynamical state. In contrast, multi-dimensional NMR experiments probe the behavior of non-fast ions at low temperatures and, hence, if at all, back-and-forth jumps should be of minor relevance.
In summary, various techniques have to be applied simultaneously to obtain a complete picture of a complex dynamical process such as ion dynamics in solids. In particular, a further comparison of results obtained in MD simulations and in multi-dimensional NMR experiments is very promising since both techniques allow one to study a dynamical process on a microscopic level. For such a comparison, the multi-time correlation functions , and can be particularly useful, because their information content is similar to the one of the corresponding quantities in NMR experiments.
Acknowledgements.
The author thanks S. C. Glotzer, A. Heuer and J. Kieffer for a generous grant of computer time and many stimulating discussions. Founding by the Deutsche Forschungsgemeinschaft (DFG) in the frame of the Emmy-Noether Programm is gratefully acknowledged.Appendix A Calculation of three-time correlation functions
It is well established for supercooled liquids that, for purely homogeneous and purely heterogeneous relaxation, three-time correlation functions comparable to can be expressed by the corresponding two-time correlation functions Heuer ; Doliwa ; Tracht ; TrachtDR . Here, follows, because no selection is possible for purely homogeneous dynamics. Hence, the dynamics during and , respectively, are statistically independent so that the joint probability for an escape in neither time interval can be written as a product. If this was not true a dynamically diverse subensemble could be selected based on the motion in the first time interval and, thus, dynamical heterogeneities would exist. For purely heterogeneous dynamics, the correlation functions result from a superposition of the contributions of exponentially relaxing subensembles. For the subensemble characterized by a correlation time , one has
The second equals sign is due to the definition of the exponential function, and the third results, because the relation for purely homogeneous dynamics holds for the exponentially relaxing, undecomposable subensembles. Since is valid for all subensembles, follows.
References
- (1) C. T. Moynihan, L. P. Boesch and E. L. Laberge, Phys. Chem. Glasses 14, 122 (1973)
- (2) C. Liu and C. A. Angell, J. Non-Cryst. Solids 83, 162 (1986)
- (3) D. L. Sidebottom, P. F. Green and K. L. Brow, J. Non-Cryst. Solids 183, 151 (1995)
- (4) P. F. Green, D. L. Sidebottom, R. K. Brow and J. J. Hudgens, J. Non-Cryst. Solids 231, 89 (1998)
- (5) P. F. Green, E. F. Brown and R. K. Brow, J. Non-Cryst. Solids 255, 87 (1999)
- (6) M. Vogel, C. Brinkmann, A. Heuer and H. Eckert, J. Non-Cryst. Solids 307-310, 971 (2002)
- (7) M. Vogel, C. Brinkmann, A. Heuer and H. Eckert, Phys. Chem. Chem. Phys. 4, 3237 (2002)
- (8) M. Vogel, C. Brinkmann, A. Heuer and H. Eckert, Solid State Nuclear Magn. Reson. 22, 344 (2002)
- (9) F. Qi and R. Böhmer, Solid State Nucl. Magn. Reson. 22, 484 (2002)
- (10) R. Böhmer, R. V. Chamberlin, G. Diezemann, B. Geil, A. Heuer, G. Hinze, S. C. Kuebler, R. Richert, B. Schiener, H. Sillescu, H. W. Spiess, U. Tracht and M. Wilhelm, J. Non-Cryst. Solids 235-237, 1 (1998)
- (11) A. K. Jonscher, Nature 267, 673 (1977)
- (12) S. W. Martin and C. A. Angell, J. Non-Cryst. Solids 83, 185 (1986)
- (13) M. D. Ingram, Phys. Chem. Glasses 28, 215 (1987)
- (14) S. R. Elliot, Sol. State Ionics 70/71, 27 (1994)
- (15) K. L. Ngai, J. Non-Cryst. Solids 203, 232 (1996)
- (16) K. Funke and C. Cramer, Curr. Opin. Solid State Mater. Sci. 2, 483 (1997)
- (17) B. Roling, A. Happe, K. Funke and M. D. Ingram, Phys. Rev. Lett. 78, 2160 (1997)
- (18) A. Heuer and K. Okun, J. Chem. Phys. 106, 6176 (1997)
- (19) A. Heuer, M. Kunow, M. Vogel and R. D. Banhatti, Phys. Rev. B. 66, 224201 (2002)
- (20) J. Habasaki and Y. Hiwatari, Phys. Rev. E 65, 021604 (2002)
- (21) E. Sunyer, W. Kob and P. Jund, J. Non-Cryst. Solids, 307-310, 939 (2002)
- (22) P. Jund, W. Kob and R. Jullien, Phys. Rev. B 64, 134303 (2001)
- (23) J. Horbach, W. Kob and K. Binder, Phys. Rev. Lett. 88, 125502 (2002)
- (24) E. Sunyer, P. Jund and R. Jullien, Phys. Rev. B 65, 214203 (2002)
- (25) A. N. Cormack, J. Du and T. R. Zeitler, Phys. Chem. Chem. Phys. 4, 3193 (2002)
- (26) A. Karthikeyan, P. Vinatier, A. Levasseur and K. J. Rao, J. Phys. Chem. B 103, 6185 (1999)
- (27) K. Muruganandam, M. Seshasayee and S. Patanaik, Sol. St. Ionics 89, 313 (1996)
- (28) S. English and W. E. S. Turner, J. Am. Ceram. Soc. 13, 182 (1930)
- (29) K. Refson, Comput. Phys. Commun. 126, 310 (2000)
- (30) S. Beaufils, M. Bionducci, C. Ecolivet, R. Marchand and A. Le Sauze, Sol. St. Commun. 116, 687 (2000)
- (31) U. Hoppe, G. Walter, R. Kranold and D. Stachel, J. Non-Cryst. Sol. 263-264, 29 (2000) and refrences therein
- (32) R. K. Brow, J. Non-Cryst. Sol. 263-264, 1 (2000) and references therein
- (33) Leo van Wüllen, H. Eckert and G. Schwering, Chem. Mater. 12, 1840 (2000)
- (34) J.-J. Liang, R. T. Cygan and T. M. Alam, J. Non-Cryst. Solids 263-264, 167 (2000)
- (35) A. Heuer, M. Kunow, M. Vogel and R. D. Banhatti, Phys. Chem. Chem. Phys. 4, 3185 (2002)
- (36) R. Kohlrausch, Pogg. Ann. Phys. 4, 56 (1854); G. Williams and D.C. Watts, Trans. Faraday Soc. 66, 80 (1970)
- (37) M. A. Manalang, D. B. Bergstrom, D. E. Kramer and J. Kieffer, J. Non-Cryst. Solids 169, 72 (169)
- (38) J. Kieffer, J. Non-Cryst. Solids, 172-174, 1285 (1994)
- (39) W. Smith, G. N. Greaves and M. J. Gillan, J. Chem. Phys. 103, 1995 (1995)
- (40) J. P. Hansen, I. R. McDonald, Theory of Simple Liquids, Academic Press, London (1986)
- (41) S. Balasubramanian, K. J. Rao, J. Phys. Chem. 98, 10871 (1994)
- (42) J. Habasaki, J. Non-Cryst. Solids 12, 183 (1995)
- (43) B. Park and A. N. Cormack, J. Non-Cryst. Solids 255, 112 (1999)
- (44) J. Horbach, W. Kob and K. Binder, Chem. Geology 174, 87 (2001)
- (45) H. Lammert, M. Kunow and A. Heuer, submitted to Phys. Rev. Lett.
- (46) B. Doliwa and A. Heuer, Phys. Rev. Lett. 80, 4915 (1998)
- (47) J. Quian, R. Hentschke and A. Heuer, J. Chem. Phys. 110, 4514 (1999)
- (48) A. Heuer, U. Tracht, S. C. Kuebler and H. W. Spiess, J. Molec. Structure 479, 251 (1999)
- (49) U. Tracht, PhD thesis, University of Mainz, Germany (1998)
- (50) Strictly speaking, the dynamical filter selects lithium ions that are at the same site at the beginning and at the end of the filter time .
- (51) J. C. Dyre and T. B. Schroder, Rev. Mod. Phys. 72, 873 (2000)
- (52) S. D. Baranovskii and H. Cordes, J. Chem. Phys. 111, 7546 (1999)
- (53) B. I. Shklovskii and A. L. Efros, Electronic Properties of Doped Semiconductors, Springer Verlag, Heidelberg(1984)
- (54) M. Vogel, C. Brinkmann, A. Heuer and H. Eckert (unpublished results)
- (55) M. Vogel, C. Brinkmann, A. Heuer and H. Eckert, submitted to Phys. Rev. Lett.